

Binance Coin (BNB) is following an ascending support line and is approaching the $330 area, potentially making another attempt at breaking out.
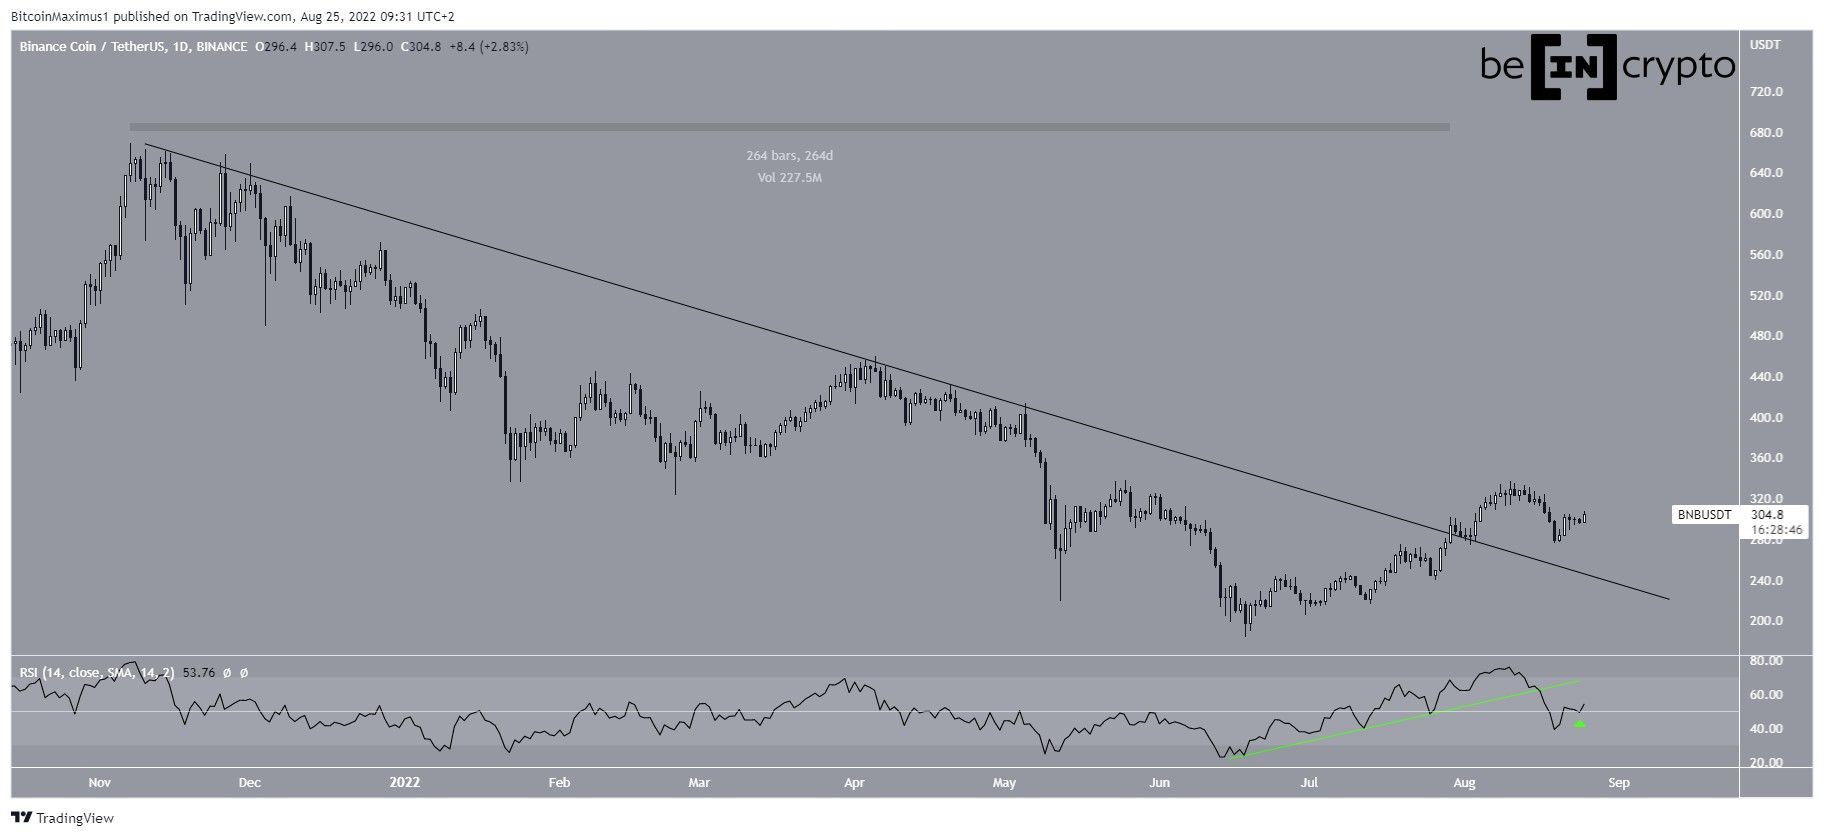
BNB has been moving upwards since reaching a low of $183.40 on June 18. The upward movement caused a breakout from a descending resistance line on July 29. At the time of the breakout, the line had been in place for 264 days.
Breakouts from such long-term structures usually lead to a sustained upward movement. However, that was not the case here, since the price decreased shortly after the breakout.
RSI breakdown
The daily RSI also fails to confirm the legitimacy of the breakout, since the indicator has broken down from an ascending support line.
However, it is currently making an attempt at moving above 50, something which would be considered a bullish development.
So, there are mixed signs in the daily time frame, coming from both the price action and indicator readings.
Breakout attempt
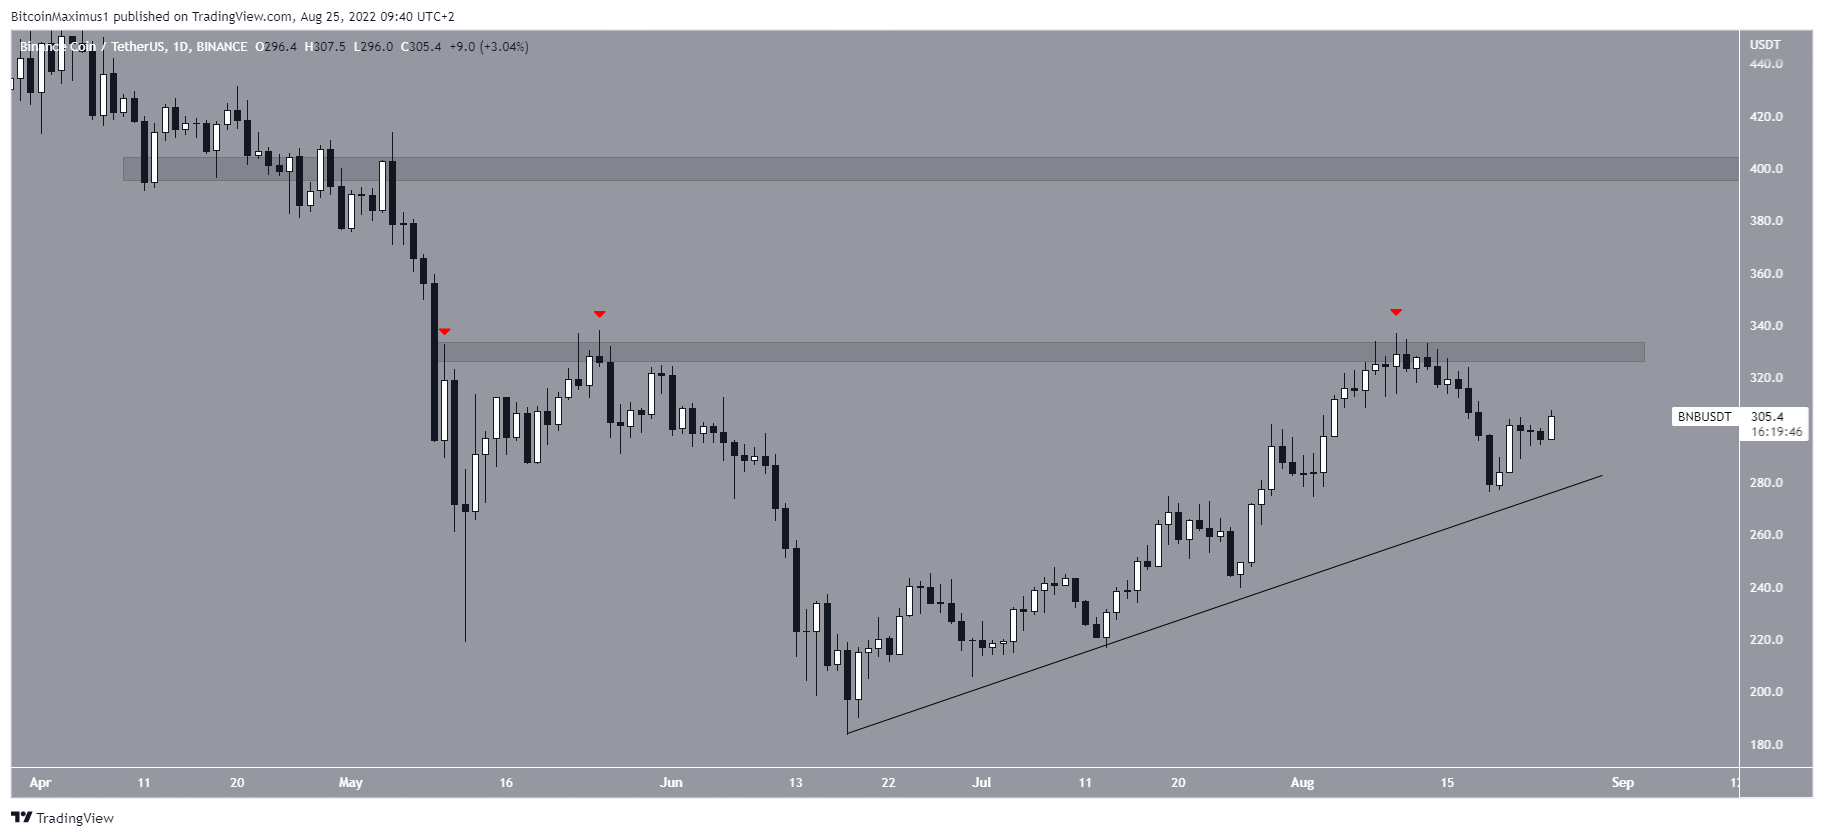
A closer look at the daily movement shows that the main resistance area is at $330. The area has caused three rejections until now (red icons).
Currently, BNB is following an ascending support line and is approaching the area once more, potentially making another attempt at breaking out.
A breakout above the $330 area would be expected to take the price towards the next resistance at $400. Conversely, a decrease below the ascending support line would indicate that new lows will follow.
BNB/BTC
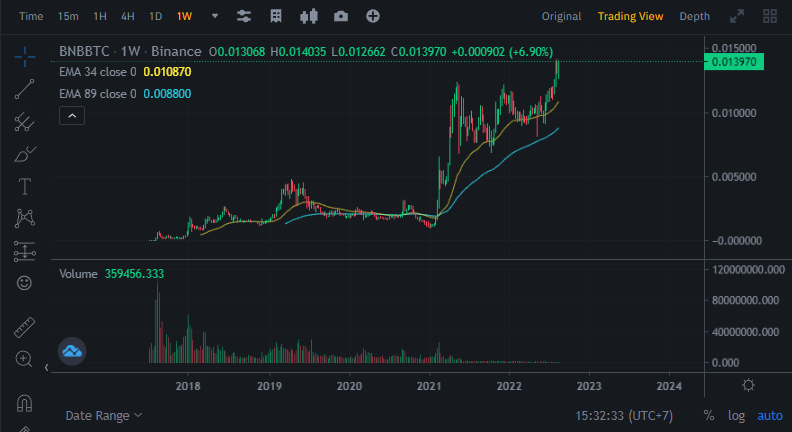
News account @BSC_Daily tweeted a chart that shows BNB has reached a new all-time high relative to BTC.
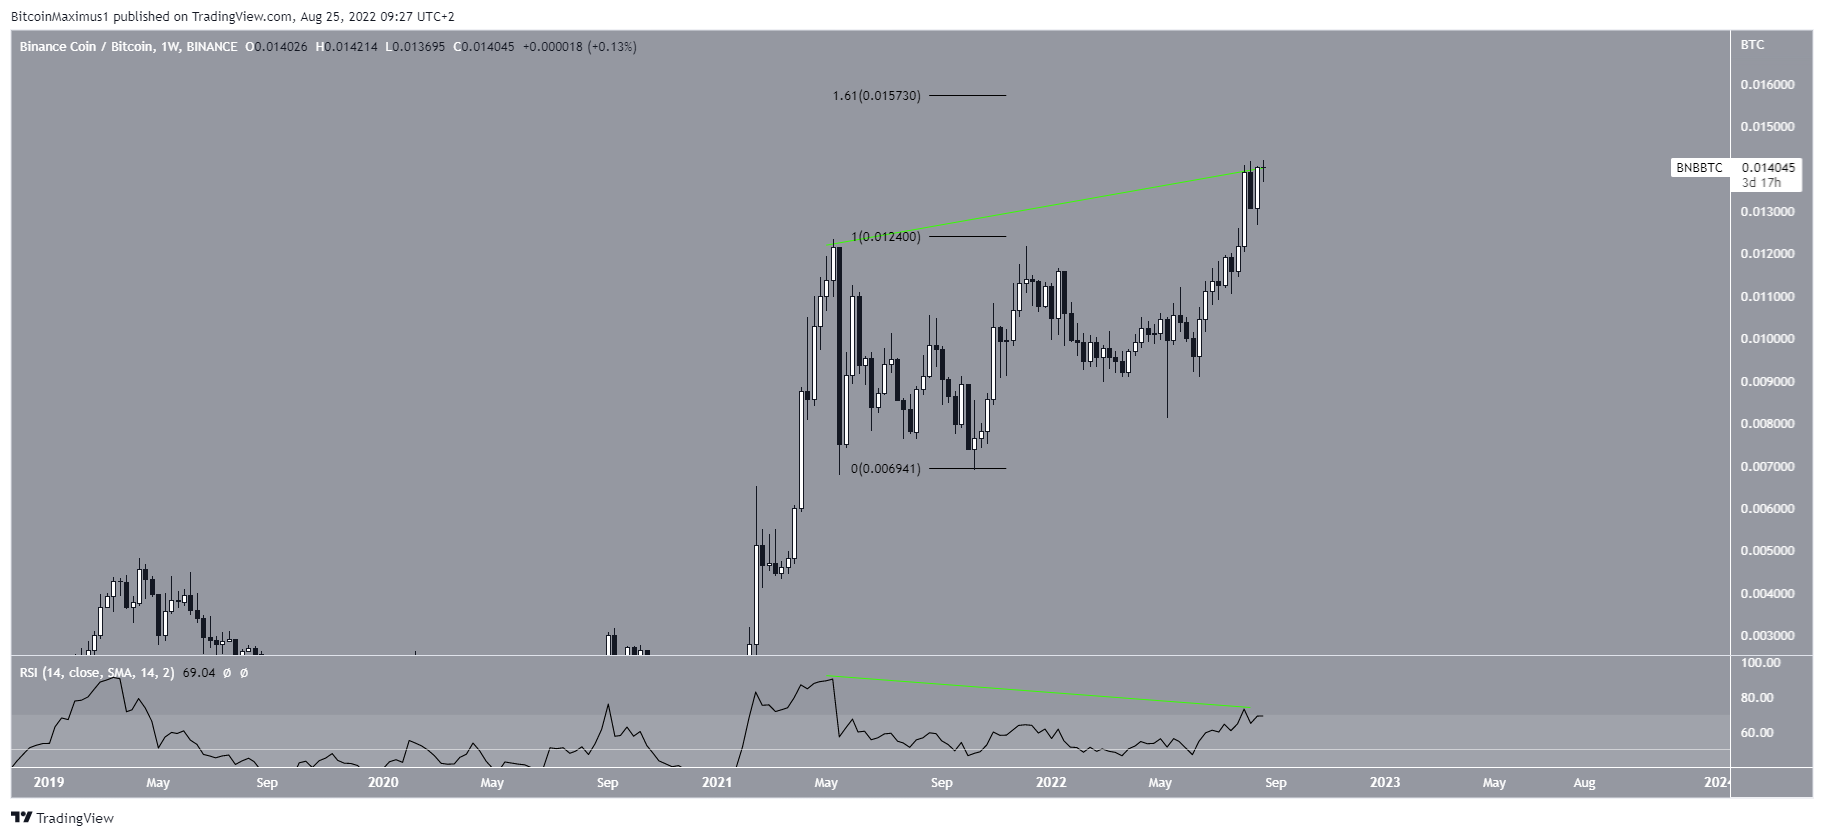
BNB reached an all-time high of ₿0.0142 on Aug 22. If the upward movement continues, the next resistance area would be at ₿0.0157, created by the 1.61 external Fib retracement resistance level. It is possible that the price will reach it.
However, there is a growing bearish divergence in the weekly RSI (green line). So, if the divergence is not invalidated by the time BNB reaches resistance, something which seems unlikely, it would be possible for the price to reach a local high there and then begin a downward movement.
For Be[in]Crypto’s latest Bitcoin (BTC) analysis, click here
Disclaimer
In line with the Trust Project guidelines, this price analysis article is for informational purposes only and should not be considered financial or investment advice. BeInCrypto is committed to accurate, unbiased reporting, but market conditions are subject to change without notice. Always conduct your own research and consult with a professional before making any financial decisions. Please note that our Terms and Conditions, Privacy Policy, and Disclaimers have been updated.
