
Berachain (BERA) is under heavy pressure, down 50% over the last seven days as technical indicators continue flashing warning signs. Momentum remains firmly bearish, with the RSI stuck deep in oversold territory and the DMI signaling that sellers are still in control.
The EMA setup also points to continued downside, raising the risk that BERA could break below $3.80 and hit new all-time lows. However, if bulls manage to step in, key resistance levels at $4.44 and $4.78 could come into play, opening the door for a potential recovery.
BERA RSI Is Struggling Below 30
Berachain’s RSI (Relative Strength Index) is currently sitting at 24.19, having remained below the oversold threshold of 30 since yesterday.
This persistent weakness in RSI indicates sustained bearish pressure, with the token struggling to regain bullish momentum.
Notably, BERA’s RSI has been below the neutral 50 mark since April 3, suggesting that the broader trend has been skewed to the downside for several days.
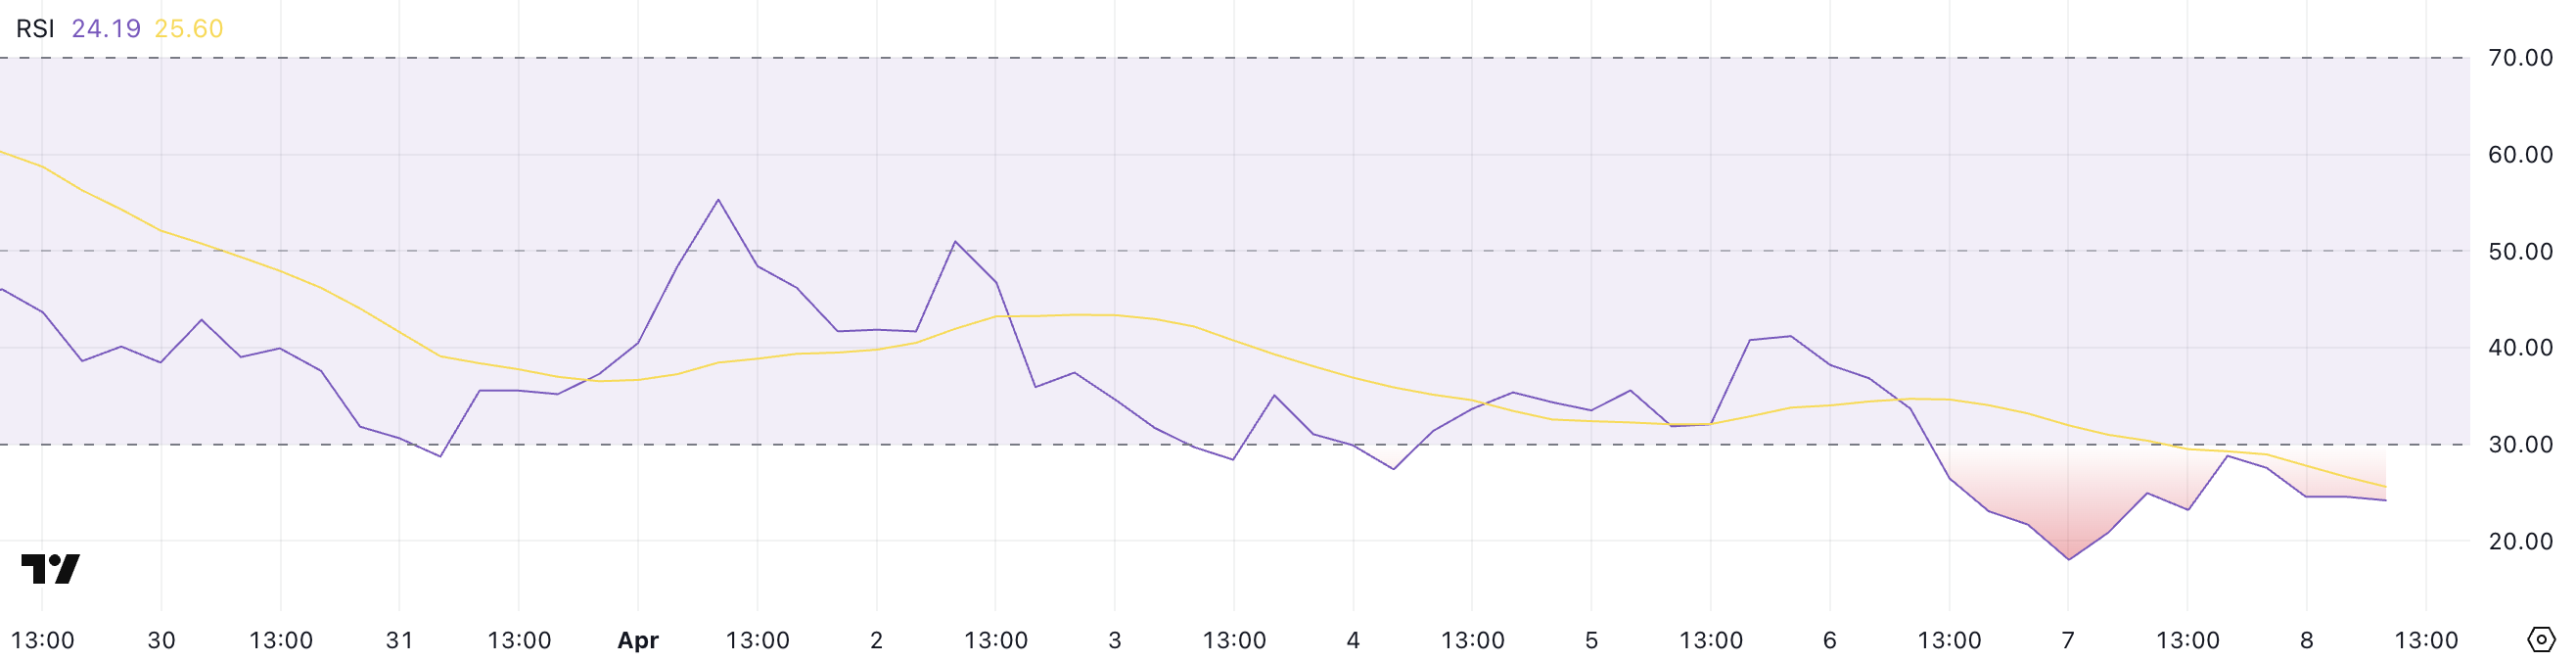
The RSI is a momentum oscillator that measures the speed and change of price movements on a scale from 0 to 100.
Readings above 70 typically indicate overbought conditions, while values below 30 suggest that an asset may be oversold and potentially primed for a rebound.
With BERA’s RSI deeply oversold at 24.19, a short-term bounce could occur if buyers step in, but unless it can break above the 50 level, the broader downtrend may remain intact.
Berachain DMI Shows Sellers Are Still In Control
Berachain’s DMI (Directional Movement Index) chart shows its ADX has climbed to 38.52, up significantly from 27.56 just two days ago. This sharp rise in ADX signals that the strength of the current trend — in this case, a bearish one — is intensifying.
An ADX value above 25 typically indicates a strong trend, and with it now approaching 40, market momentum appears to be gaining traction.
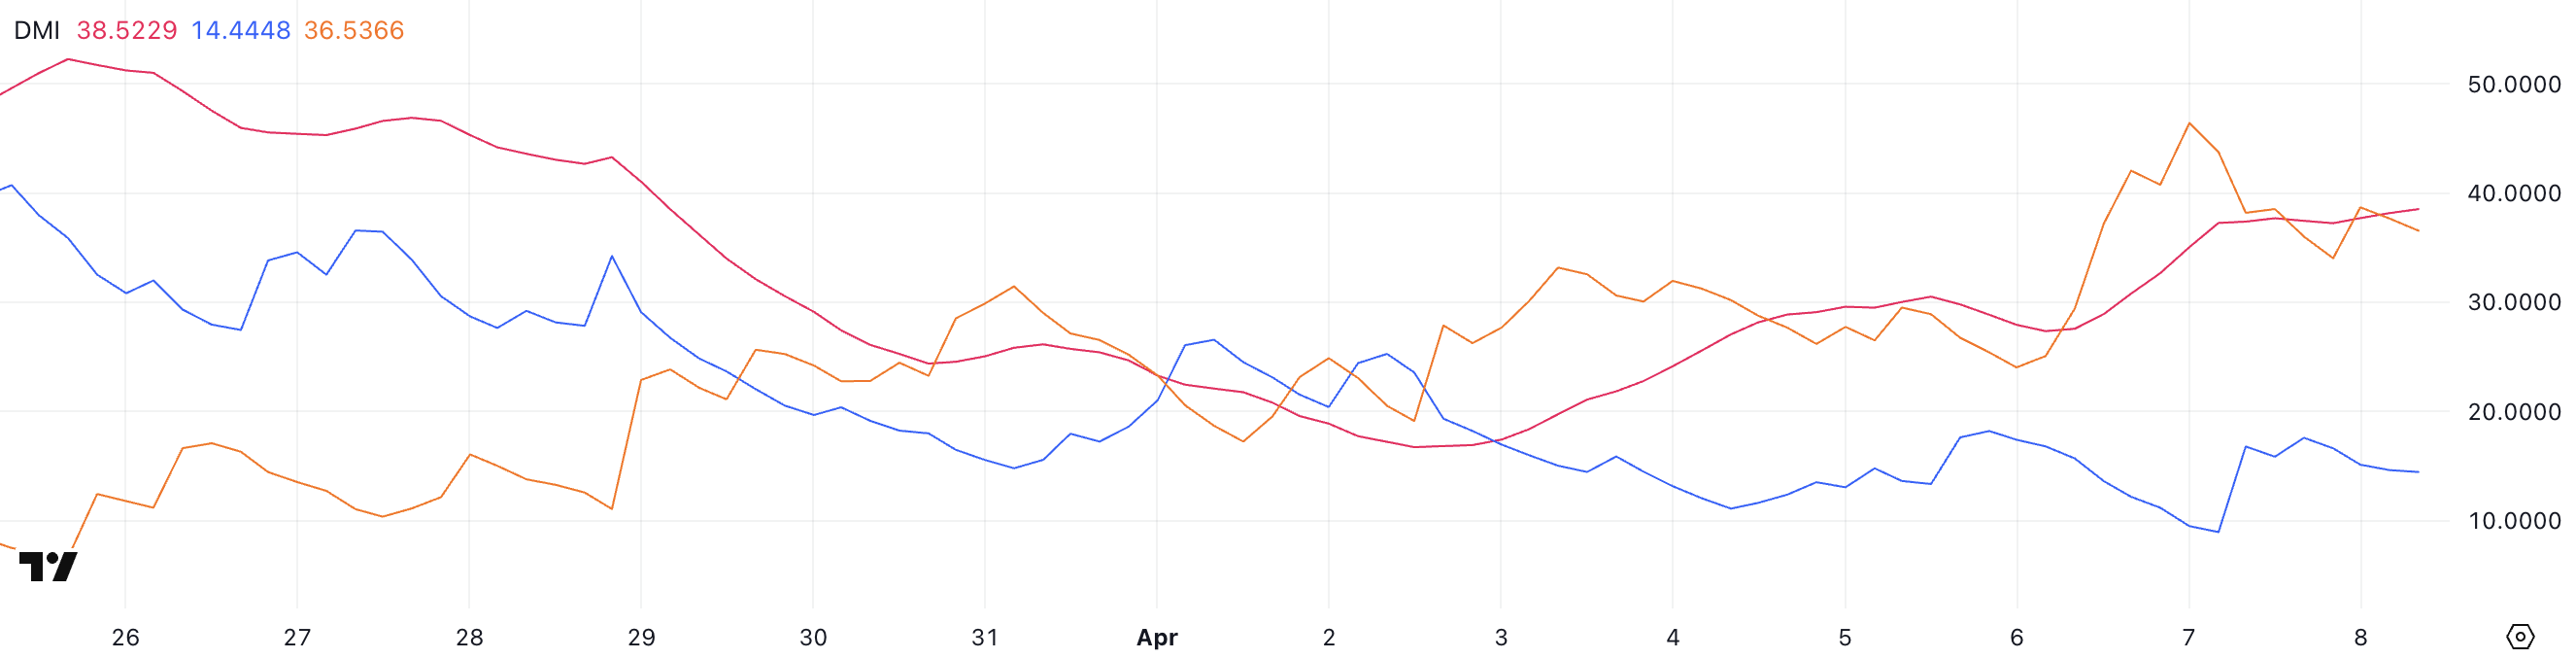
The DMI consists of two directional indicators: +DI, which tracks upward movement, and -DI, which tracks downward movement.
BERA’s +DI has risen from 8.94 to 14.44, showing a modest increase in bullish pressure, though it’s remained stable in the last several hours. Meanwhile, the -DI has dropped from 46.4 to 36.53, suggesting that bearish dominance is softening slightly.
While the narrowing gap between +DI and -DI points to a potential shift, the fact that -DI is still clearly in the lead, and ADX continues rising implies the downtrend remains in control — though bulls may be starting to push back.
Will Berachain Make New All-Time Lows Soon?
Berachain’s price chart currently shows a bearish EMA setup, with short-term moving averages positioned below the long-term ones — a classic signal that downward momentum may persist.
If this correction continues, BERA could fall below the $3.80 mark, setting a new all-time low and further shaking investor confidence in the short term.
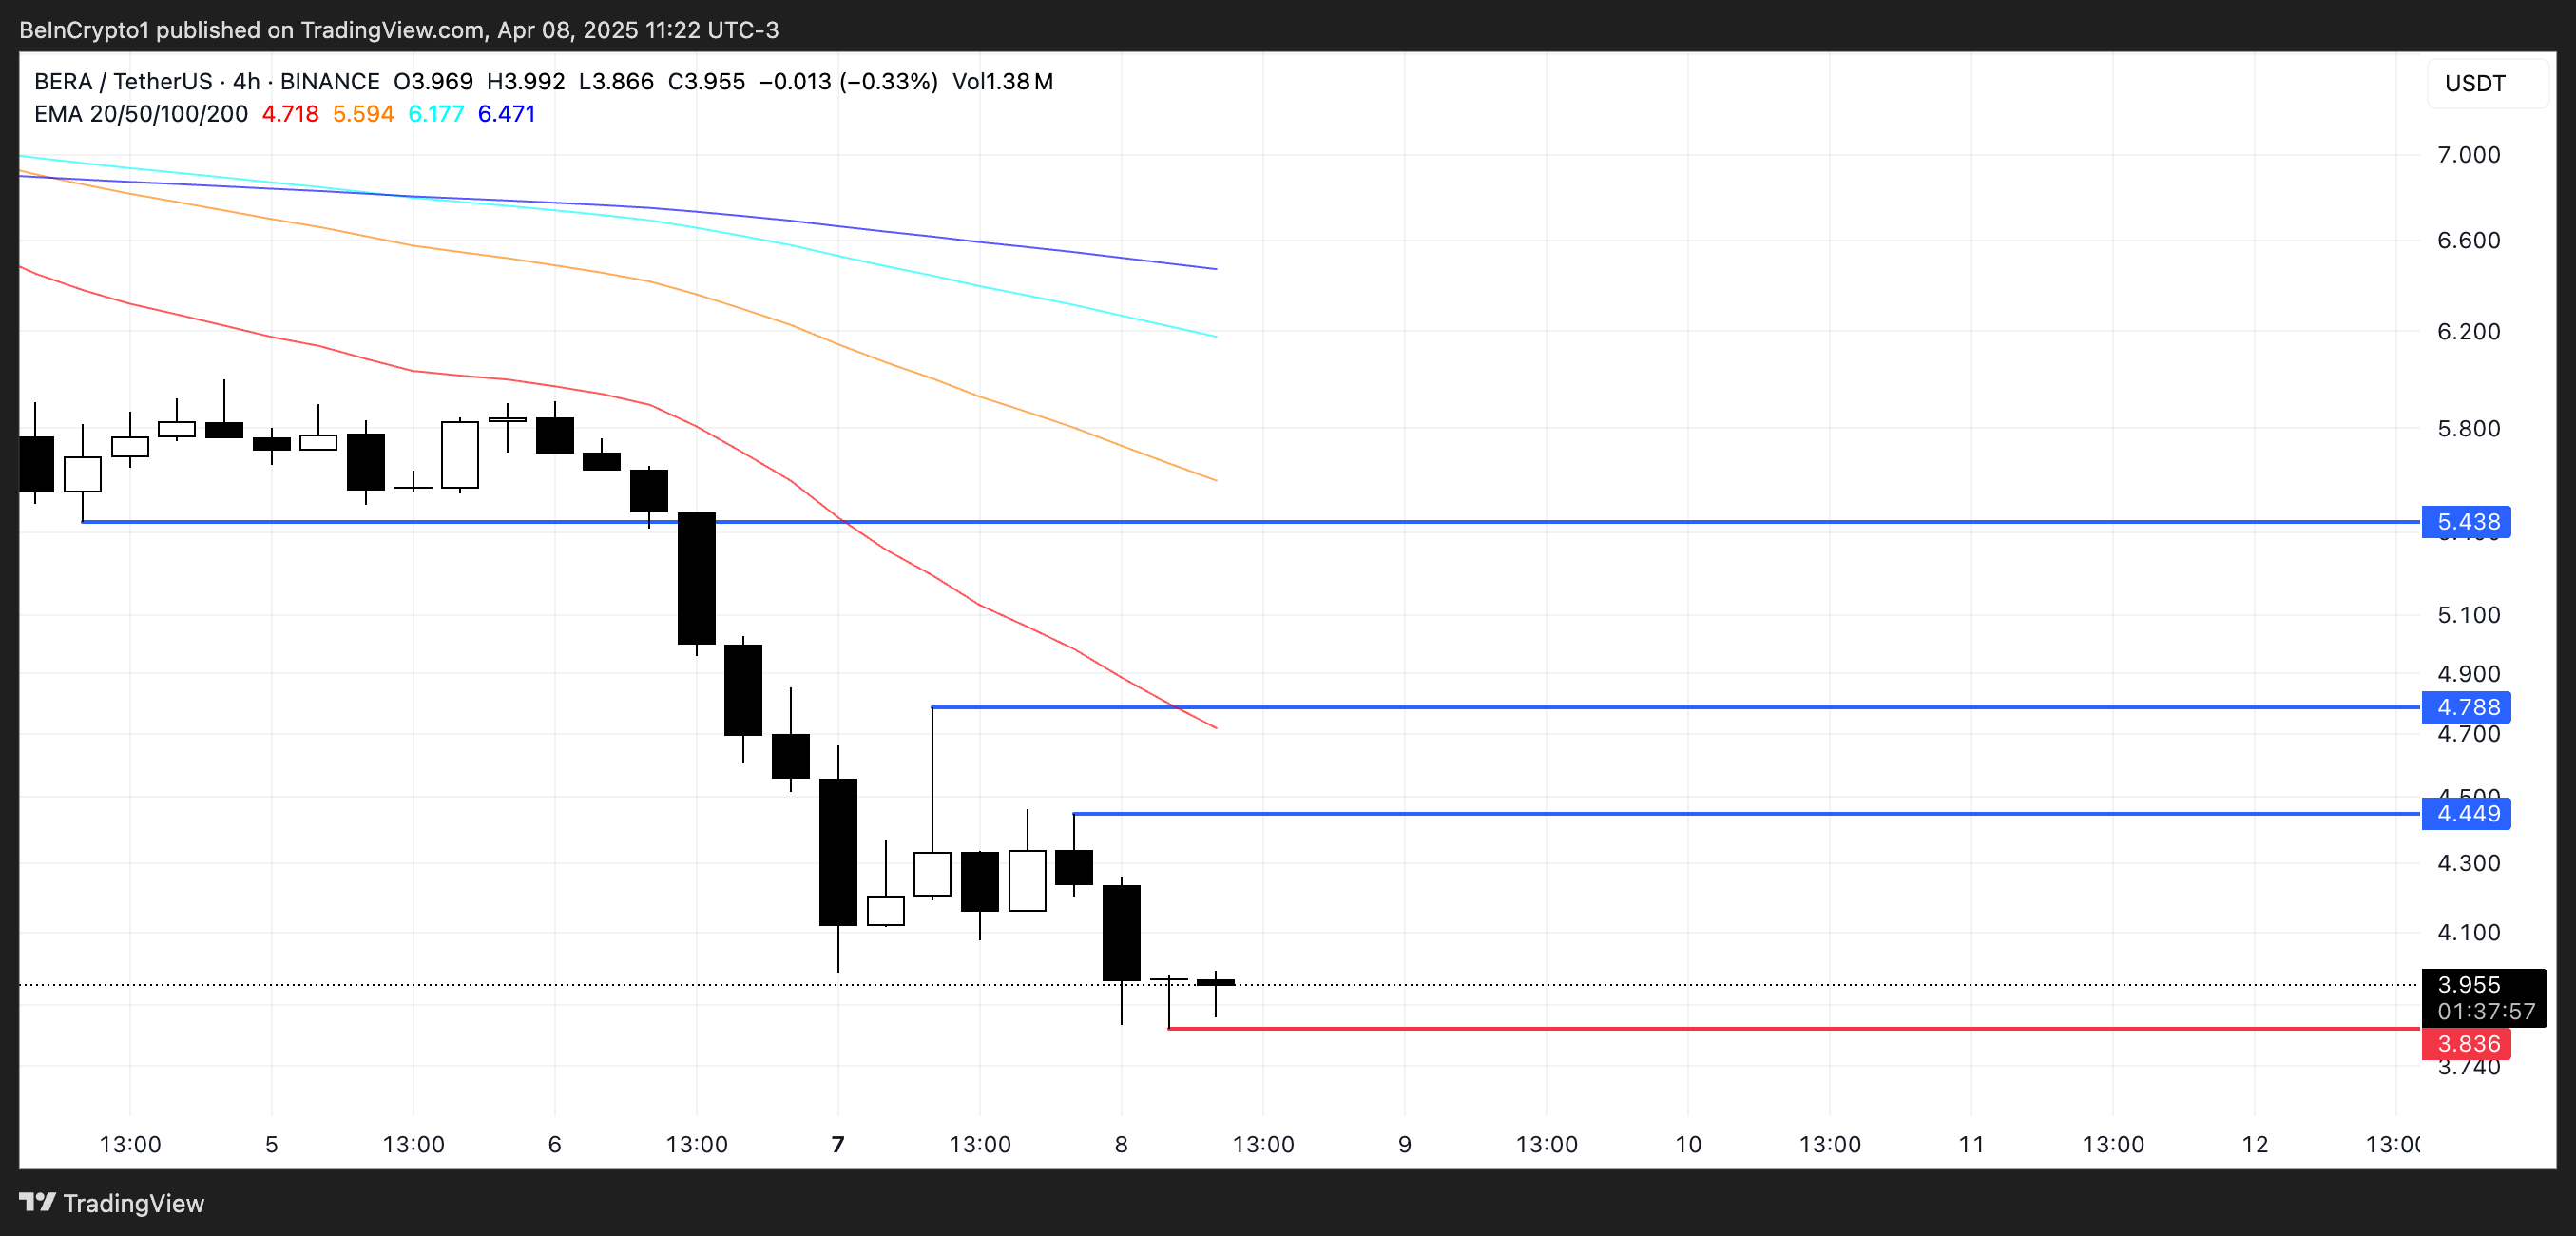
However, if the trend reverses and buyers step in with strength, BERA could begin climbing toward key resistance levels. The first major hurdle is at $4.44, and a breakout above that could open the path to $4.78.
Should bullish momentum return in full force, Berachain may even rally to retest the $5.43 level, signaling a potential shift back into an uptrend.
