


Berachain (BERA) has defied the broader market downtrend, surging by 2% in the past 24 hours. It now ranks as the market’s top gainer for Friday.
The positive price movement signals growing demand for the altcoin, positioning it for a potential sustained uptrend.
Berachain Price Rally Signals Bullish Momentum
BERA’s Super Trend indicator, assessed on a 12-hour chart, confirms the bullish pressure in its market. Exchanging hands at $7.57, BERA currently trades above the dynamic support offered by this indicator at $5.53.
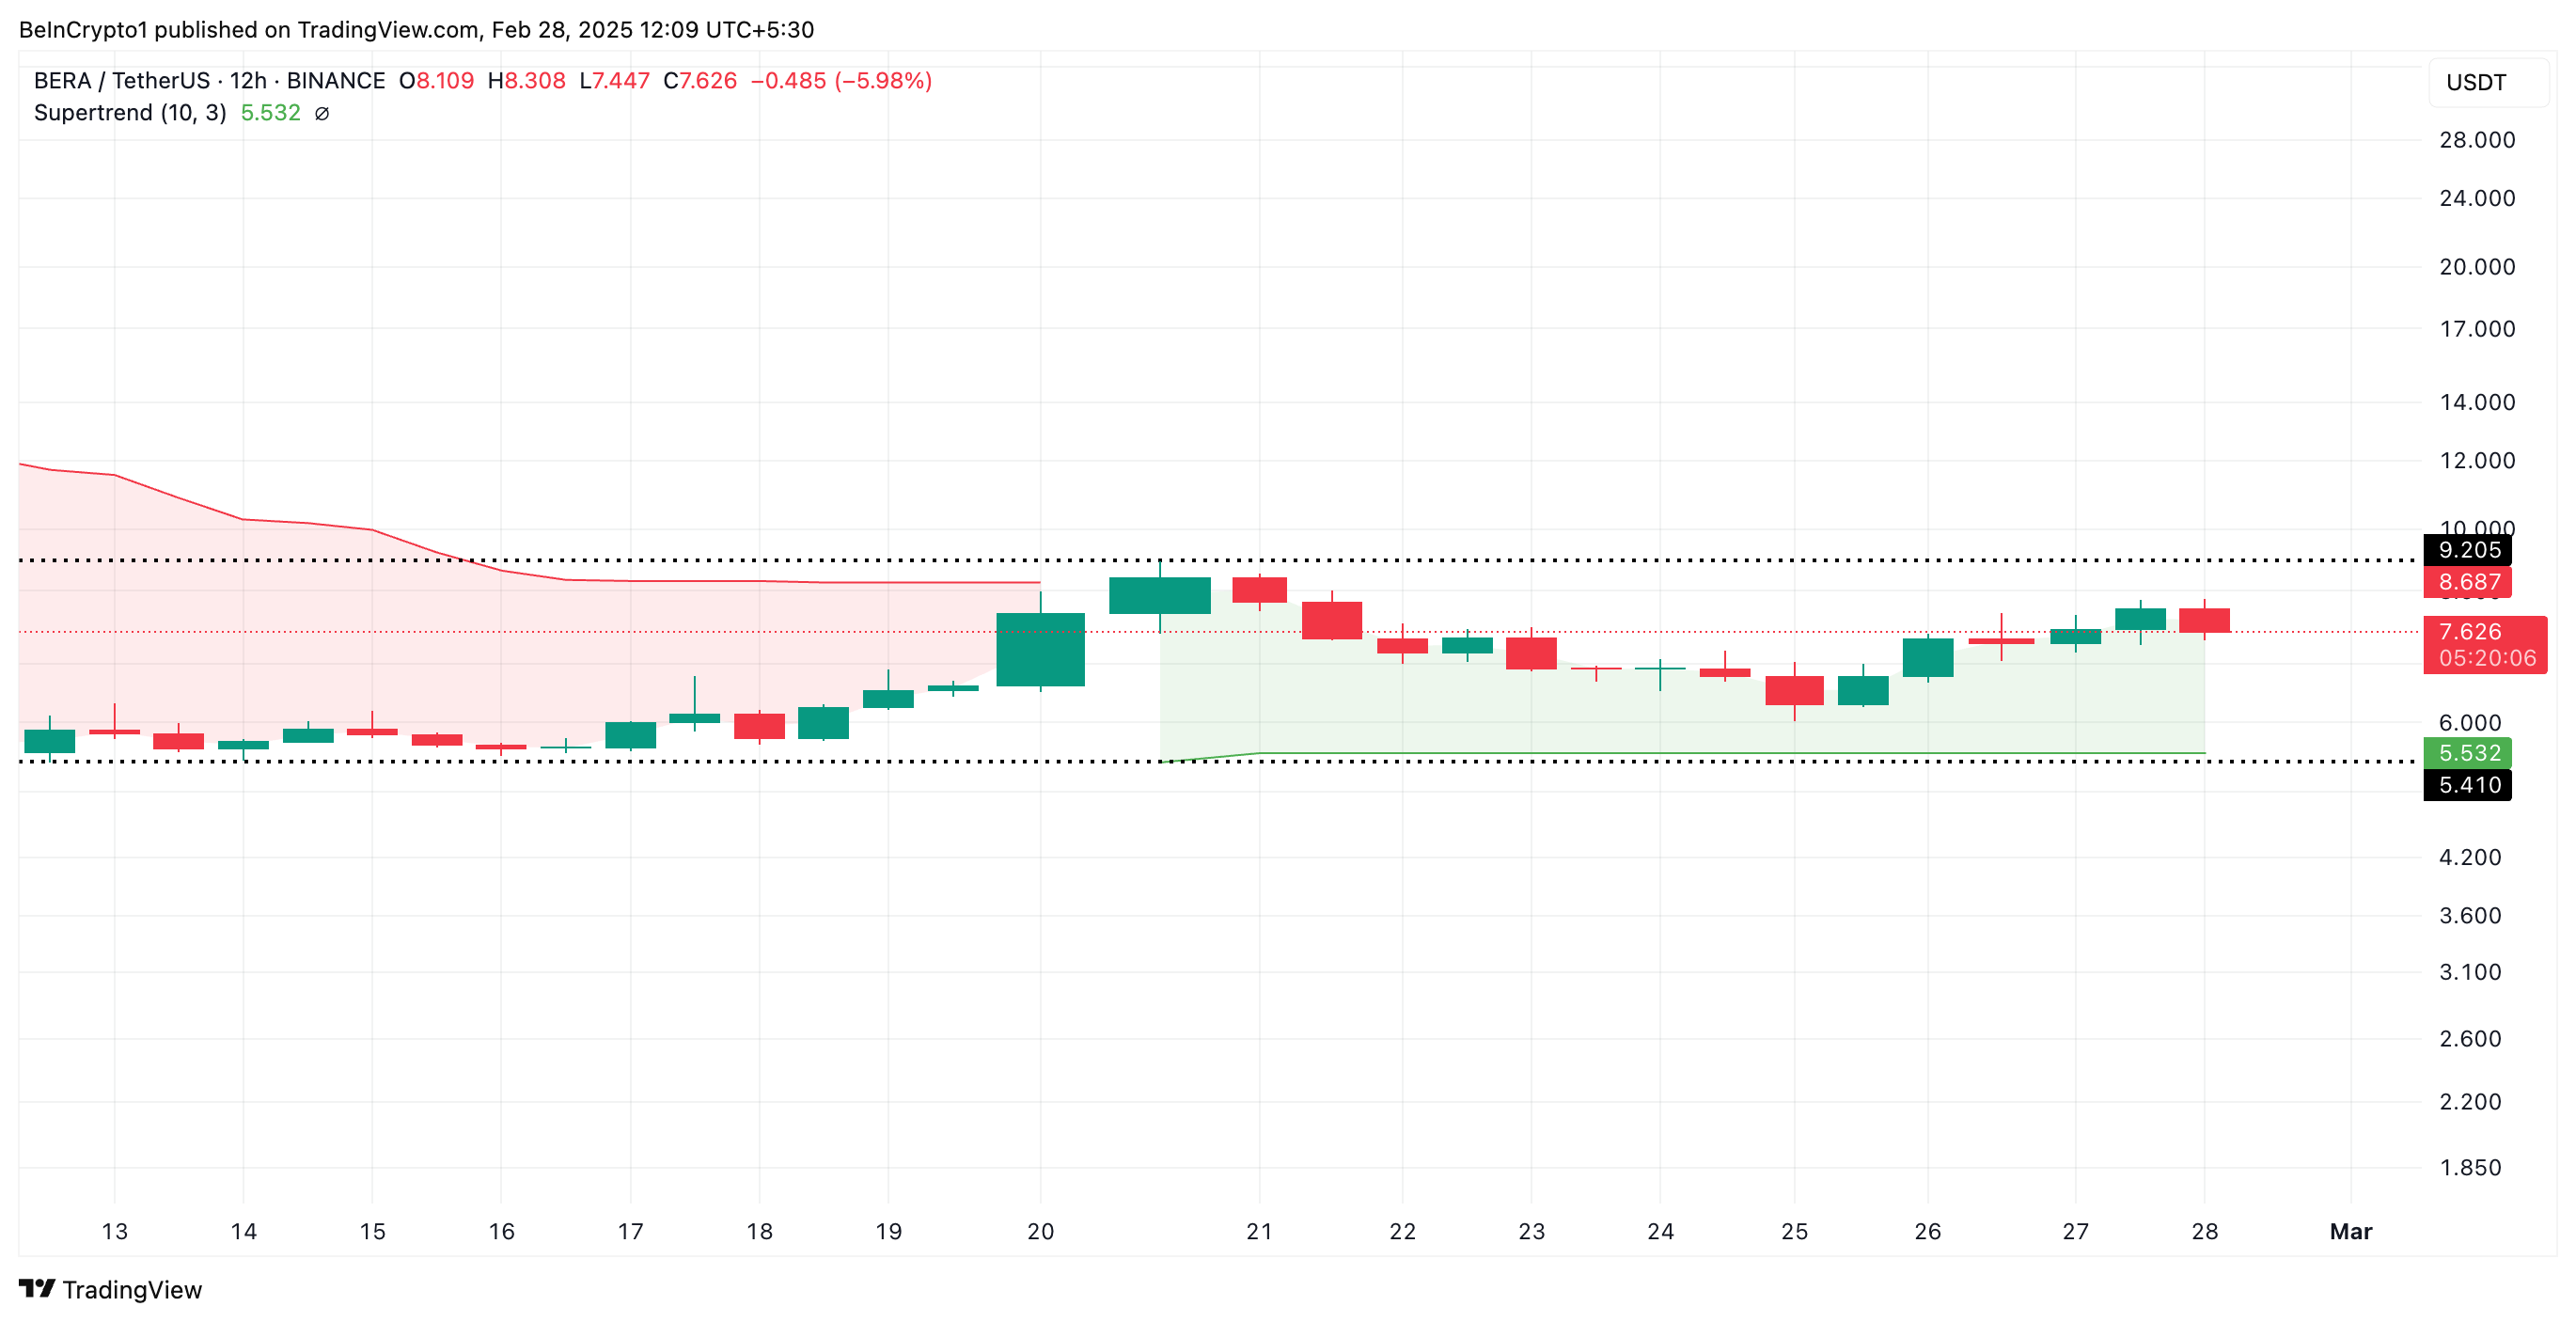
An asset’s Super Trend indicator measures the direction and strength of its price trends. It appears as a line on the price chart, changing color to signify the current market trend: green for an uptrend and red for a downtrend.
As with BERA, when an asset’s price trades above the Super Trend indicator, it is in a bullish trend. This signals that market participants favor buying over selloffs. Traders view it as a buy signal or a warning to exit short positions and take long ones.
Furthermore, BERA’s Accumulation/Distribution (A/D) Line has been in an uptrend in recent days, confirming the bullish outlook. This indicator measures the flow of money into or out of an asset by analyzing price movements and trading volume.
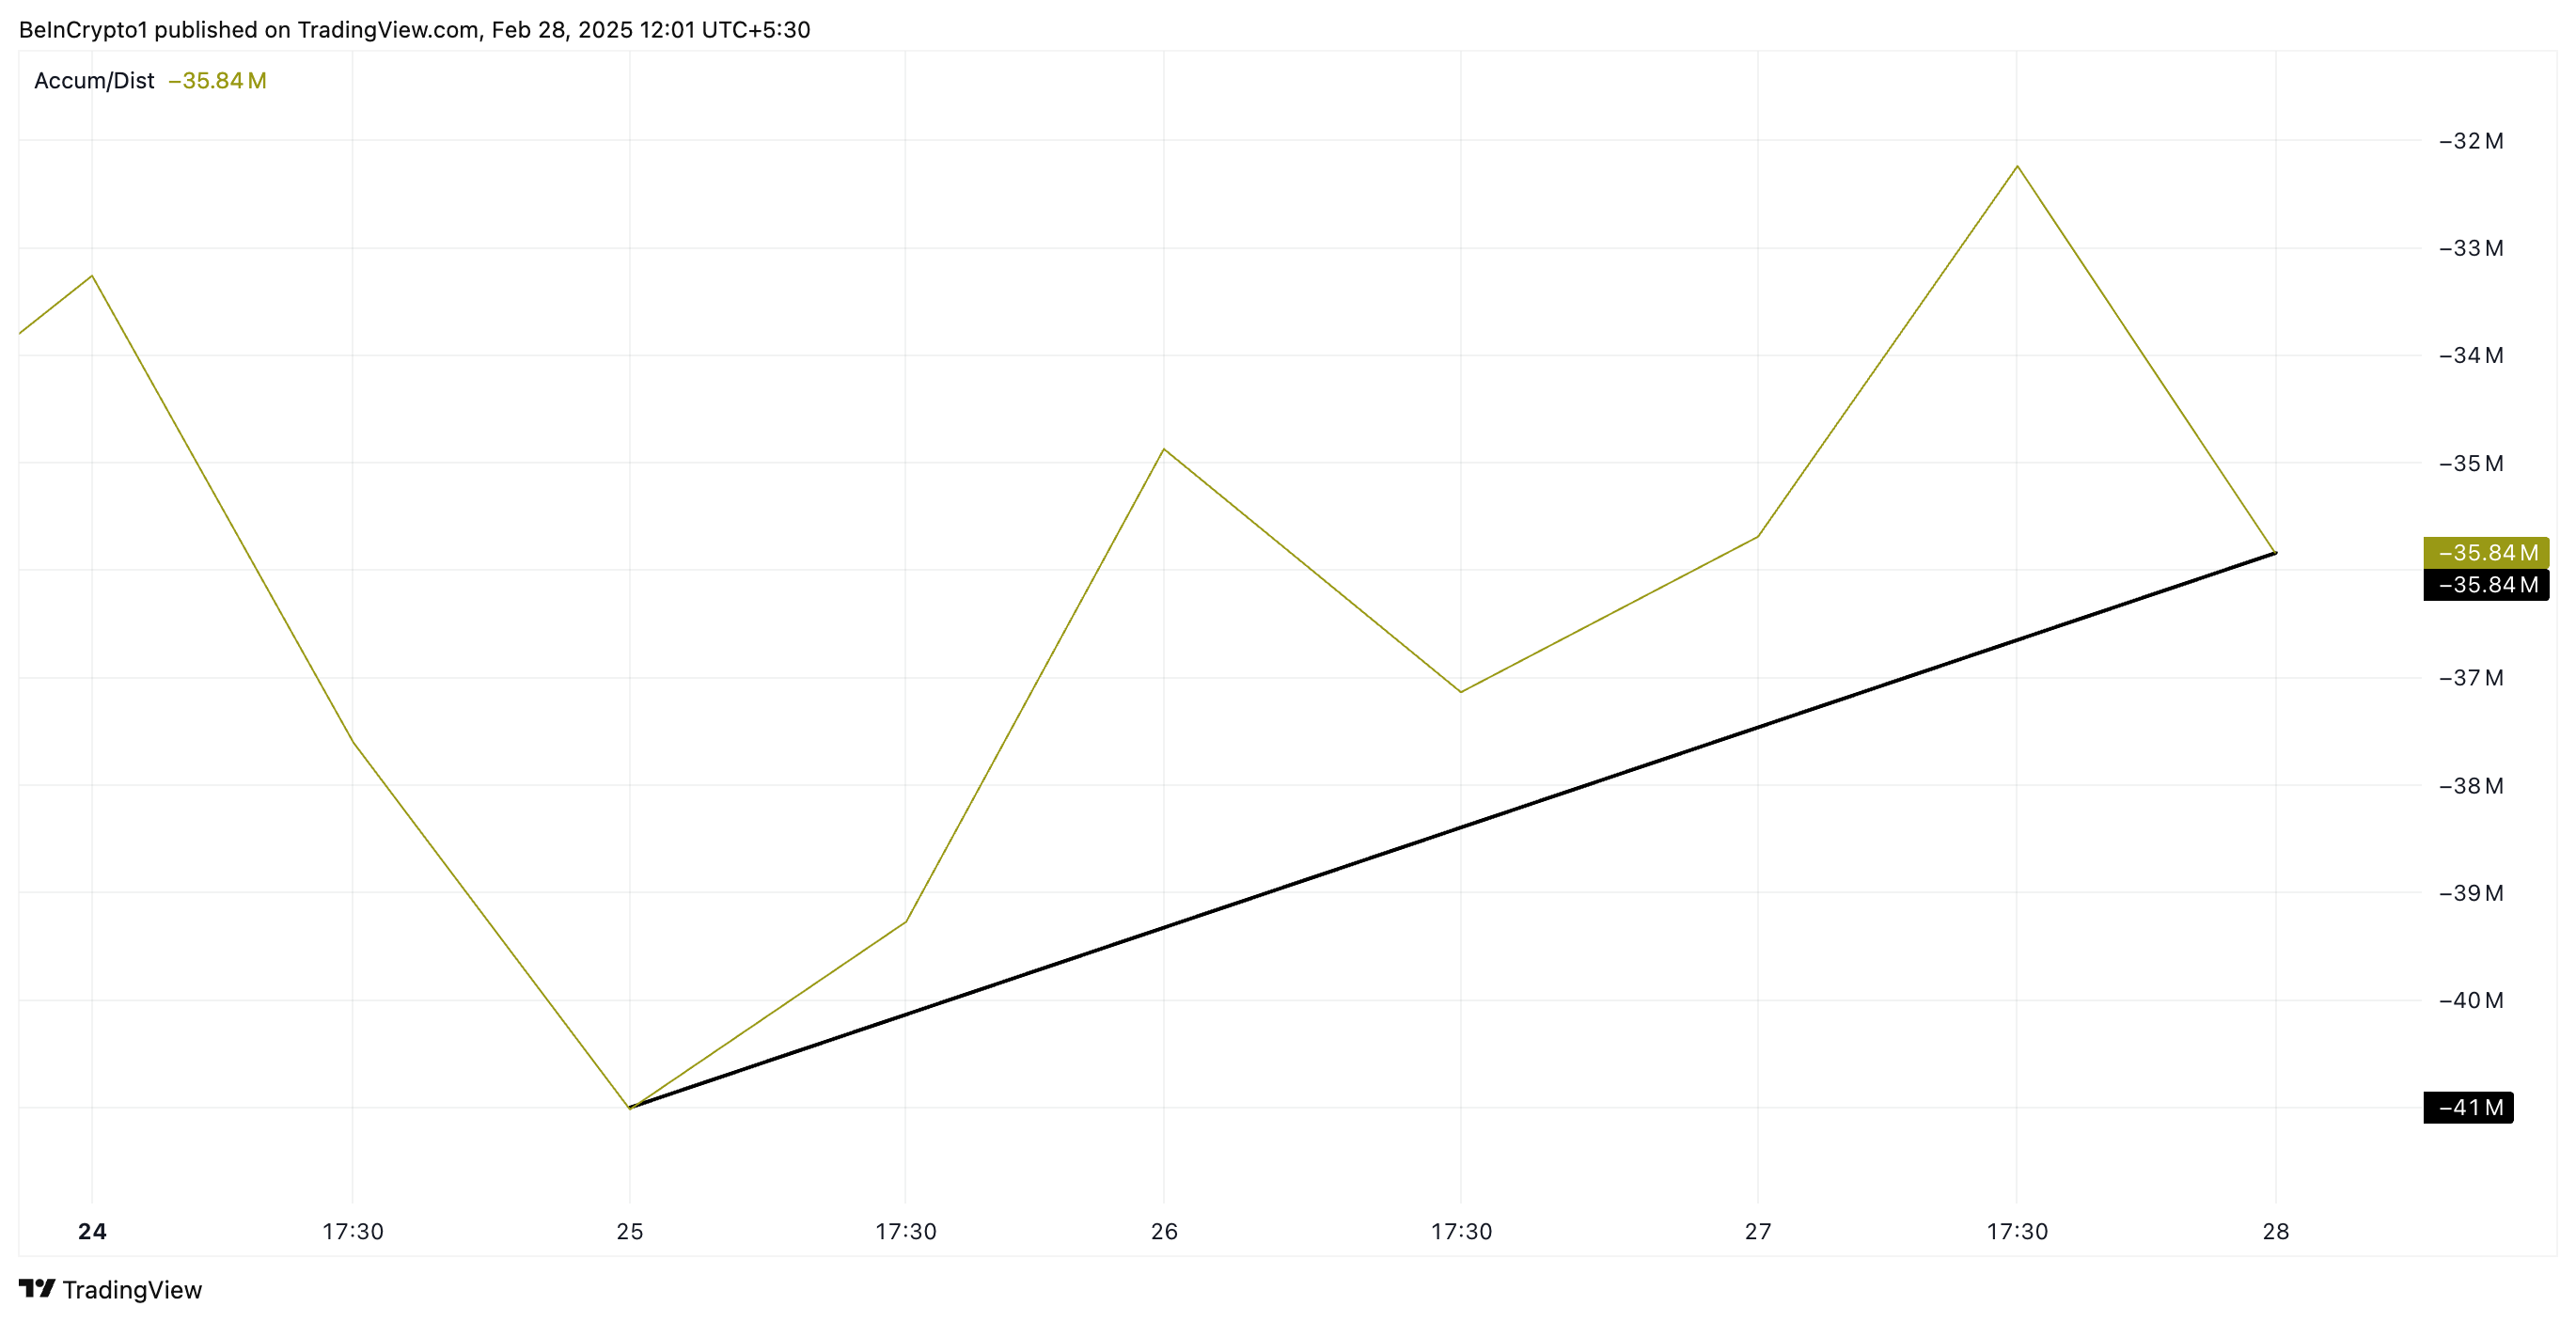
When the A/D Line climbs like this, it indicates that buying pressure is increasing, suggesting that more traders are accumulating the asset rather than selling it.
Can BERA Sustain Its Rally, or Will Profit-Taking Push It Lower?
On the daily chart, BERA trades above support at $7.45. If demand strengthens, BERA could rally further from this level to exchange hands at $8.57. A successful breach of this resistance could propel the altcoin back above $9.
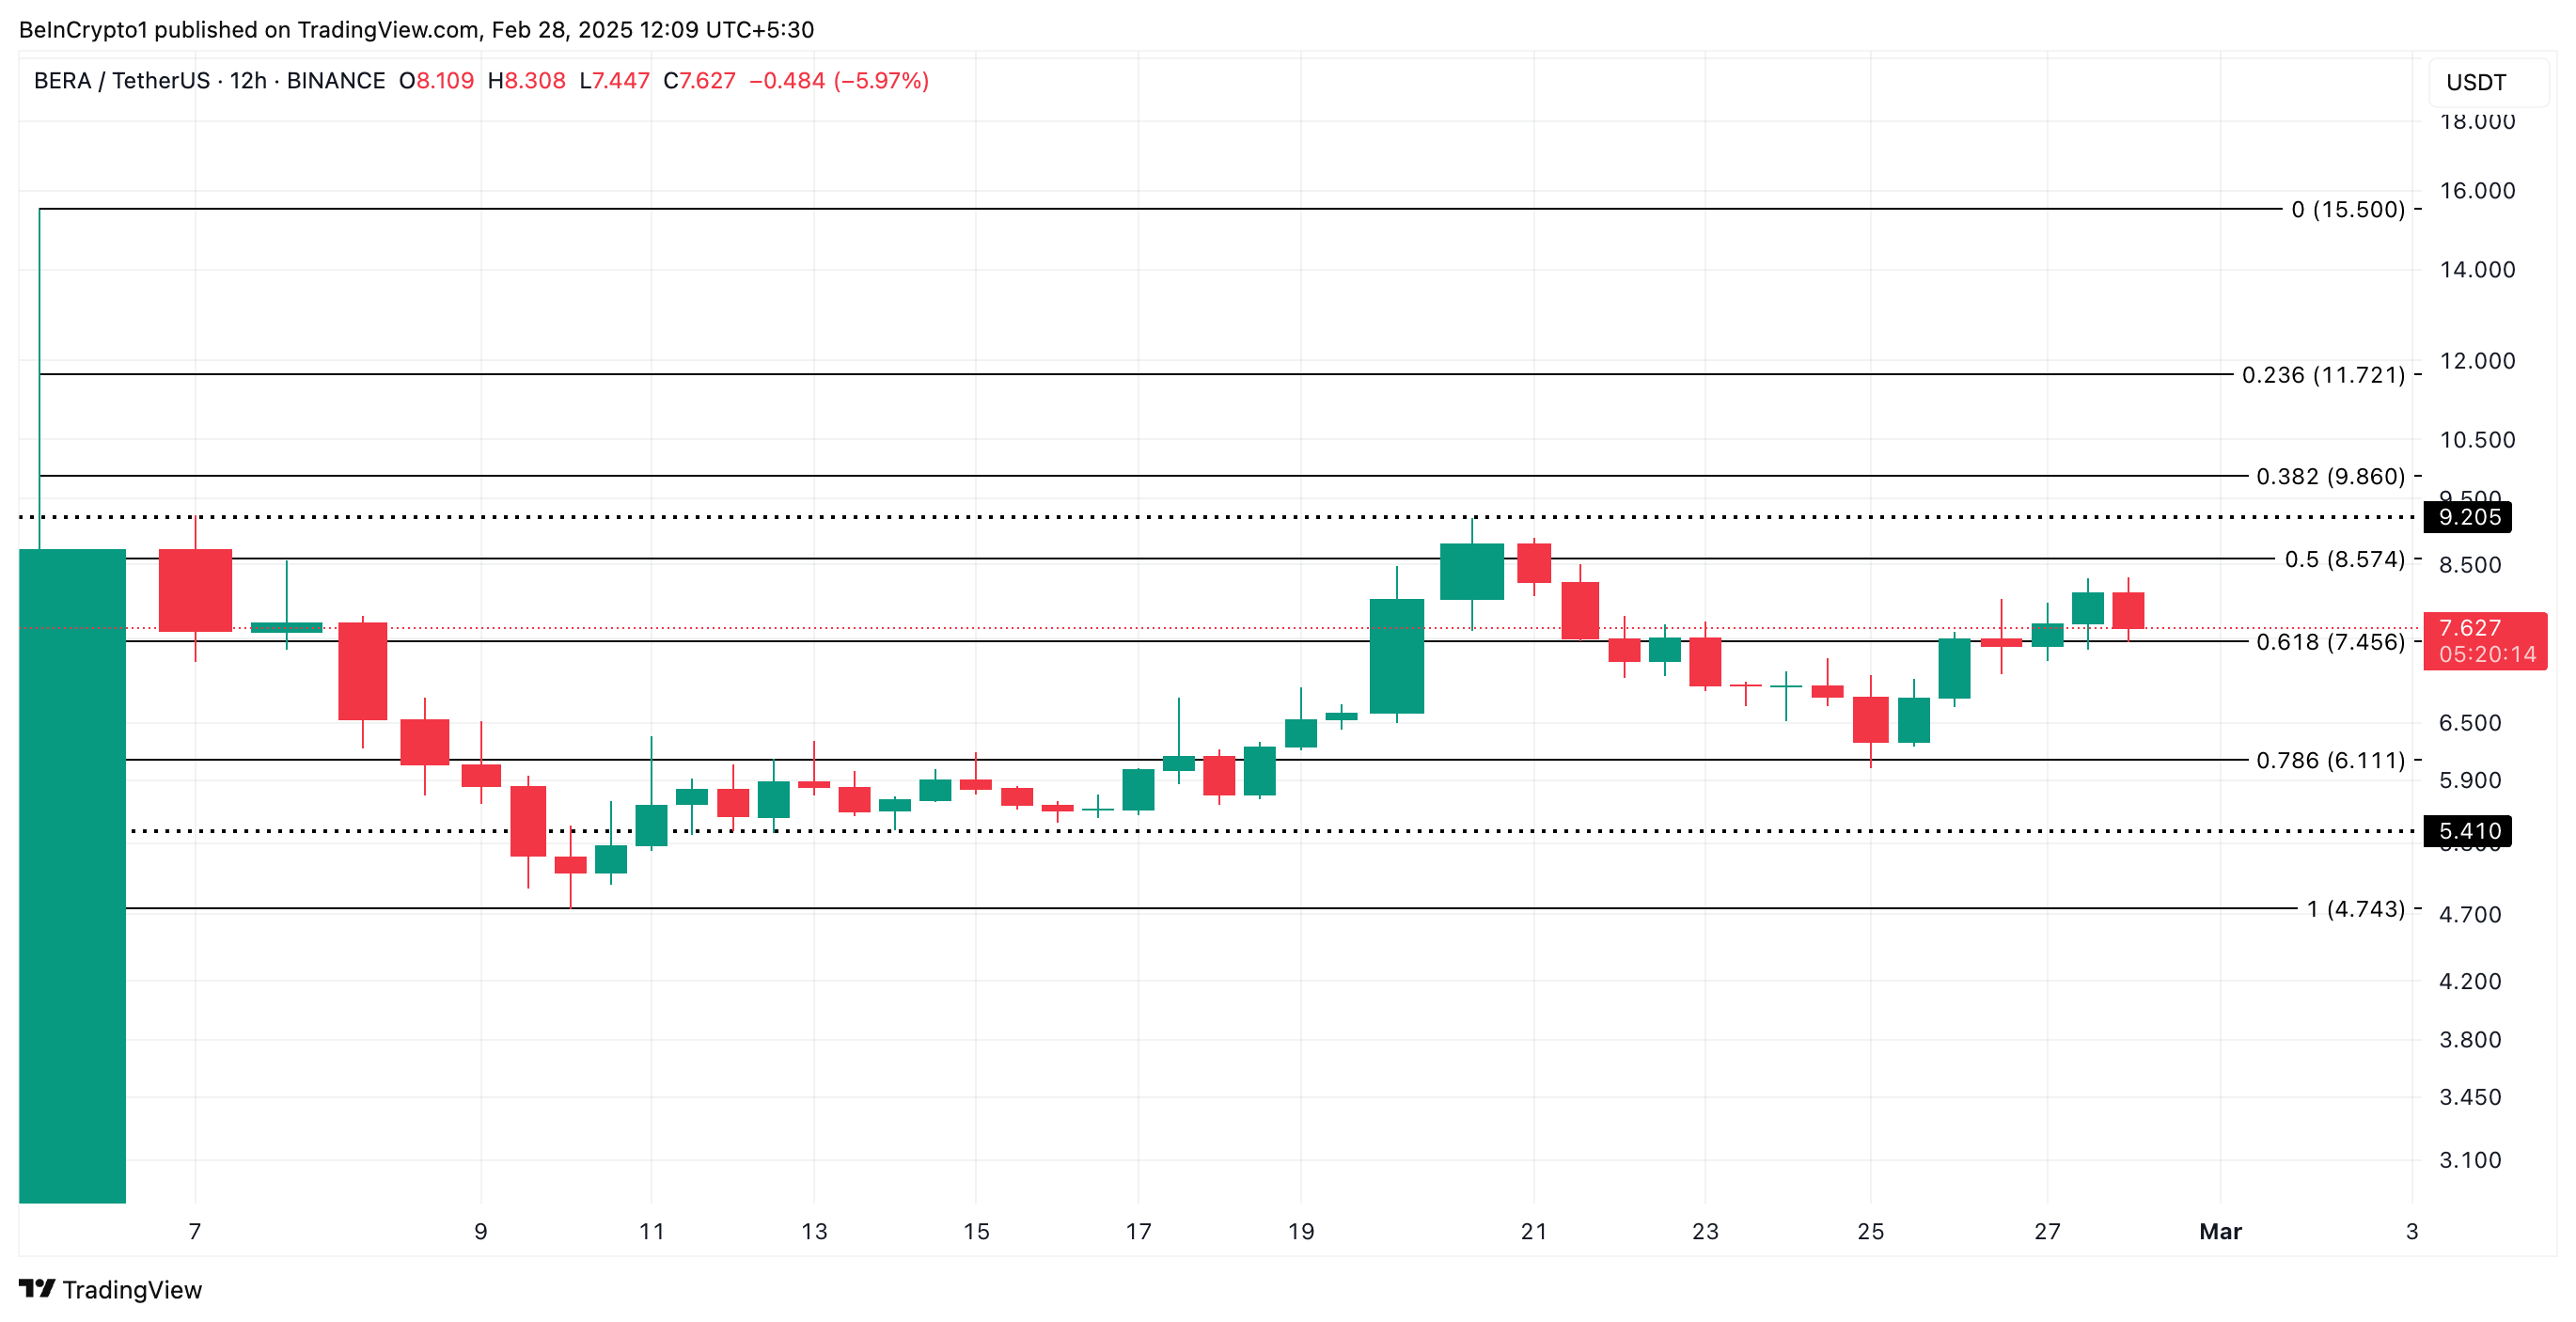
However, a spike in profit-taking activity would invalidate this bullish projection. If selling pressure gains momentum, BERA could shed its recent gains and plummet below the $7.45 support to trade at $6.11.



