


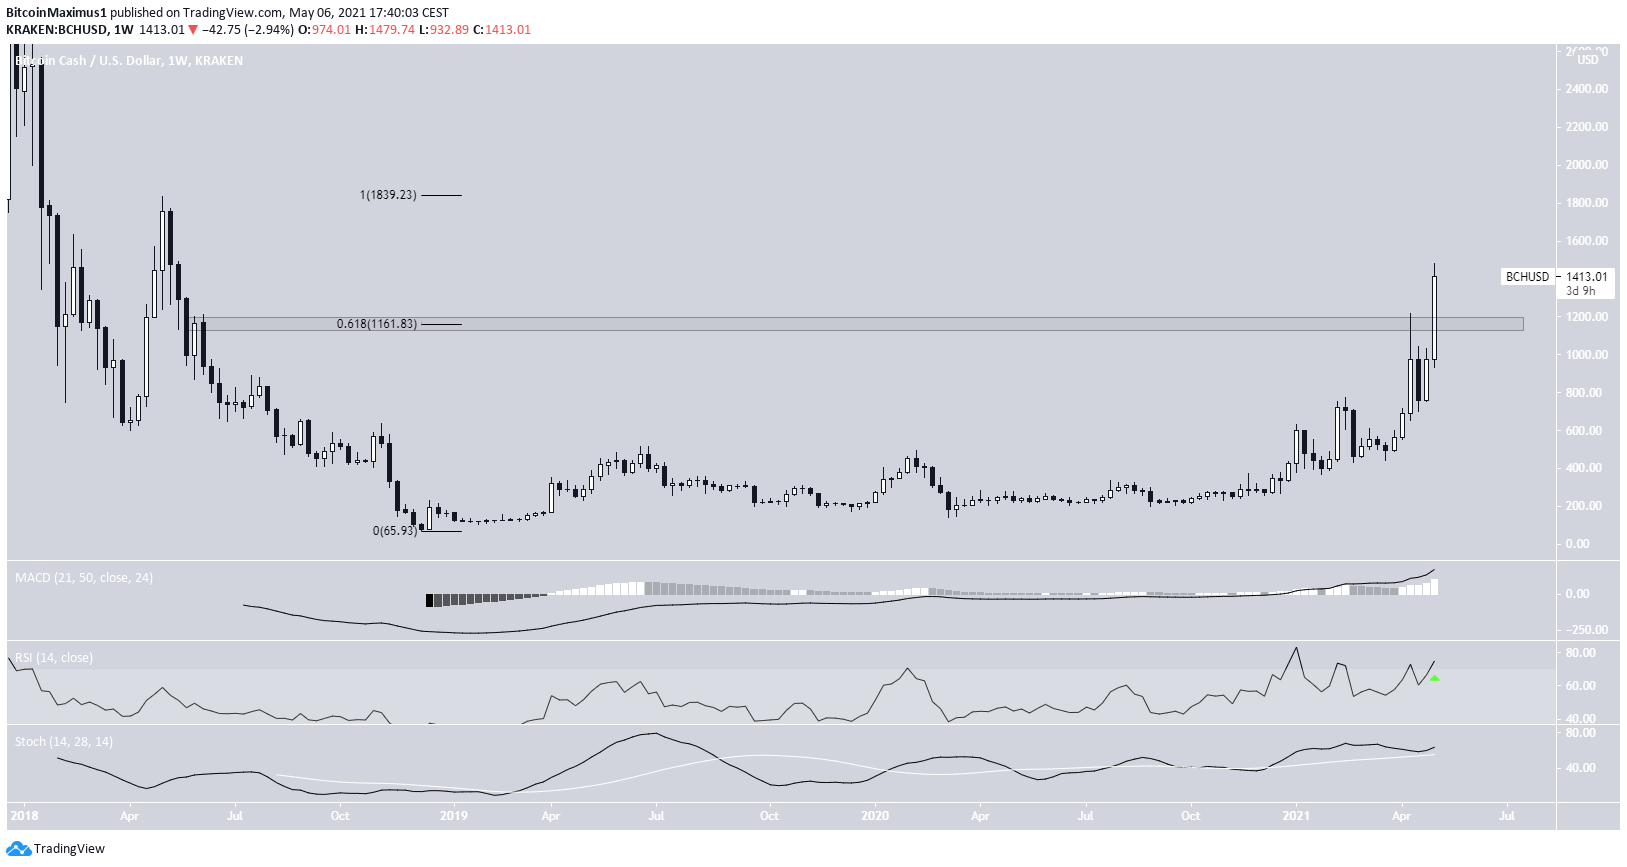
Bitcoin Cash (BCH) has broken out from a long-term resistance area at $1,160.
BCH is expected to continue moving upwards towards the next closest resistance area.
Long-term BCH breakout
BCH made a breakout attempt on April 2 but was rejected by the long-term $1,160 resistance area. After a decrease, it is making another breakout attempt and has moved considerably above the area. If it stands, the current weekly close would be the highest since 2018.
Technical indicators are bullish. This is especially visible by the RSI cross above 70. In addition, both the MACD & Stochastic Oscillator are increasing.
The next closest resistance area is found at $1,840.
Wave count
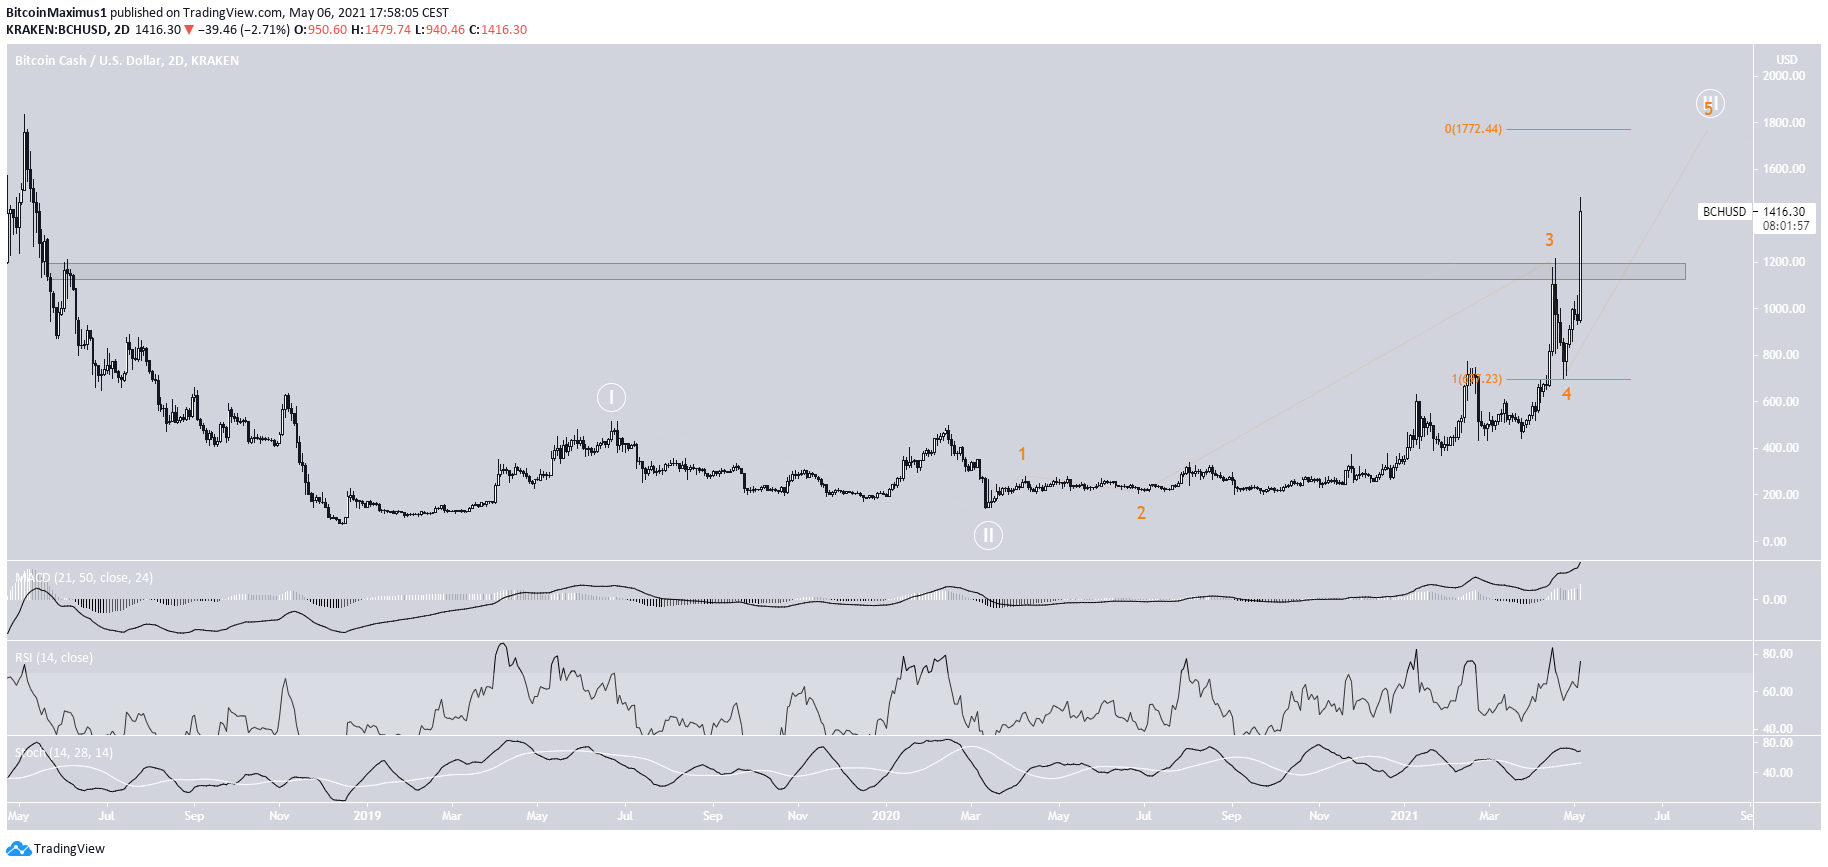
The wave count is not entirely clear. The most likely one has this being sub-wave five (orange) of a long-term wave three (white).
A potential target for the top of the upward movement is found at $1,770. This is close to the long-term resistance level outlined in the previous section.
Similarly to the weekly time-frame, technical indicators in the daily one support this upward movement.
After the target is reached, a significant correction would be likely.
BCH/BTC
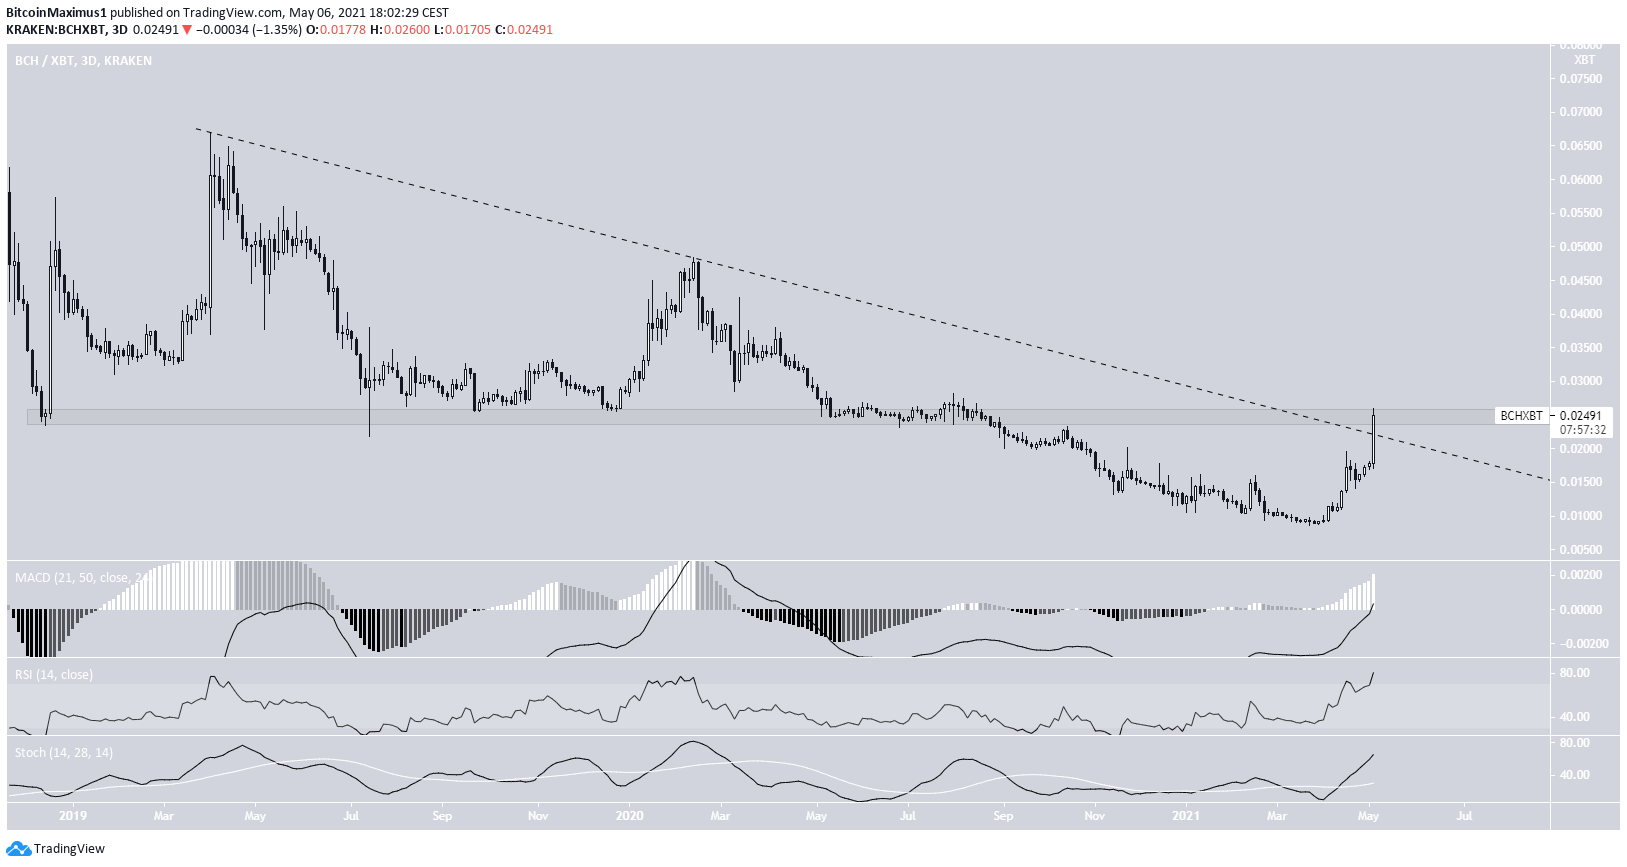
BCH/BTC has just broken out from a descending resistance line that had previously been in place since March 2019.
However, it is still trading below the main resistance area at ₿0.025. Until it clears it, we cannot consider the long-term trend bullish.
Nevertheless, it looks likely that BCH will be successful in breaking out above it. The RSI has just crossed above 70 and both the MACD & Stochastic Oscillator are moving upwards.
Once it does, we can consider the long-term trend bullish.
To conclude, BCH/USD is expected to continue its upward movement towards the next resistance near $1,800.
BCH/BTC is expected to reclaim the ₿0.025 resistance area.
For BeInCrypto’s latest bitcoin (BTC) analysis, click here.



