
NOTE: At the time of writing, Bitcoin Cash (BCH) was still trading under $300. BCH broke past $300 on April 3. The graphs used below reflect the pre-$300 levels. The rise above $300 does not affect our analysis or predictions for the month of April.
On Dec 12, 2018, the price of Bitcoin Cash (BCH) made a low of $92.32. A sharp upward move began on Dec 19.
A few days later, Bitcoin Cash encountered a reversal. Price steadily dropped until around mid-February.
A rapid spike resulted in a subsequent crash that brought prices back to the same trading levels until Mid-March. At this point, Bitcoin Cash emerged on a gradual uptrend.
Price increases accelerated during a market-wide spike on Apr 2, 2019.
Will Bitcoin Cash continue rising through the month or fall back to March’s earlier trading levels?
Bitcoin Cash (BCH): Key Trends And Highlights
- BCH/USD has been in an uptrend since Dec 12, 2018.
- It broke out from an ascending triangle on Apr 2, 2019.
- The breakout occurred with substantial volume.
- It is trading above the daily moving averages.
- There is resistance near $400.
Ascending Triangle
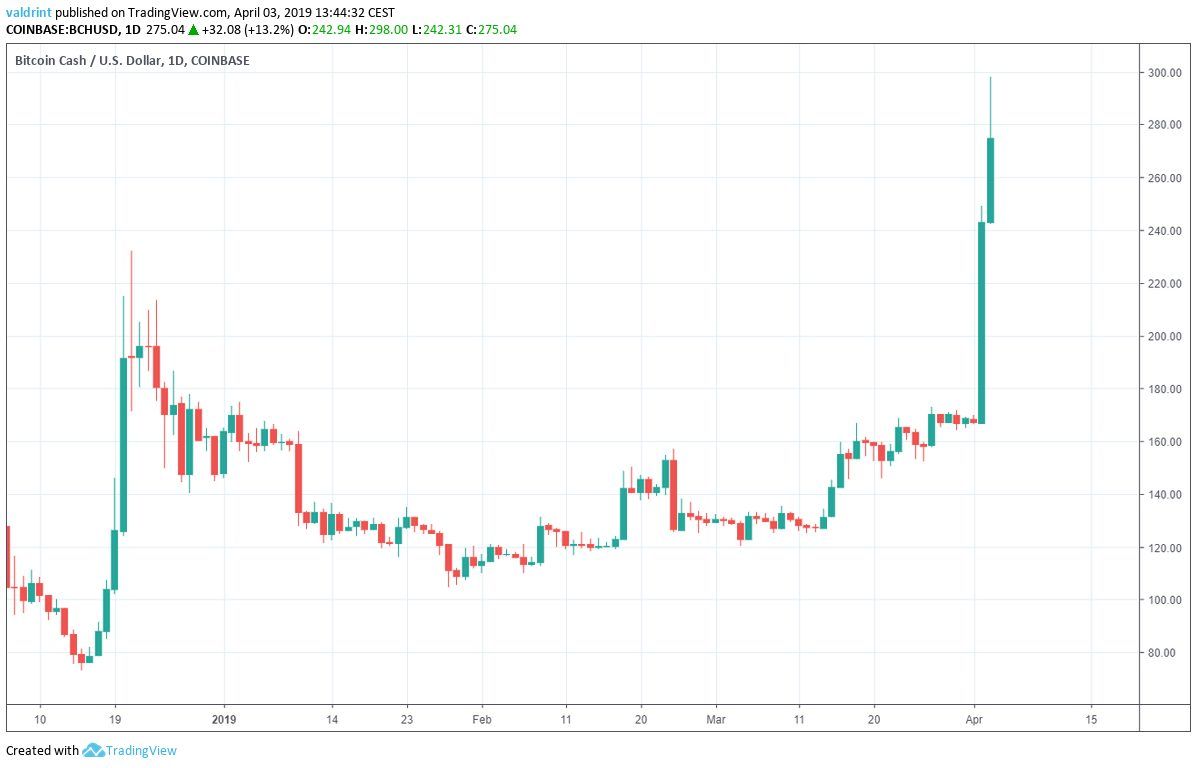
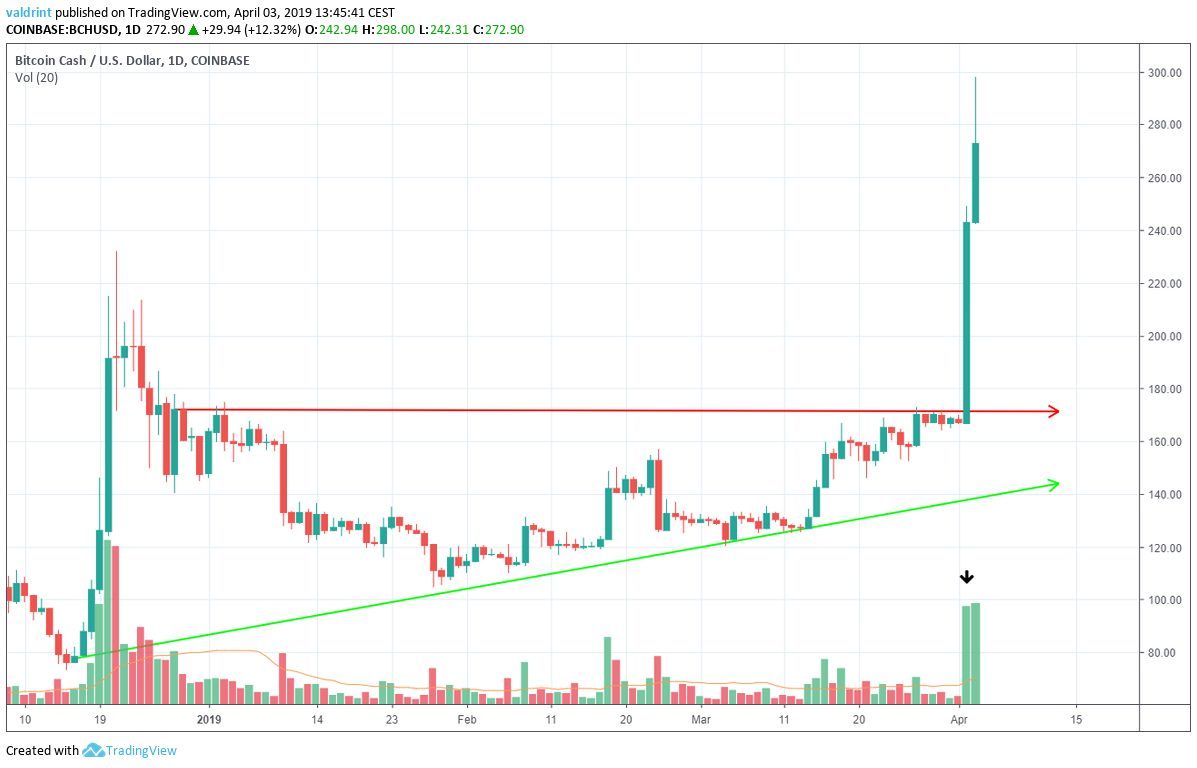
The price of BCH on Coinbase is analyzed at one-day intervals from Dec 10, 2018 to Apr 3, 2019.
On Dec 12, BCH made a low of $92.32. A sharp upward move was followed by a gradual increase. The price made several higher lows, each being higher than the previous one.
Tracing these lows gives us an ascending resistance line:
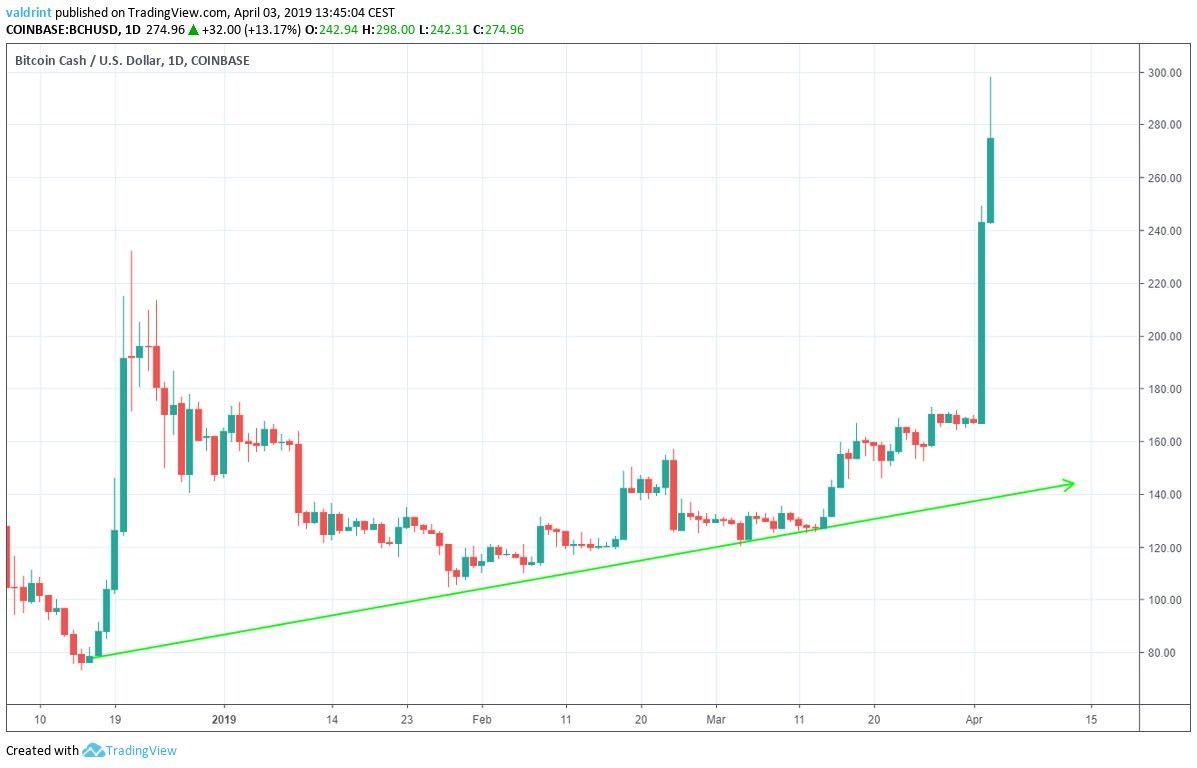
On Dec 28, 2018, the price reached a high of $167.85 A gradual decrease followed. The price reached the same level several times. Tracing these highs gives us a horizontal resistance line.
The support and resistance lines combine to create an ascending triangle:
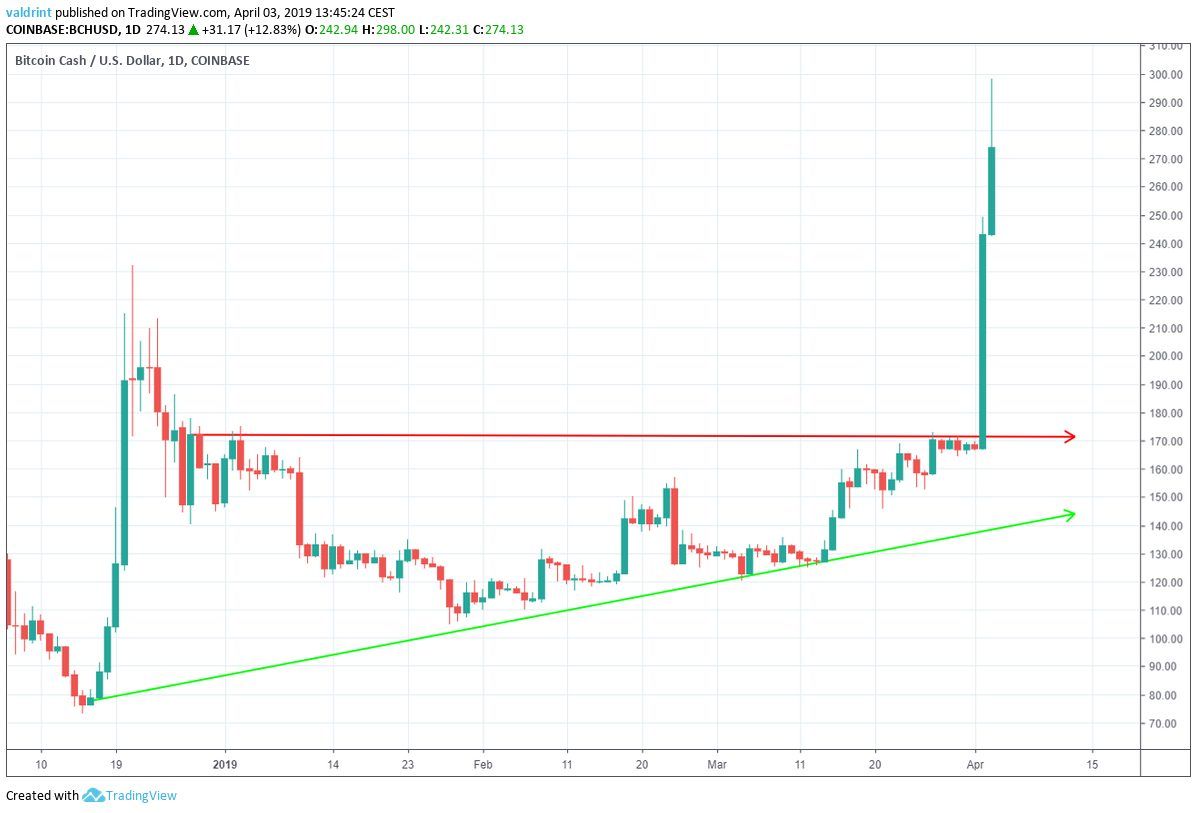
The breakout from the triangle occurred on Apr 2. If this was a valid breakout, we may expect continued price gains. However, a false breakdown may lead BCH back into the triangle.
Furthermore, even if the breakout was valid, slight price drops may precede greater increases. Such decreases would most likely not represent a full reversal, but rather a slight correction.
Moving Averages
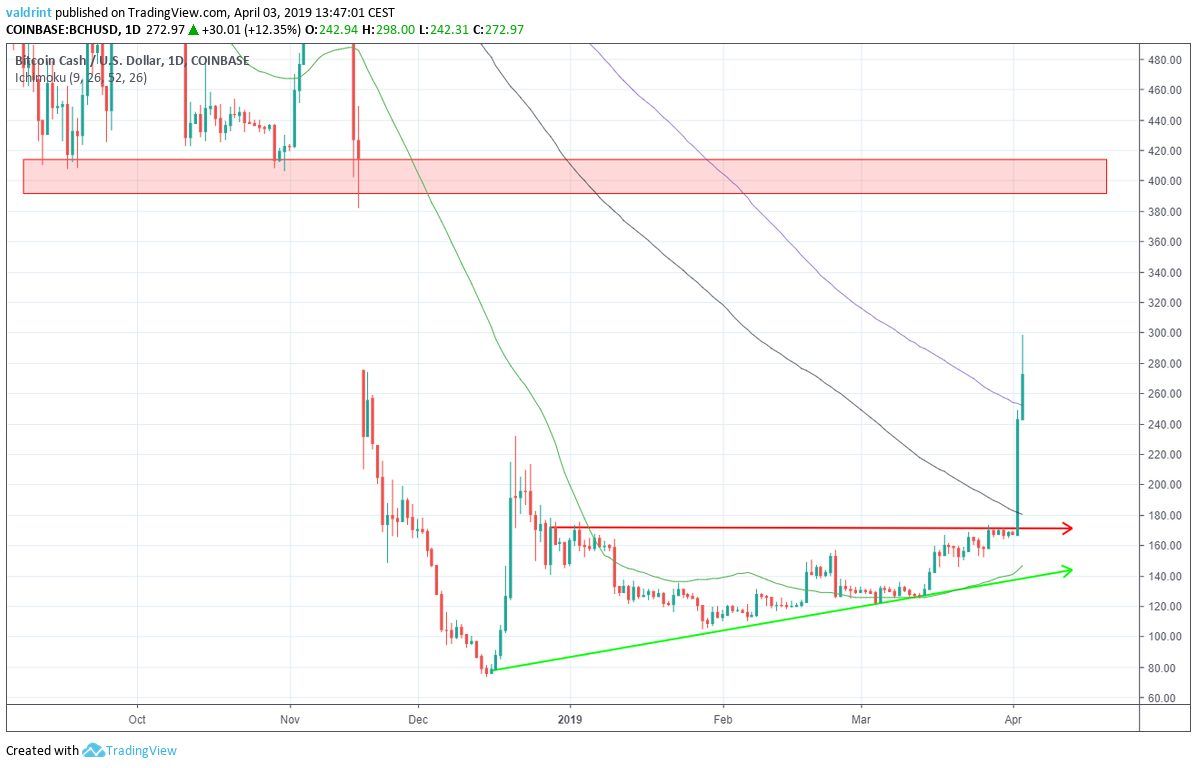
Therefore, BCH is trading above major long-term resistance and may have already begun a new uptrend. This will have to be assessed in future analyses.
The closest significant resistance area is found near $400, formed by the lows of Sep and Oct 2018.
Volume
On Apr 2, the daily candle for BCH opened at $167 and closed at $242, an increase of 42%.
This movement was done with substantial volume. It was the highest daily volume BCH has seen since Dec 28, 2018:
This suggests further that the breakout is genuine and higher prices are to be expected in the future.
April Price Prediction And Summary
The price had been trading inside the triangle for the past 106 days. Therefore, we would expect the movement succeeding the breakout to take around 74-128 days (±20%)
As seen from the graph, the green arrow is the height of the triangle. Copying the distance to the point of the breakout, we get a height of $260 for the possible top of the current upward move:

Judging by the length and height of the triangle, we believe it is likely that the price will trade between $240 and $300 throughout April.
How much do you think the price of BCH will keep increasing? Let us know your thoughts in the comments below!
LEARN ABOUT 0 COMMISION BTC INVESTING HERE!
Disclaimer: This article is not trading advice and should not be construed as such. Always consult a trained financial professional before investing in cryptocurrencies, as the market is particularly volatile.
