At BeInCrypto, we offer regular price analyses and predictions of the most popular and relevant cryptoassets. In our April 4 analysis of Bitcoin Cash (BCH), we predicted increases throughout the channel we have defined below. However, our prediction was invalidated later that day when a breakdown occurred.
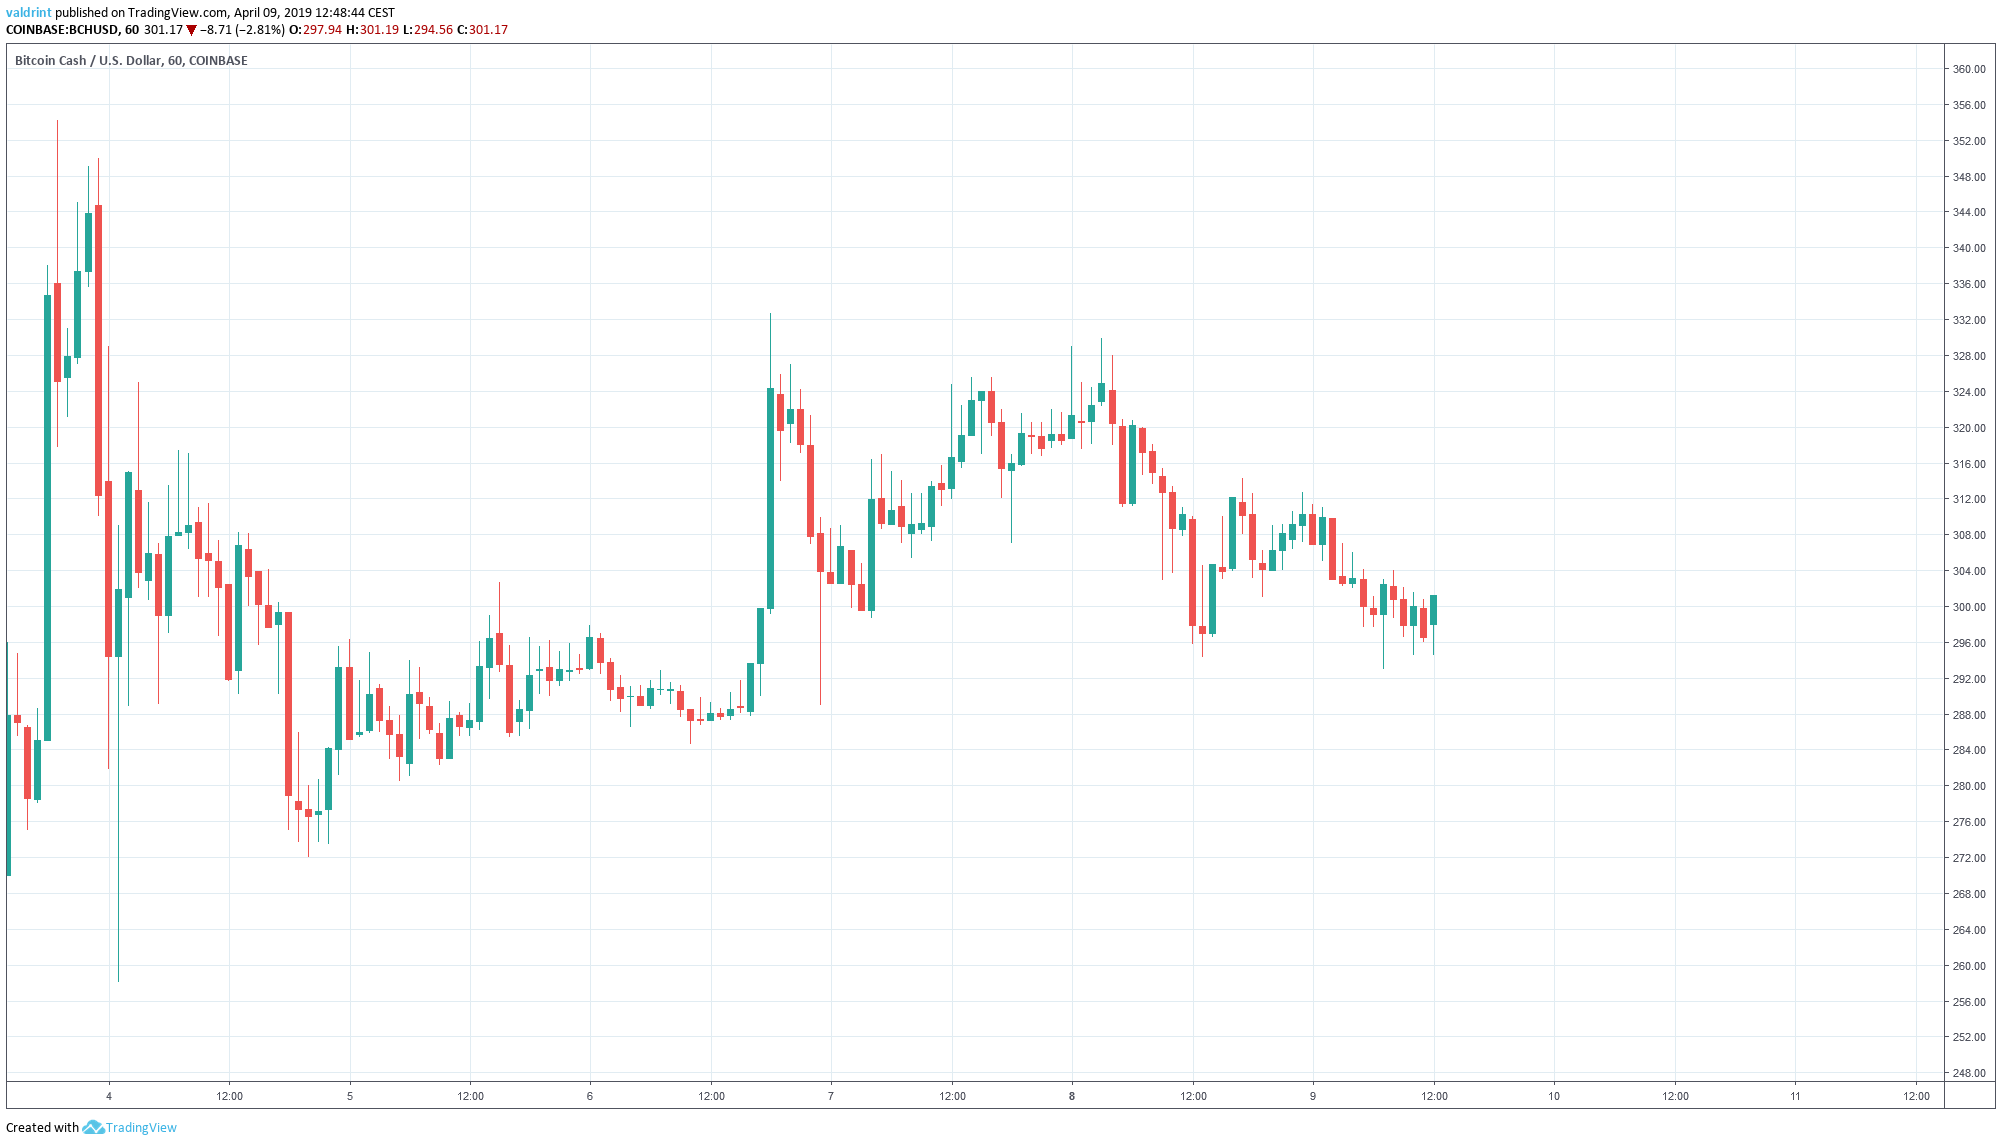
On Apr 3, 2019, Bitcoin Cash reached a high of $354. It has been on a downtrend since.
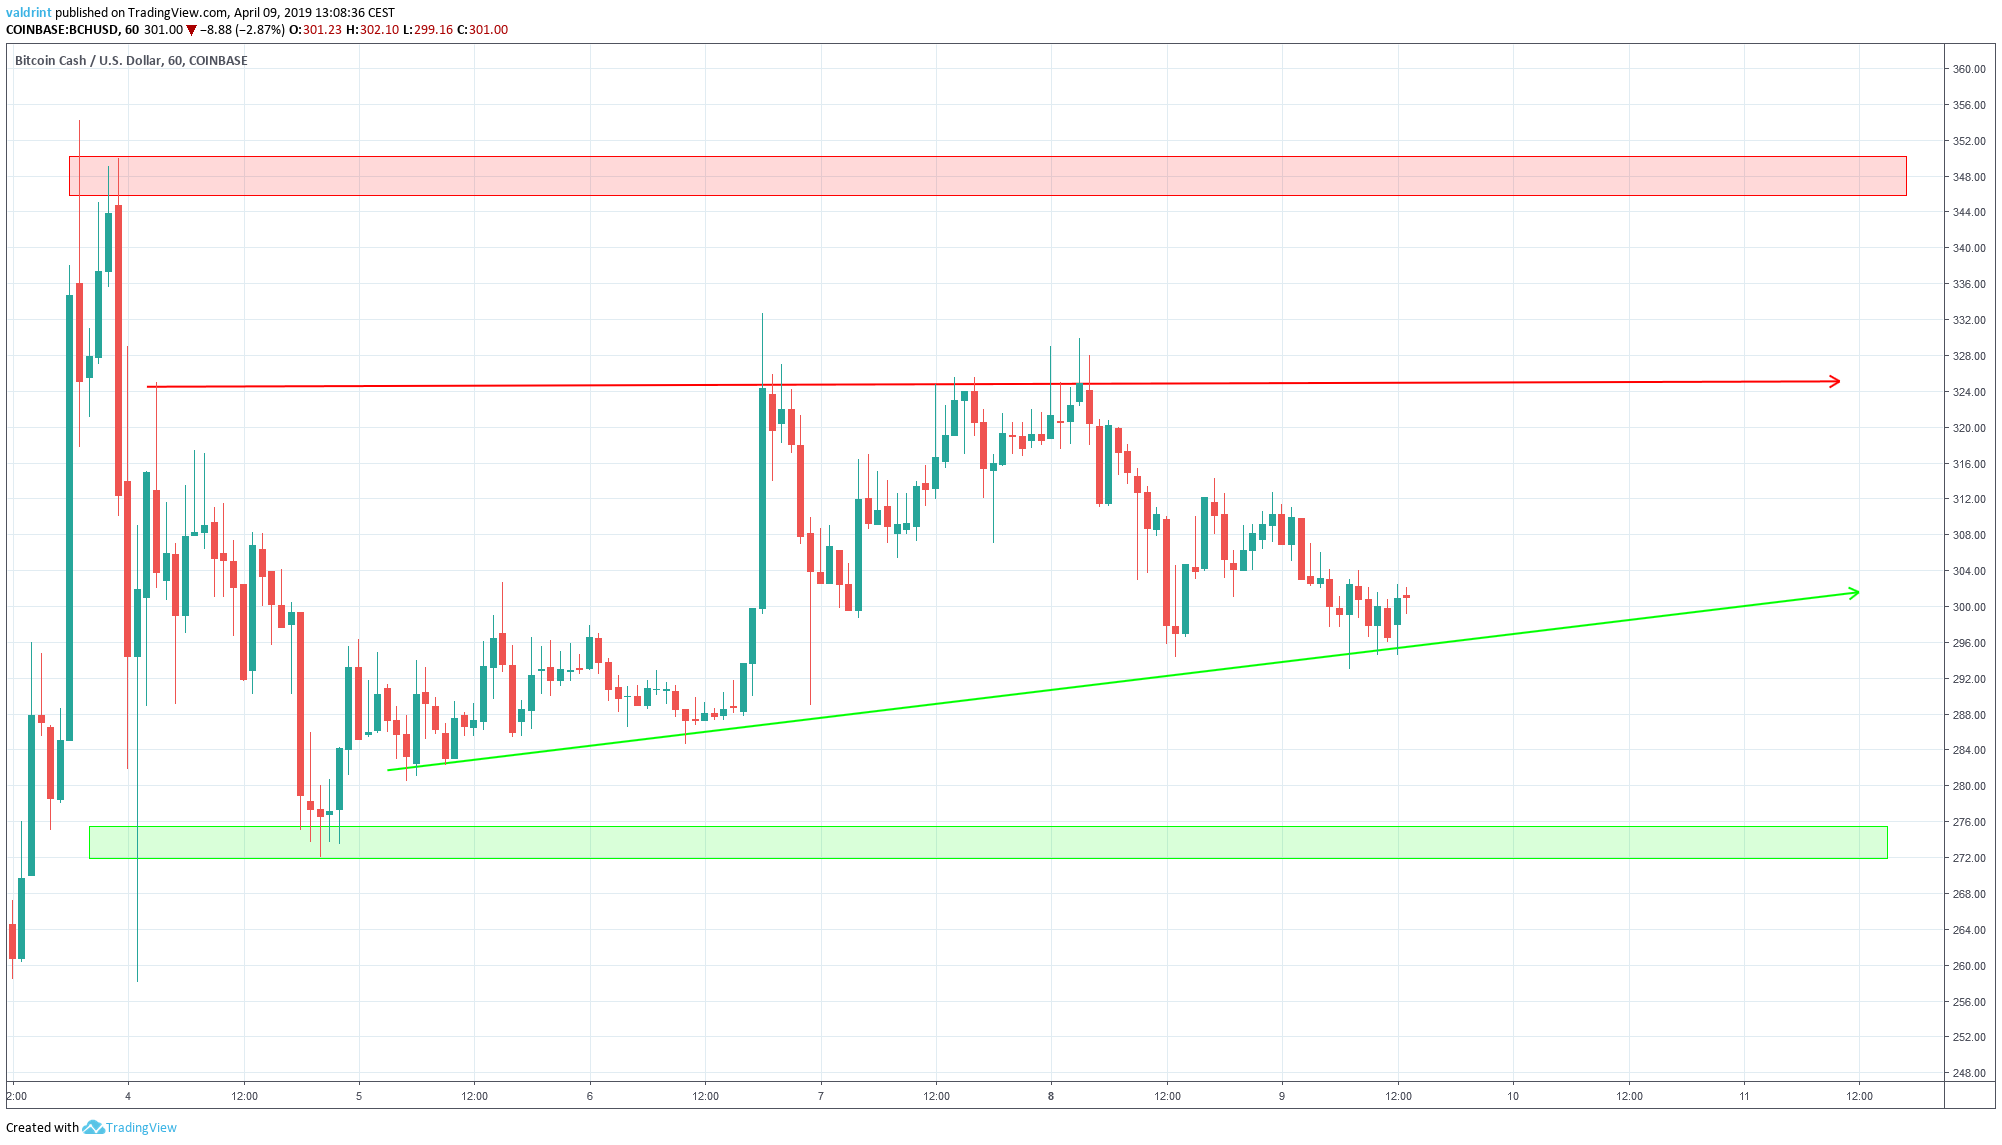
BCH Prices: Apr 3 – Apr 9
How long will this downtrend last? Let’s find out.
Bitcoin Cash (BCH): Trends and Highlights For April 9, 2019
The price of BCH/USD has been on a downtrend since Apr 3.
Bitcoin Cash is trading inside an ascending triangle.
There is bullish divergence developing in the RSI.
There is resistance near $350.
Ascending Triangle
The price of BCH on Coinbase is analyzed at one-hour intervals from Apr 1 to Apr 9. This is done in order to trace the current trading pattern.
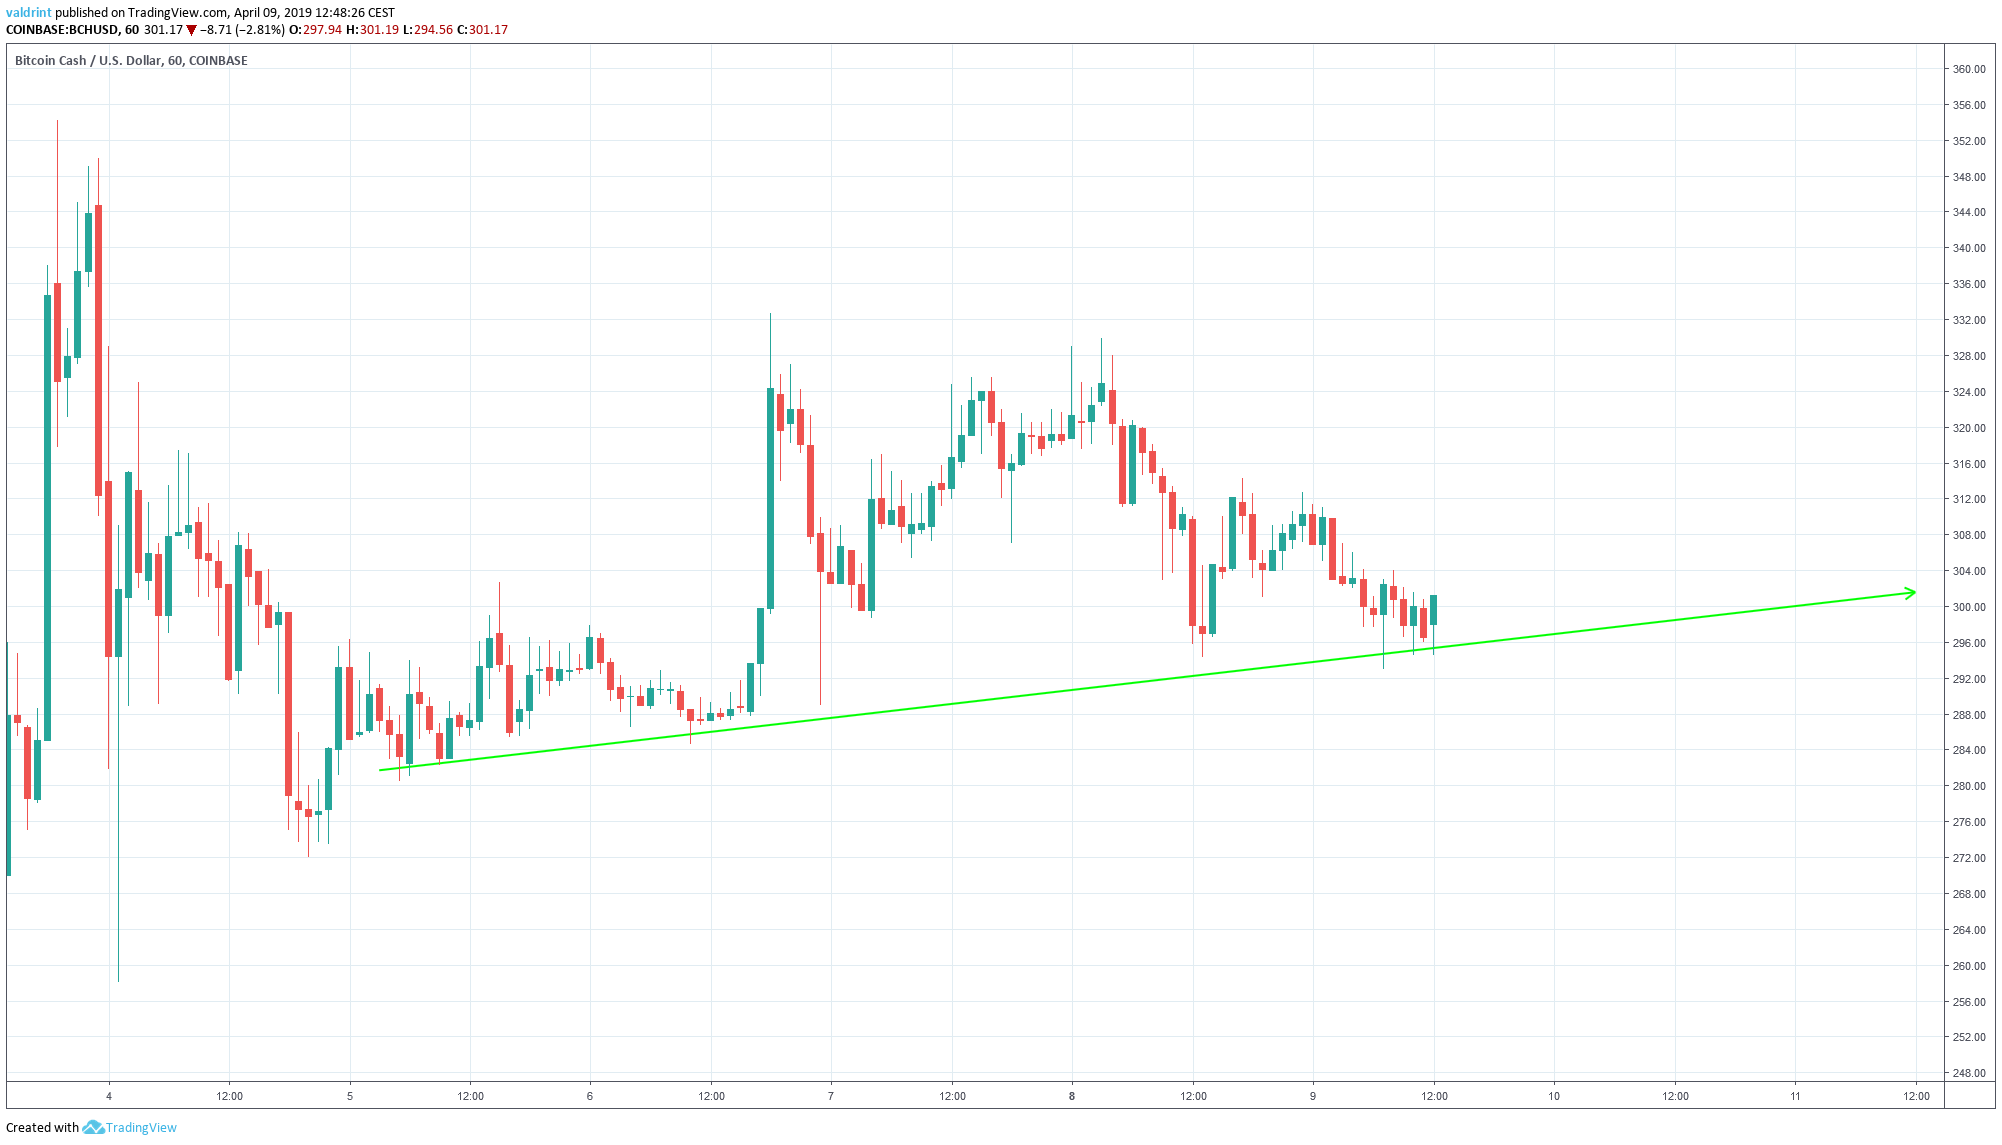
On Apr 5, the price reached an hourly low of $180.52. An upward move began. Several market cycles have been completed and the price has made several higher lows.
Tracing these lows gives us an ascending support line:
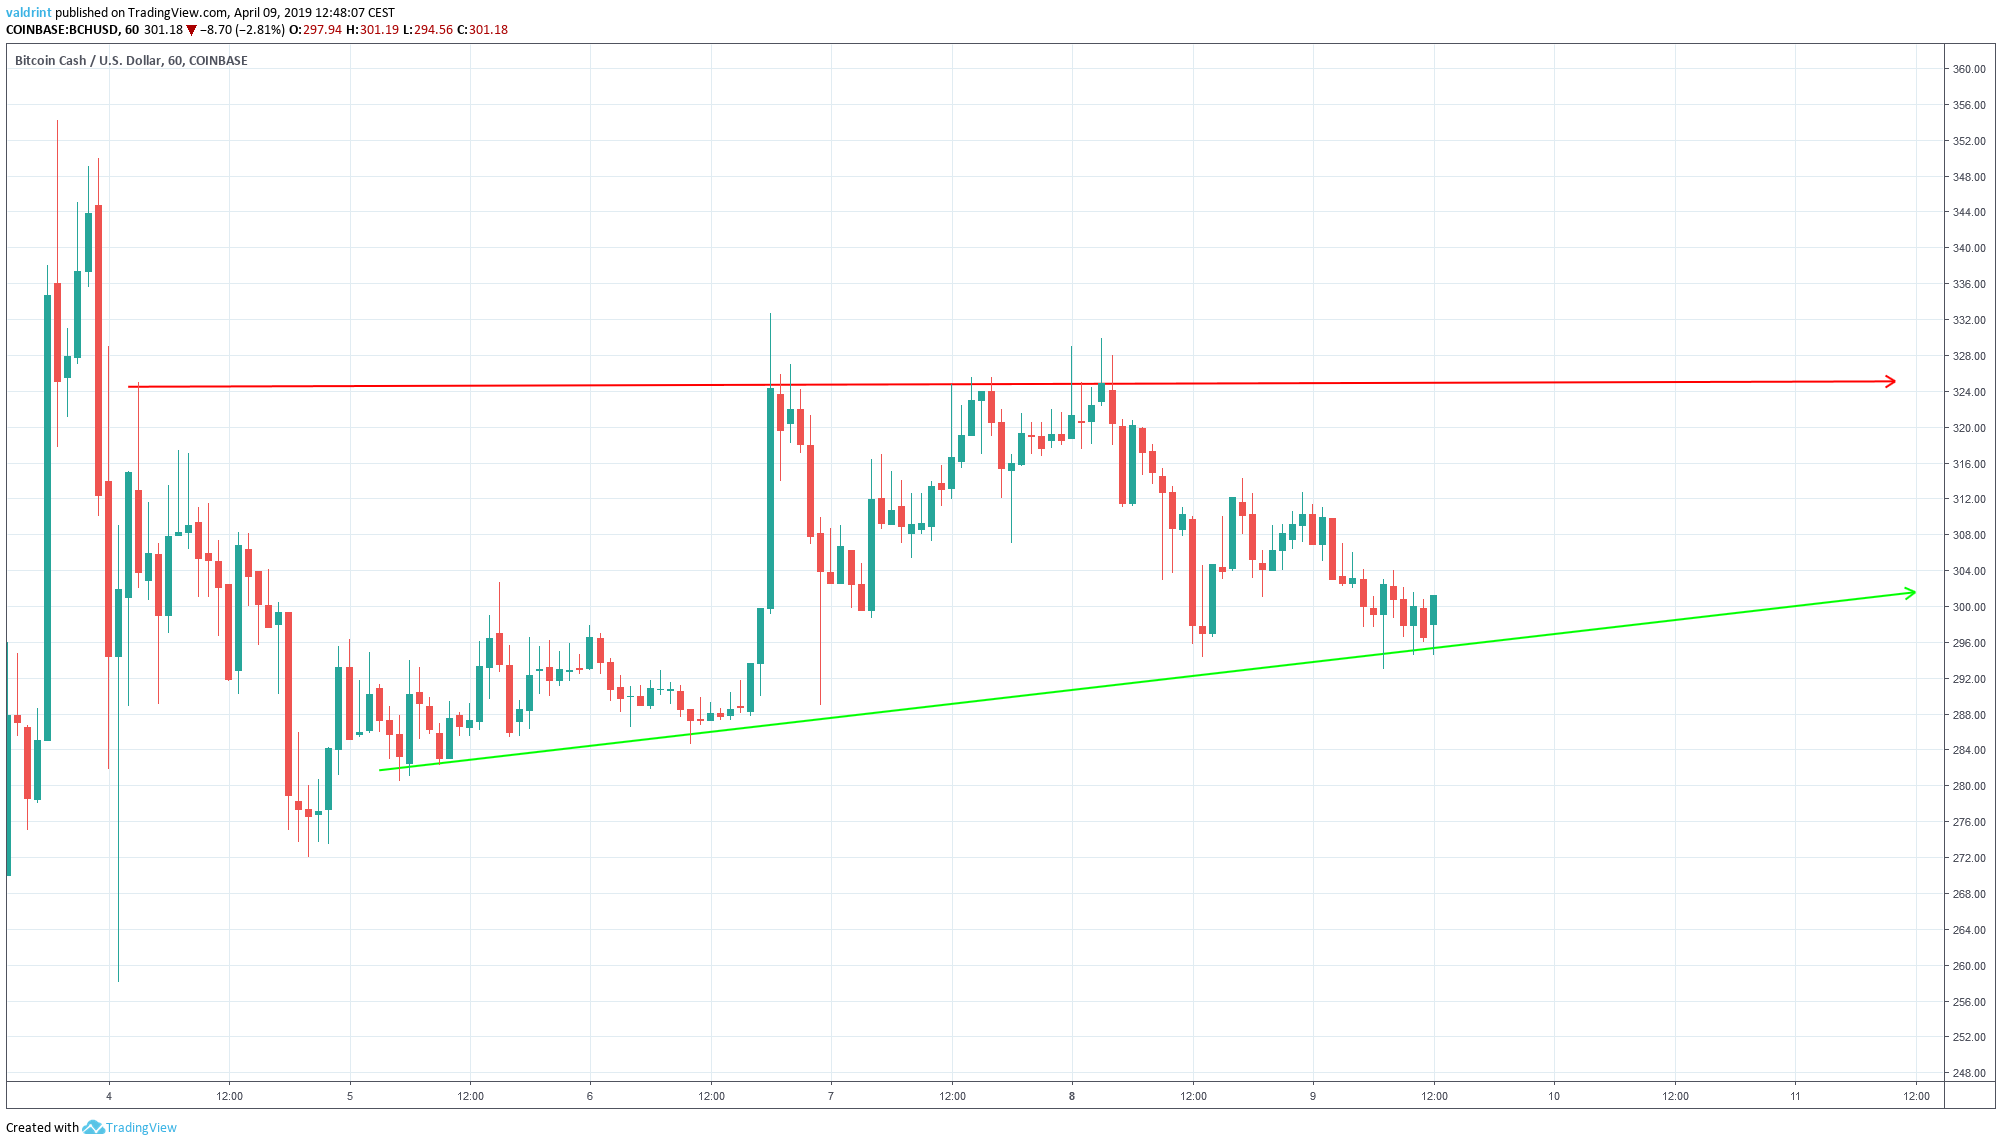
On Apr 4, the price reached an hourly high of $324.98. A gradual decrease was followed by a sharp increase. The price reached the same level four times.
Tracing these highs gives us a horizontal resistance line.
Together, the resistance and support lines combine to create an ascending triangle:
This is a bullish pattern. A breakout above resistance is more likely than a breakdown below support. However, the price is currently trading near the support line, so we do not expect a breakout in the immediate future.
Price is likely to increase toward the resistance, however. If a breakdown does occur, the current downward trend might be accelerated.
In order to figure out the direction of this move, we need to take a look at some technical indicators.
Technical Indicators
We begin with RSI.
The relative strength index (RSI) is an indicator which calculates the size of the changes in price in order to determine oversold or overbought conditions in the market.
Combining RSI bullish/bearish divergence with support/resistance essentially predicts price fluctuations.
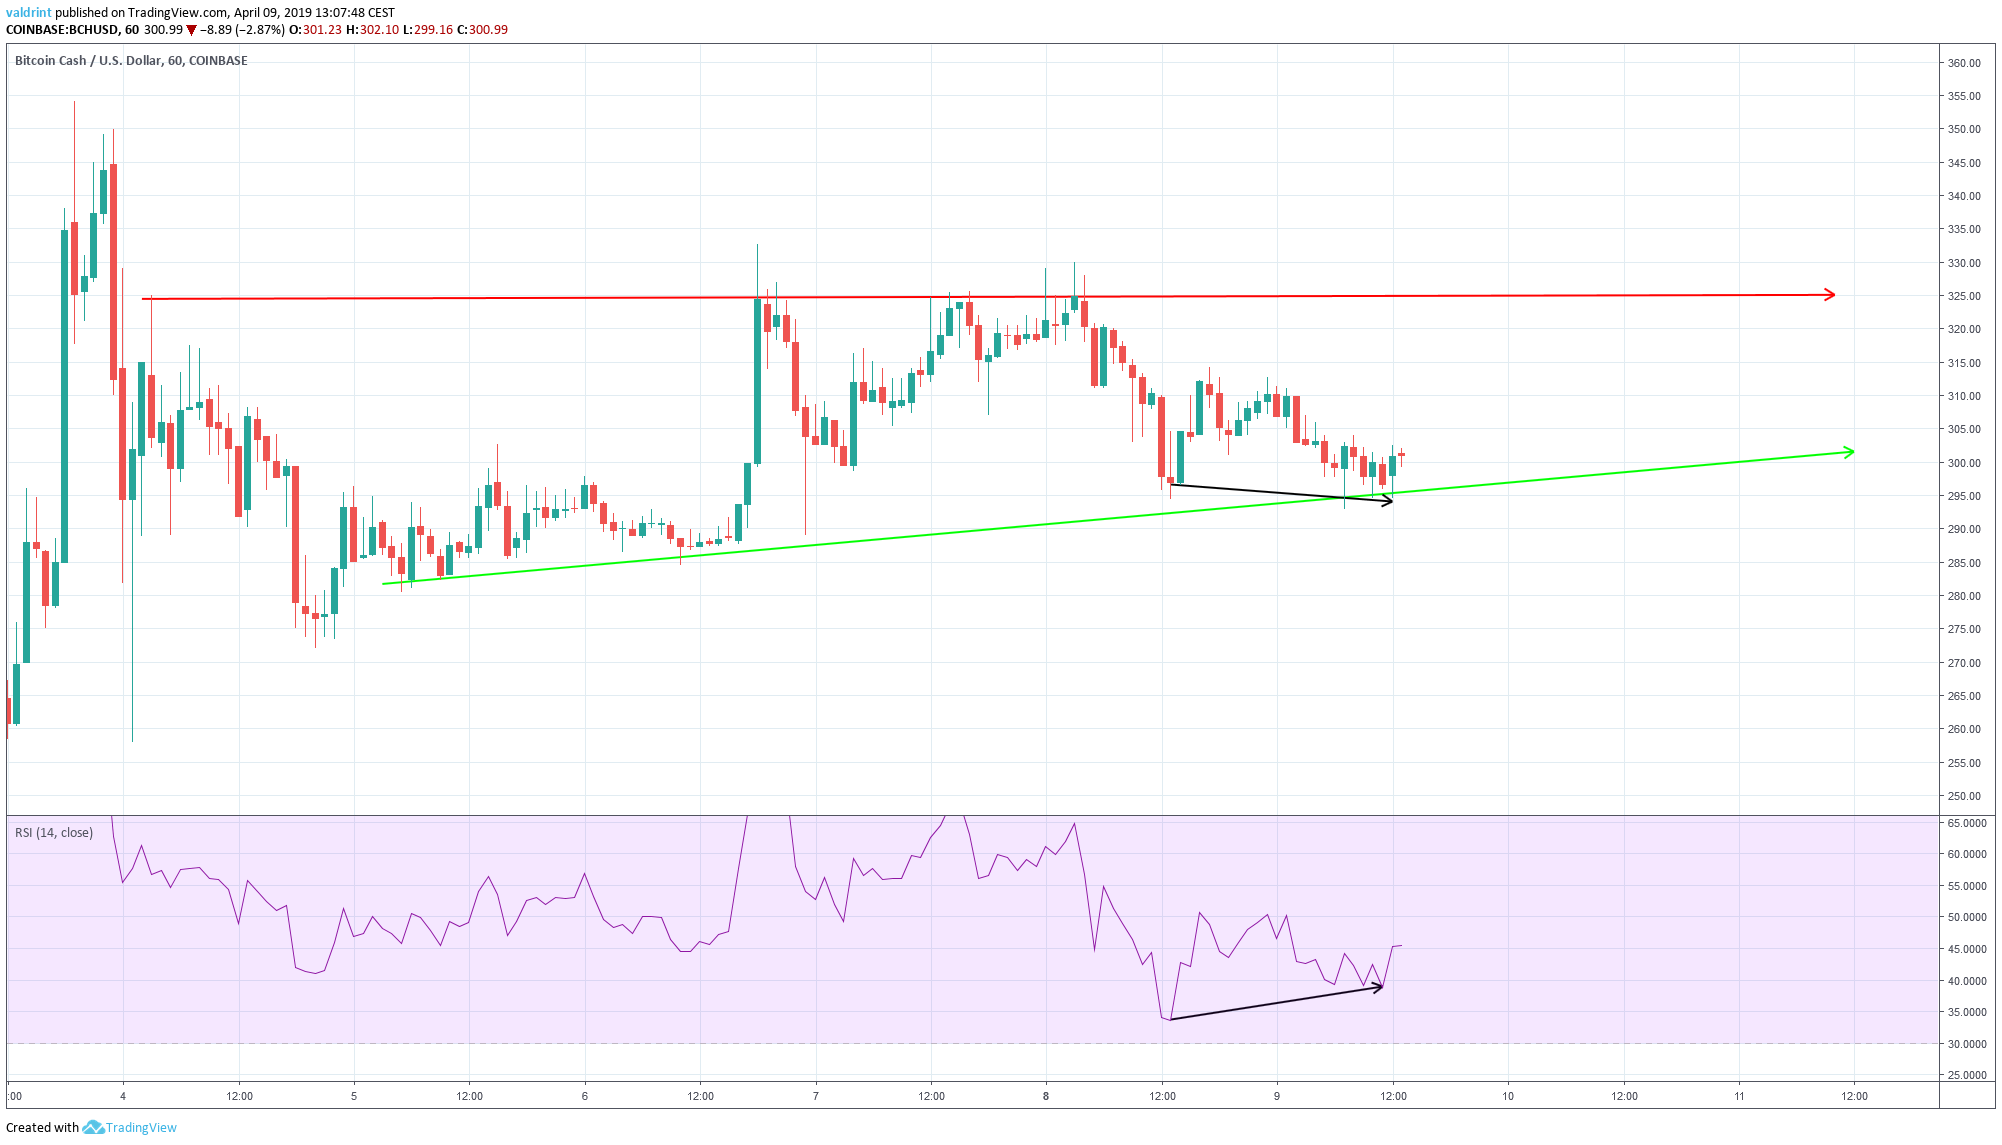
On Apr 8, the price made a low of $294.34. It made a lower low of $292.95 on Apr 9.
Similarly, the RSI made the first low on Apr 8. However, it has proceeded to generate higher values.
This is known as bullish divergence and often precedes price increases. It gains more validity since it is occurring in a bullish pattern.
Using this indicator, it is likely that the price will move towards the resistance line of the triangle and possibly break out.
Future Movement
Support and resistance areas are created when the price revisits the same level several times. They can provide reversal areas in case a breakout/breakdown occurs.
The closest resistance area is found near $350. If the price were to break out from the triangle, it would provide a likely reversal area. According to our analysis, we believe this to be likely.Do you think Bitcoin Cash will break out from the triangle? Let us know your thoughts in the comments below.
Disclaimer: This article is not trading advice and should not be construed as such. Always consult a trained financial professional before investing in cryptocurrencies, as the market is particularly volatile.
Best crypto platforms in Europe | January 2025
Don’t invest unless you’re prepared to lose all the money you invest.
This is a high-risk investment and you should not expect to be protected if something goes wrong.
In line with the Trust Project guidelines, this price analysis article is for informational purposes only and should not be considered financial or investment advice. BeInCrypto is committed to accurate, unbiased reporting, but market conditions are subject to change without notice. Always conduct your own research and consult with a professional before making any financial decisions. Please note that our Terms and Conditions, Privacy Policy, and Disclaimers have been updated.
Valdrin discovered cryptocurrencies while he was getting his MSc in Financial Markets from the Barcelona School of Economics. Shortly after graduating, he began writing for several different cryptocurrency related websites as a freelancer before eventually taking on the role of BeInCrypto's Senior Analyst.
(I do not have a discord and will not contact you first there. Beware of scammers)


 On Apr 4, the price reached an hourly high of $324.98. A gradual decrease was followed by a sharp increase. The price reached the same level four times.
Tracing these highs gives us a horizontal resistance line.
Together, the resistance and support lines combine to create an ascending triangle:
On Apr 4, the price reached an hourly high of $324.98. A gradual decrease was followed by a sharp increase. The price reached the same level four times.
Tracing these highs gives us a horizontal resistance line.
Together, the resistance and support lines combine to create an ascending triangle:
 This is a bullish pattern. A breakout above resistance is more likely than a breakdown below support. However, the price is currently trading near the support line, so we do not expect a breakout in the immediate future.
Price is likely to increase toward the resistance, however. If a breakdown does occur, the current downward trend might be accelerated.
In order to figure out the direction of this move, we need to take a look at some technical indicators.
This is a bullish pattern. A breakout above resistance is more likely than a breakdown below support. However, the price is currently trading near the support line, so we do not expect a breakout in the immediate future.
Price is likely to increase toward the resistance, however. If a breakdown does occur, the current downward trend might be accelerated.
In order to figure out the direction of this move, we need to take a look at some technical indicators.
 On Apr 8, the price made a low of $294.34. It made a lower low of $292.95 on Apr 9.
Similarly, the RSI made the first low on Apr 8. However, it has proceeded to generate higher values.
This is known as bullish divergence and often precedes price increases. It gains more validity since it is occurring in a bullish pattern.
Using this indicator, it is likely that the price will move towards the resistance line of the triangle and possibly break out.
On Apr 8, the price made a low of $294.34. It made a lower low of $292.95 on Apr 9.
Similarly, the RSI made the first low on Apr 8. However, it has proceeded to generate higher values.
This is known as bullish divergence and often precedes price increases. It gains more validity since it is occurring in a bullish pattern.
Using this indicator, it is likely that the price will move towards the resistance line of the triangle and possibly break out.
 The closest resistance area is found near $350. If the price were to break out from the triangle, it would provide a likely reversal area. According to our analysis, we believe this to be likely.
Do you think Bitcoin Cash will break out from the triangle? Let us know your thoughts in the comments below.
The closest resistance area is found near $350. If the price were to break out from the triangle, it would provide a likely reversal area. According to our analysis, we believe this to be likely.
Do you think Bitcoin Cash will break out from the triangle? Let us know your thoughts in the comments below.

