
BeIn Crypto takes a look at the price movement for seven altcoins, including Ethereum (ETH) and Bitcoin (BTC). While their movement is similar, ETH seems to be leading BTC.
BTC
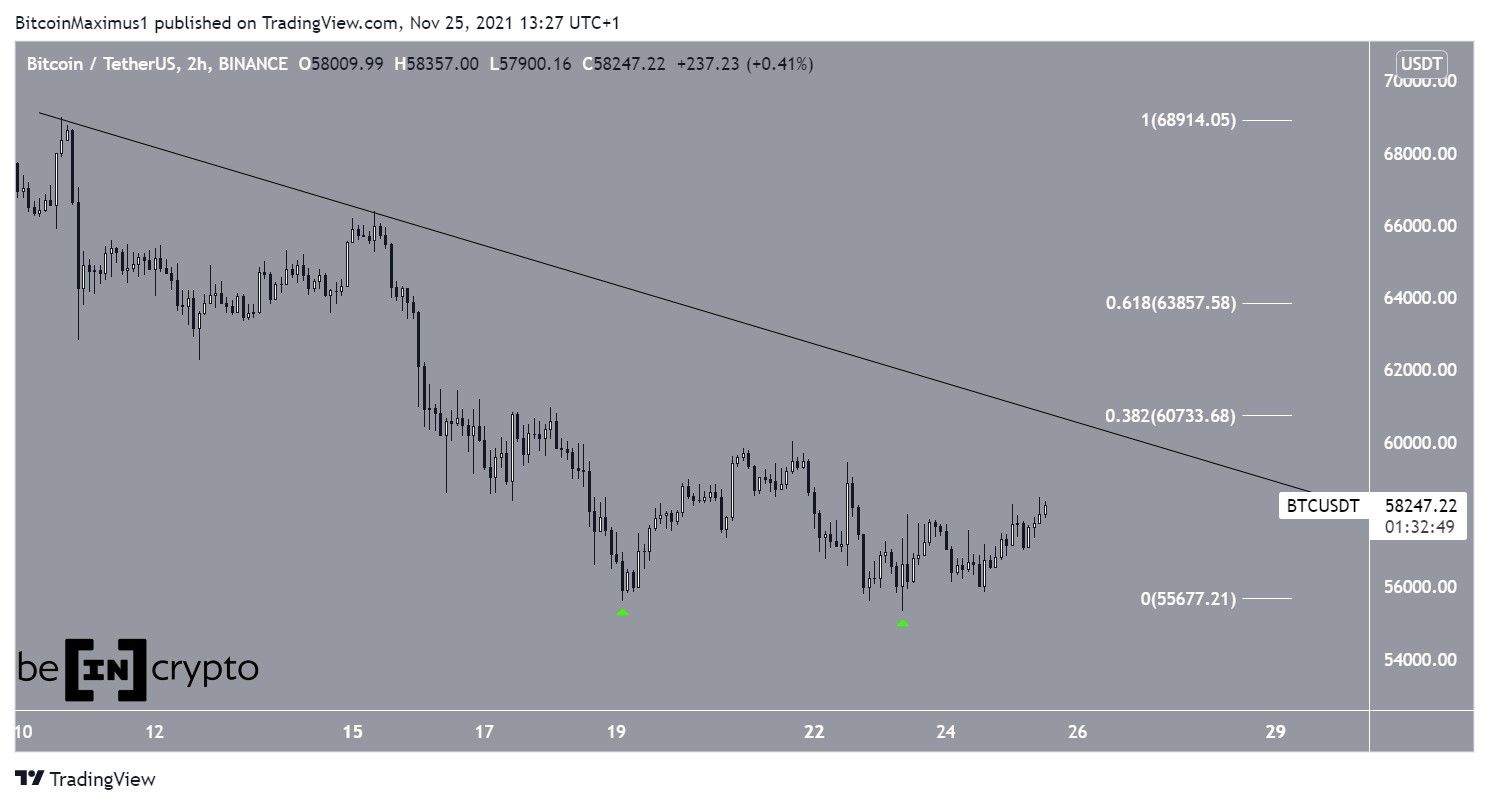
In the period between Nov 19 and 23, BTC created a double bottom. This is a bullish pattern that often leads to trend reversals.
If an upward movement follows, the closest resistance area would be at $60,700. This is the 0.382 Fib retracement resistance level and a horizontal resistance area. In addition to this, it coincides with a descending resistance line in place since the all-time high.
ETH
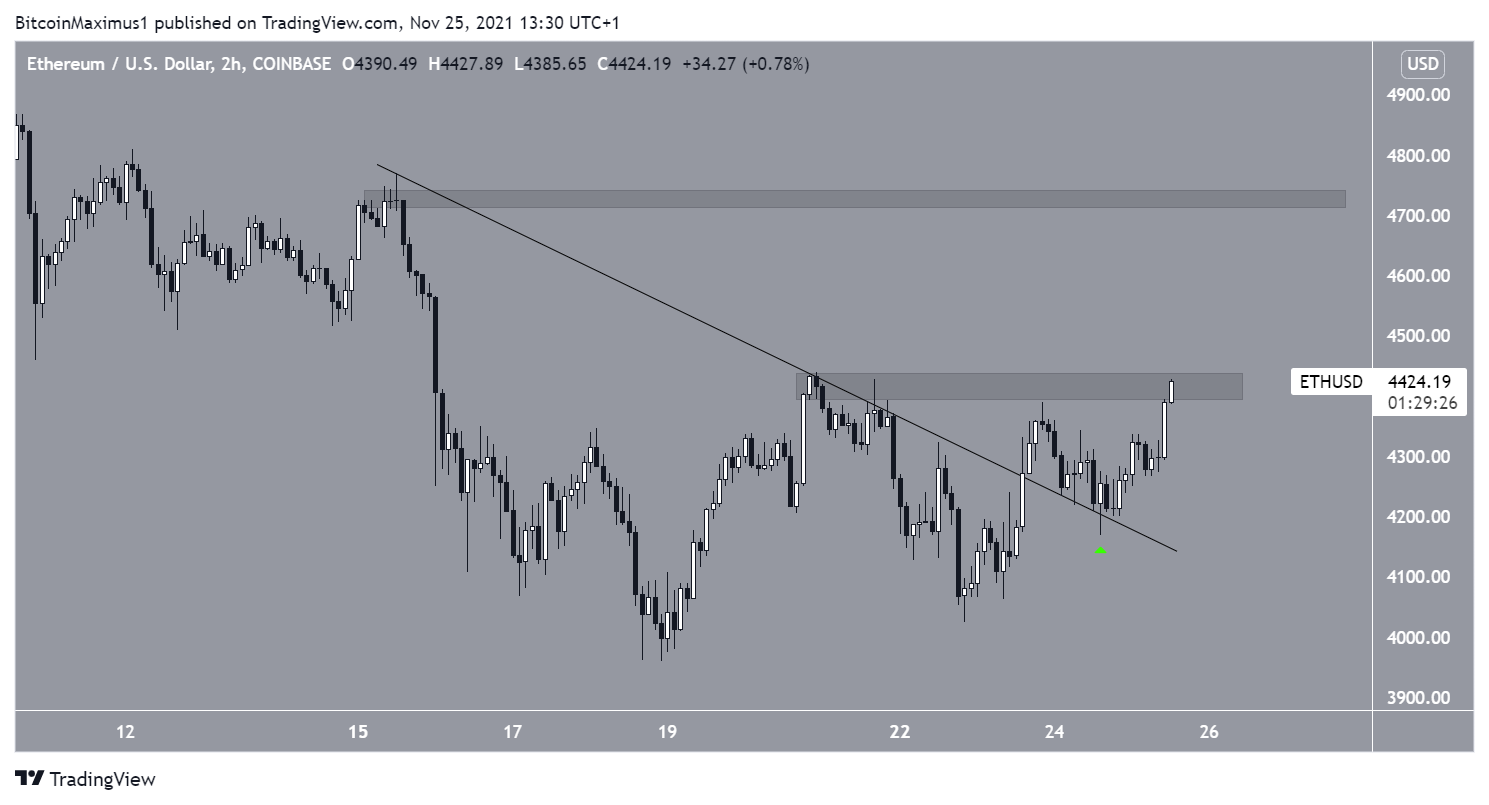
Similarly to BTC, ETH had been decreasing alongside a descending resistance line since Nov 15.
However, ETH broke out from the line on Nov 23 and validated it as support (green icon) the next day. It is currently attempting to break out from the $4,430 resistance area.
If it is successful in doing so, the next resistance would be at $4,700.
XRP
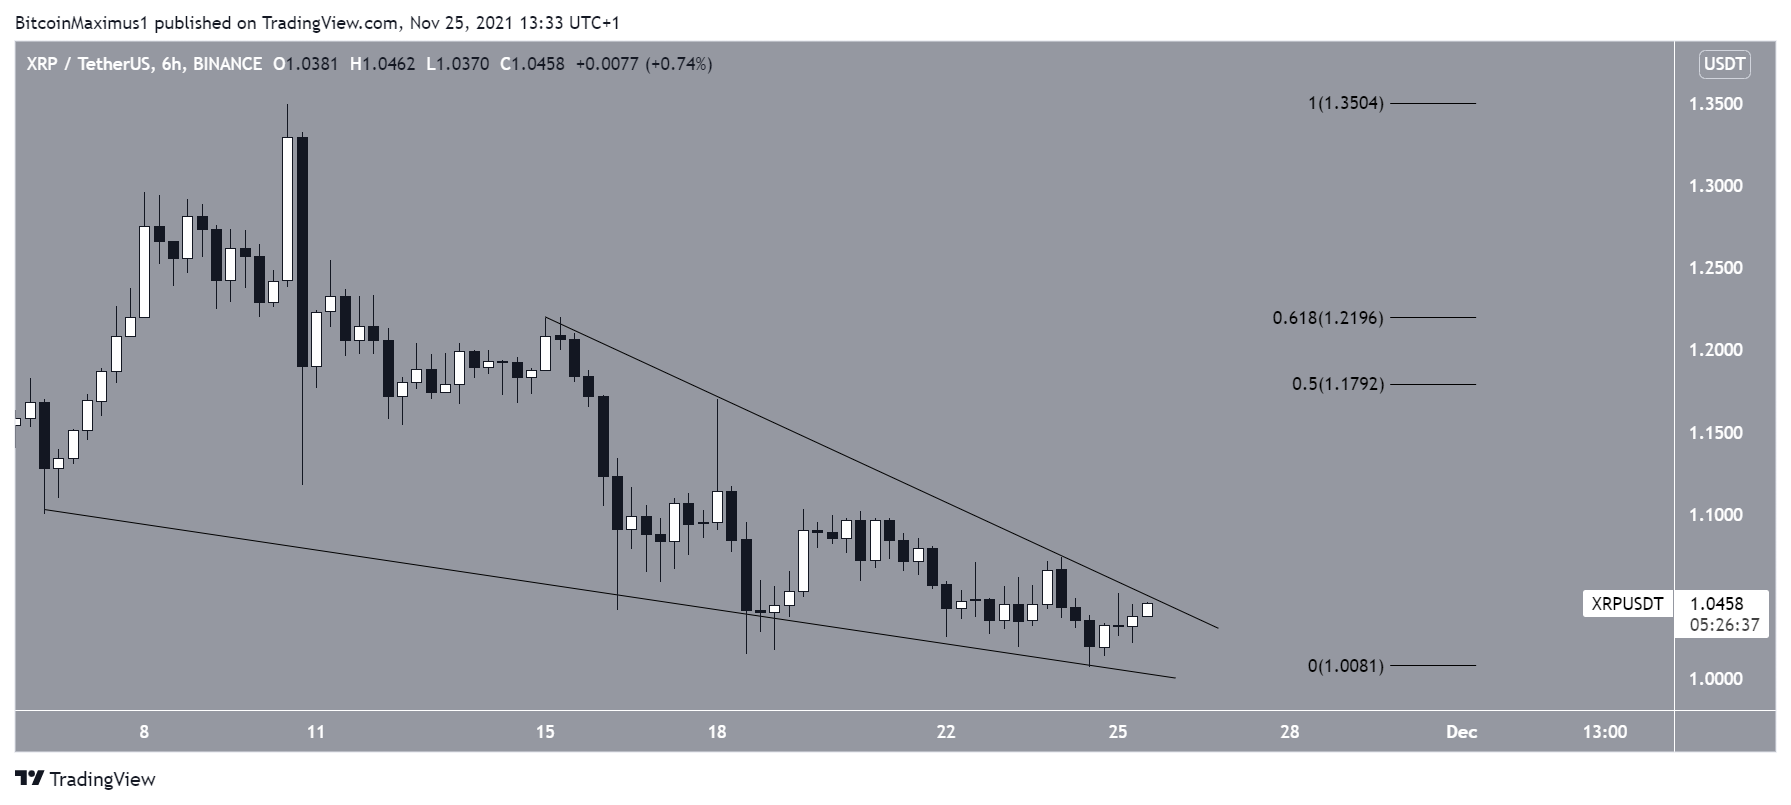
XRP has been decreasing alongside a descending wedge since Nov 14. The wedge is considered a bullish pattern, meaning that a breakout would be likely in the majority of cases.
At the time of writing, XRP was trading right at the resistance line of the pattern.
If a breakout occurs, the closest resistance area would be between $1.18 and $1.22. This is the 0.5-0.618 Fib retracement resistance area.
BAT
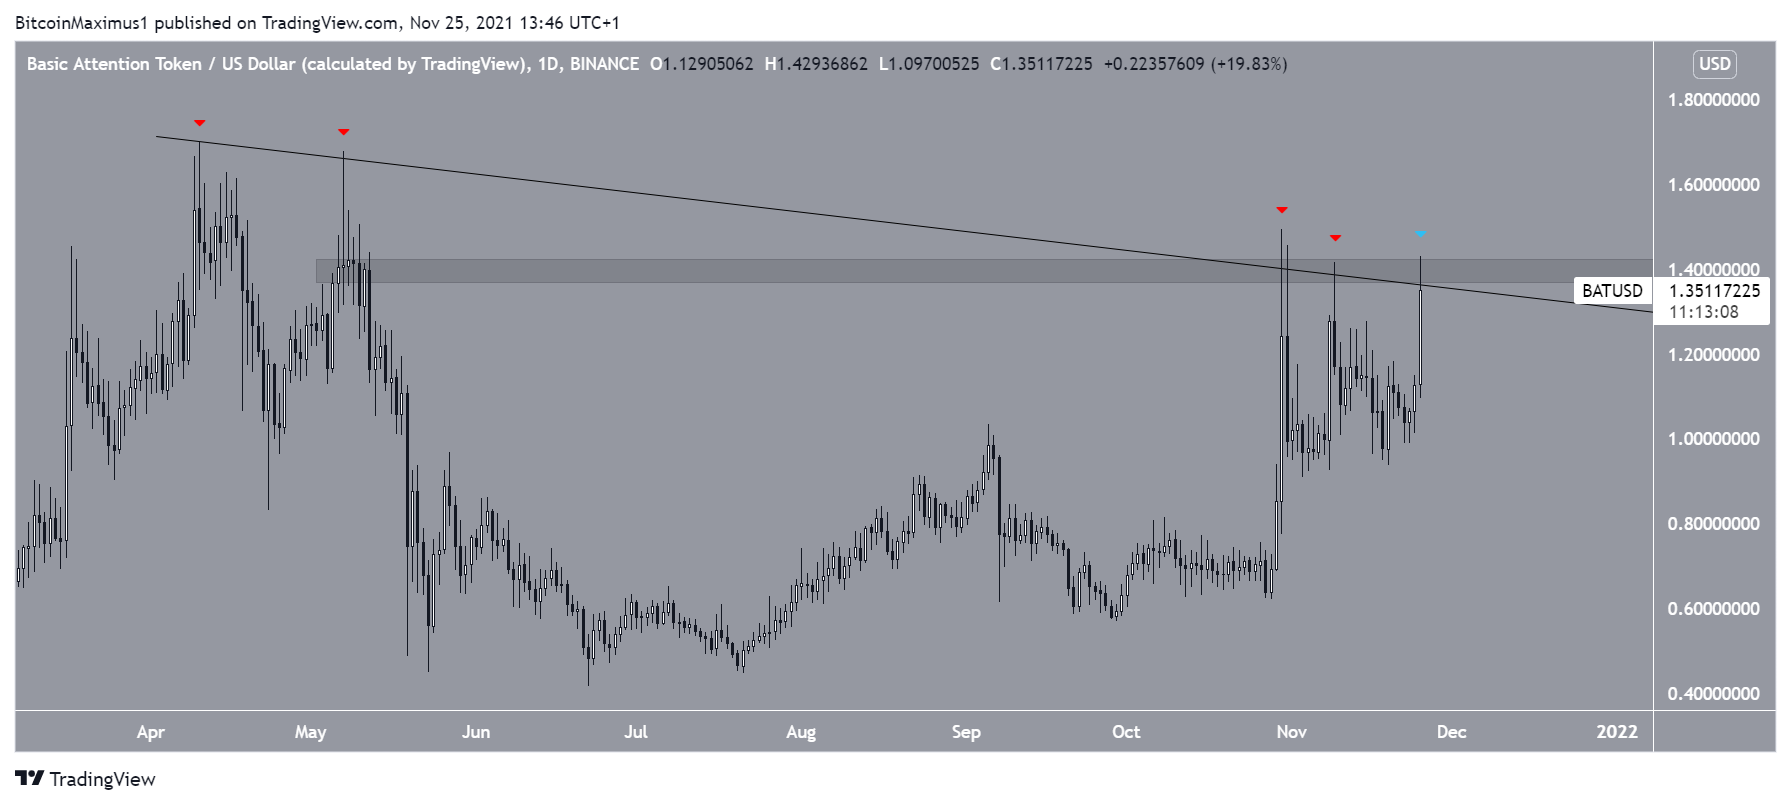
BAT has been decreasing alongside a descending resistance line since April 10, when it had reached an all-time high price of $1.69. So far, it has been rejected by the line four times (red icon).
Currently, it is in the process of making another breakout attempt (blue icon).
Since the line also coincides with the $1.40 resistance area, a breakout above it could trigger an acceleration of the upward movement.
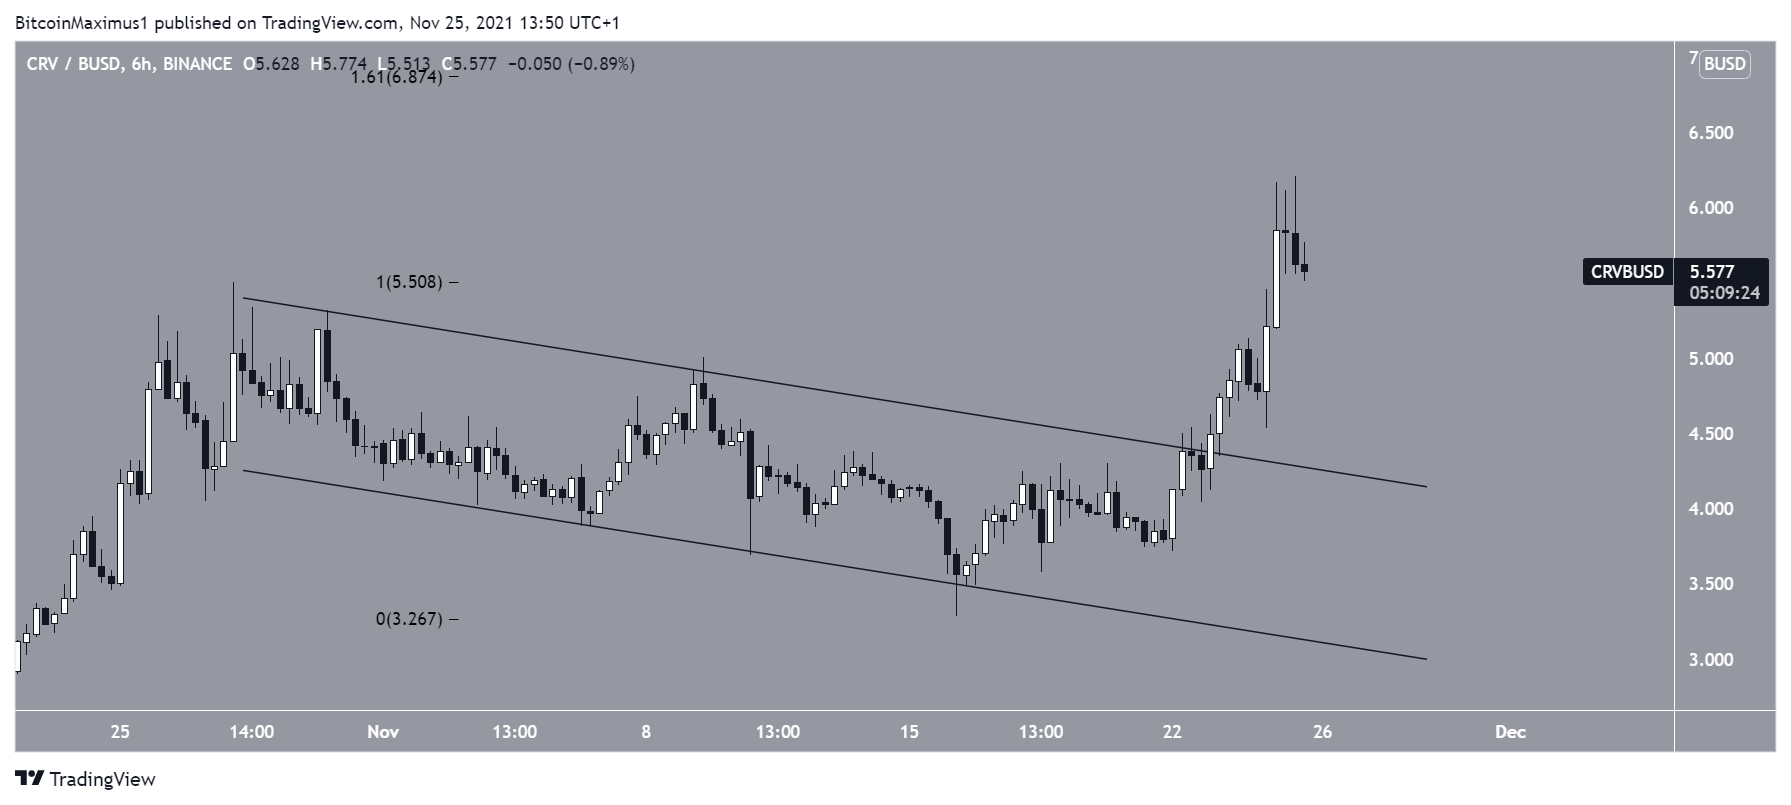
CRV
CRV had been trading inside a descending channel since Oct 25. On Nov 23, it broke out from the channel, confirming that the previous correction had come to an end. So far, it has reached a high of $6.21, doing so on Nov 25.
The next closest resistance is at $6.80, created by the 1.61 external Fib retracement when measuring the most recent drop.
It is possible that afterwards CRV could increase all the way to $8.3.
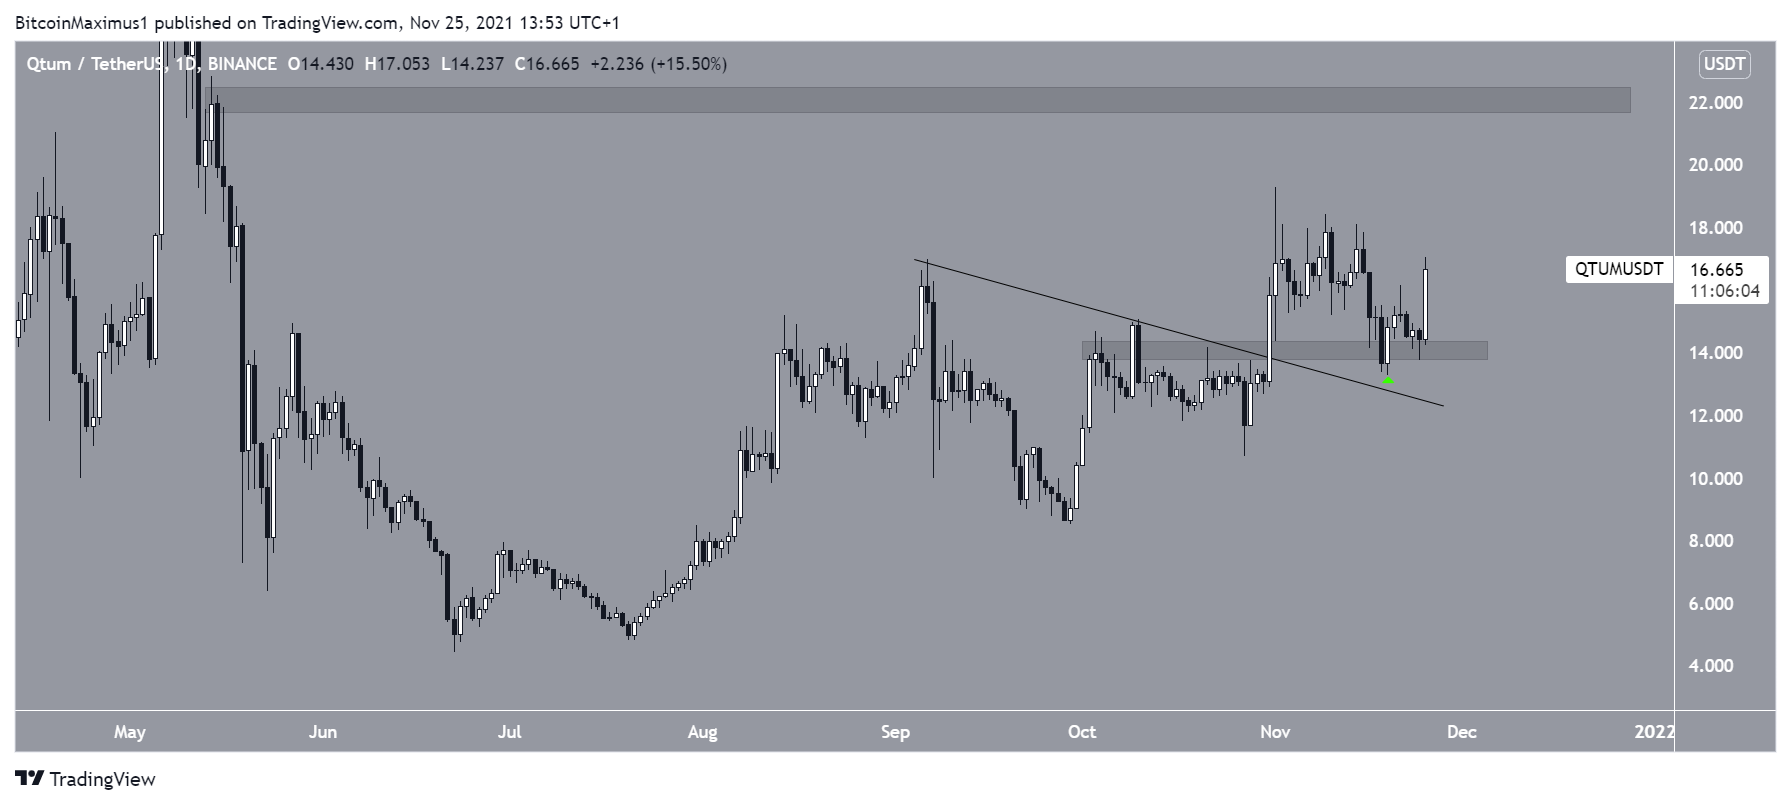
QTUM
On Oct 30, QTUM broke out from a descending resistance line. It proceeded to reach a high of $19.30 the next day.
The ensuing drop validated the $14 horizontal area as support (green icon).
If the upward movement continues, the next resistance area would be at $22.
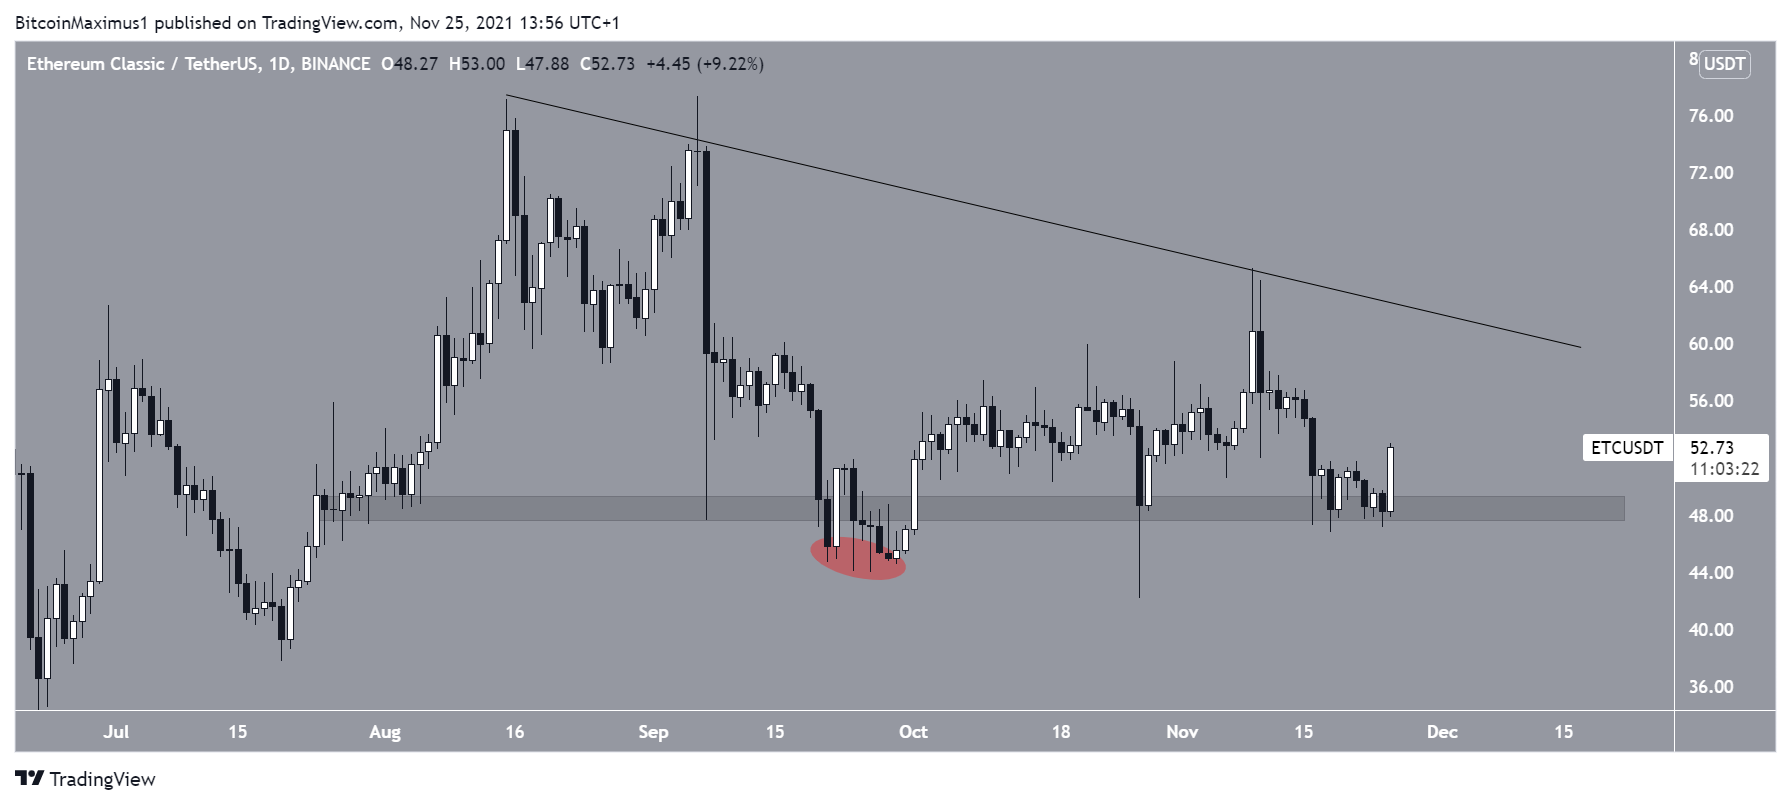
ETC
ETC has been decreasing alongside a descending resistance line since Aug 15. More recently, it was rejected by the line on Nov 9.
However, the descent came to an end once ETC bounced at the $48.50 horizontal support area. While ETC had initially broken down from this area in the middle of Sept (red circle), the bounce confirmed the area as support once more. This renders the previous breakout as only a deviation. Such occurrences are often followed by a significant movement in the other direction.
The resistance line is currently near $60.
For BeInCrypto’s previous Bitcoin (BTC) analysis, click here.
