


Curve DAO Token (CRV) has reclaimed a long-term support area and is showing bullish signs in lower time-frames.
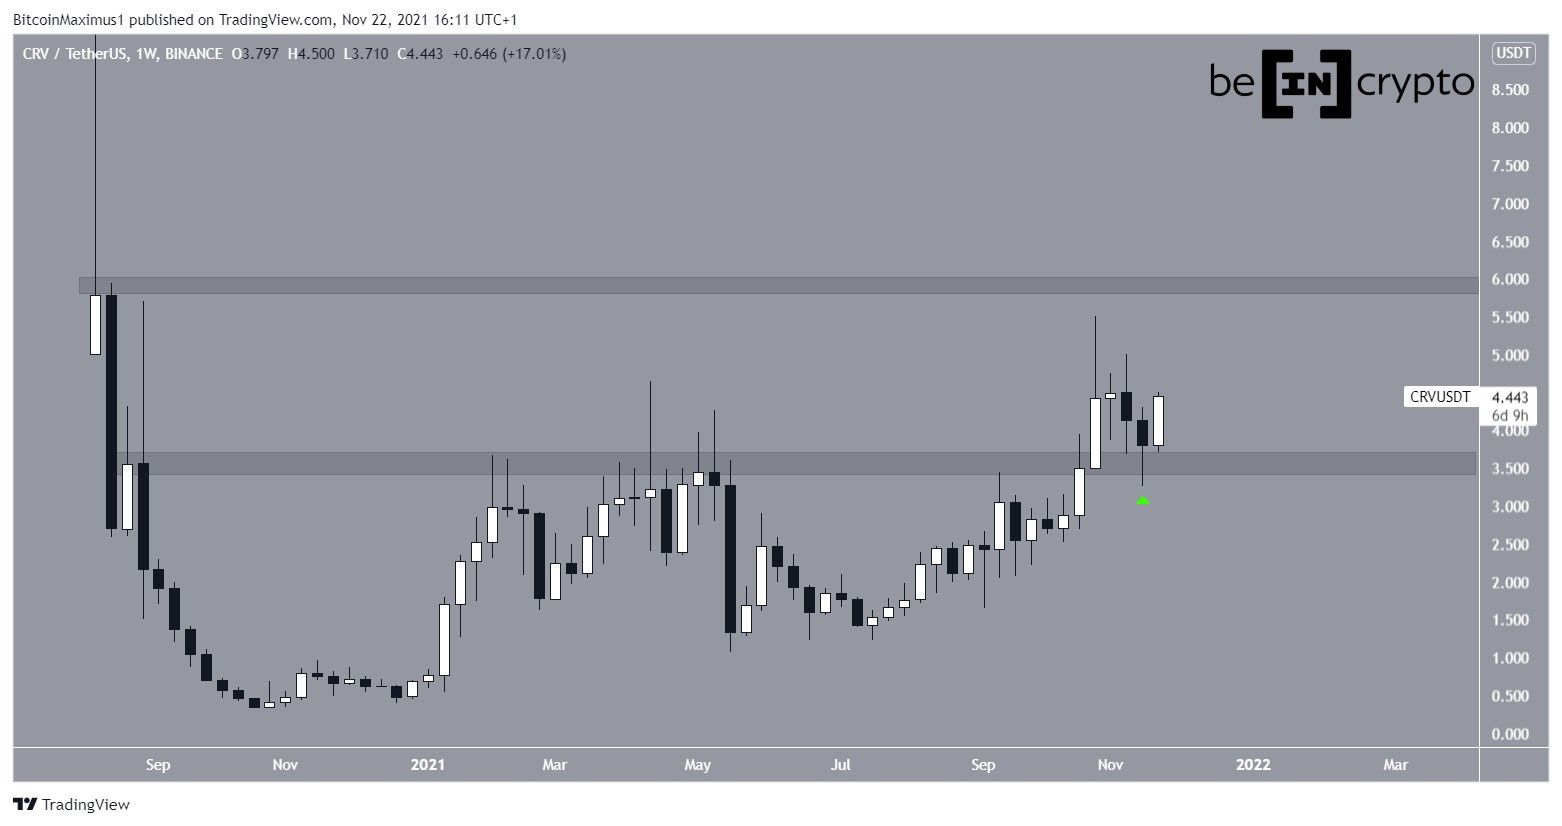
During the week of Nov 15 – 22, CRV created a long lower wick. This is considered a sign of buying pressure. More importantly, it occurred just above the $3.60 horizontal area. The same area had acted as resistance in the period between Sept 2020 – Oct 2021. Therefore, a breakout above it and its subsequent validation is an extremely bullish sign, since the area is now expected to provide support.
If CRV continues to increase, the next resistance would be at $6.
Future movement
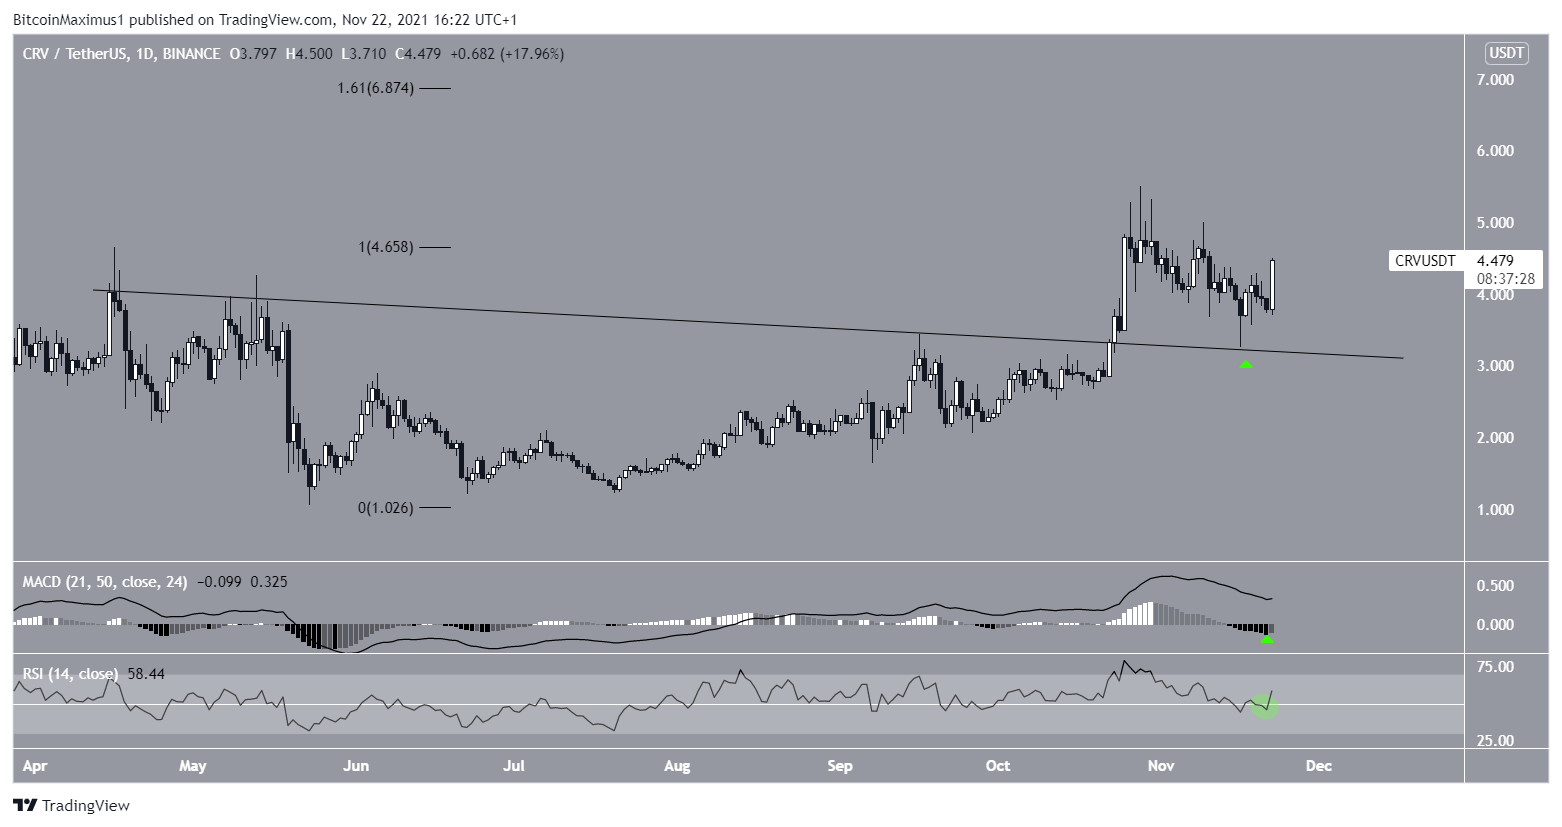
The daily chart supports the continuation of the upward movement. It shows that CRV has already broken out from a descending resistance line and validated it as support afterwards (green icon). This is another bullish sign that confirms the correction has ended.
If the upward movement continues, the next resistance would be at $6.87. This is the 1.61 external Fib retracement resistance level.
Technical indicators support the continuation of the upward movement.
The MACD, which is created by a short- and a long-term moving average (MA), is positive and has created a higher momentum bar. This means that the short-term MA is moving at a faster rate than the long-term one.
More importantly, the RSI has just moved above the 50 line (green circle). The RSI is a momentum indicator, and the movement above the 50 line suggests that the trend is still bullish.
CRV wave count
Cryptocurrency trader @AltstreetBet outlined a CRV wave count, which suggests the token will move to a new all-time high.
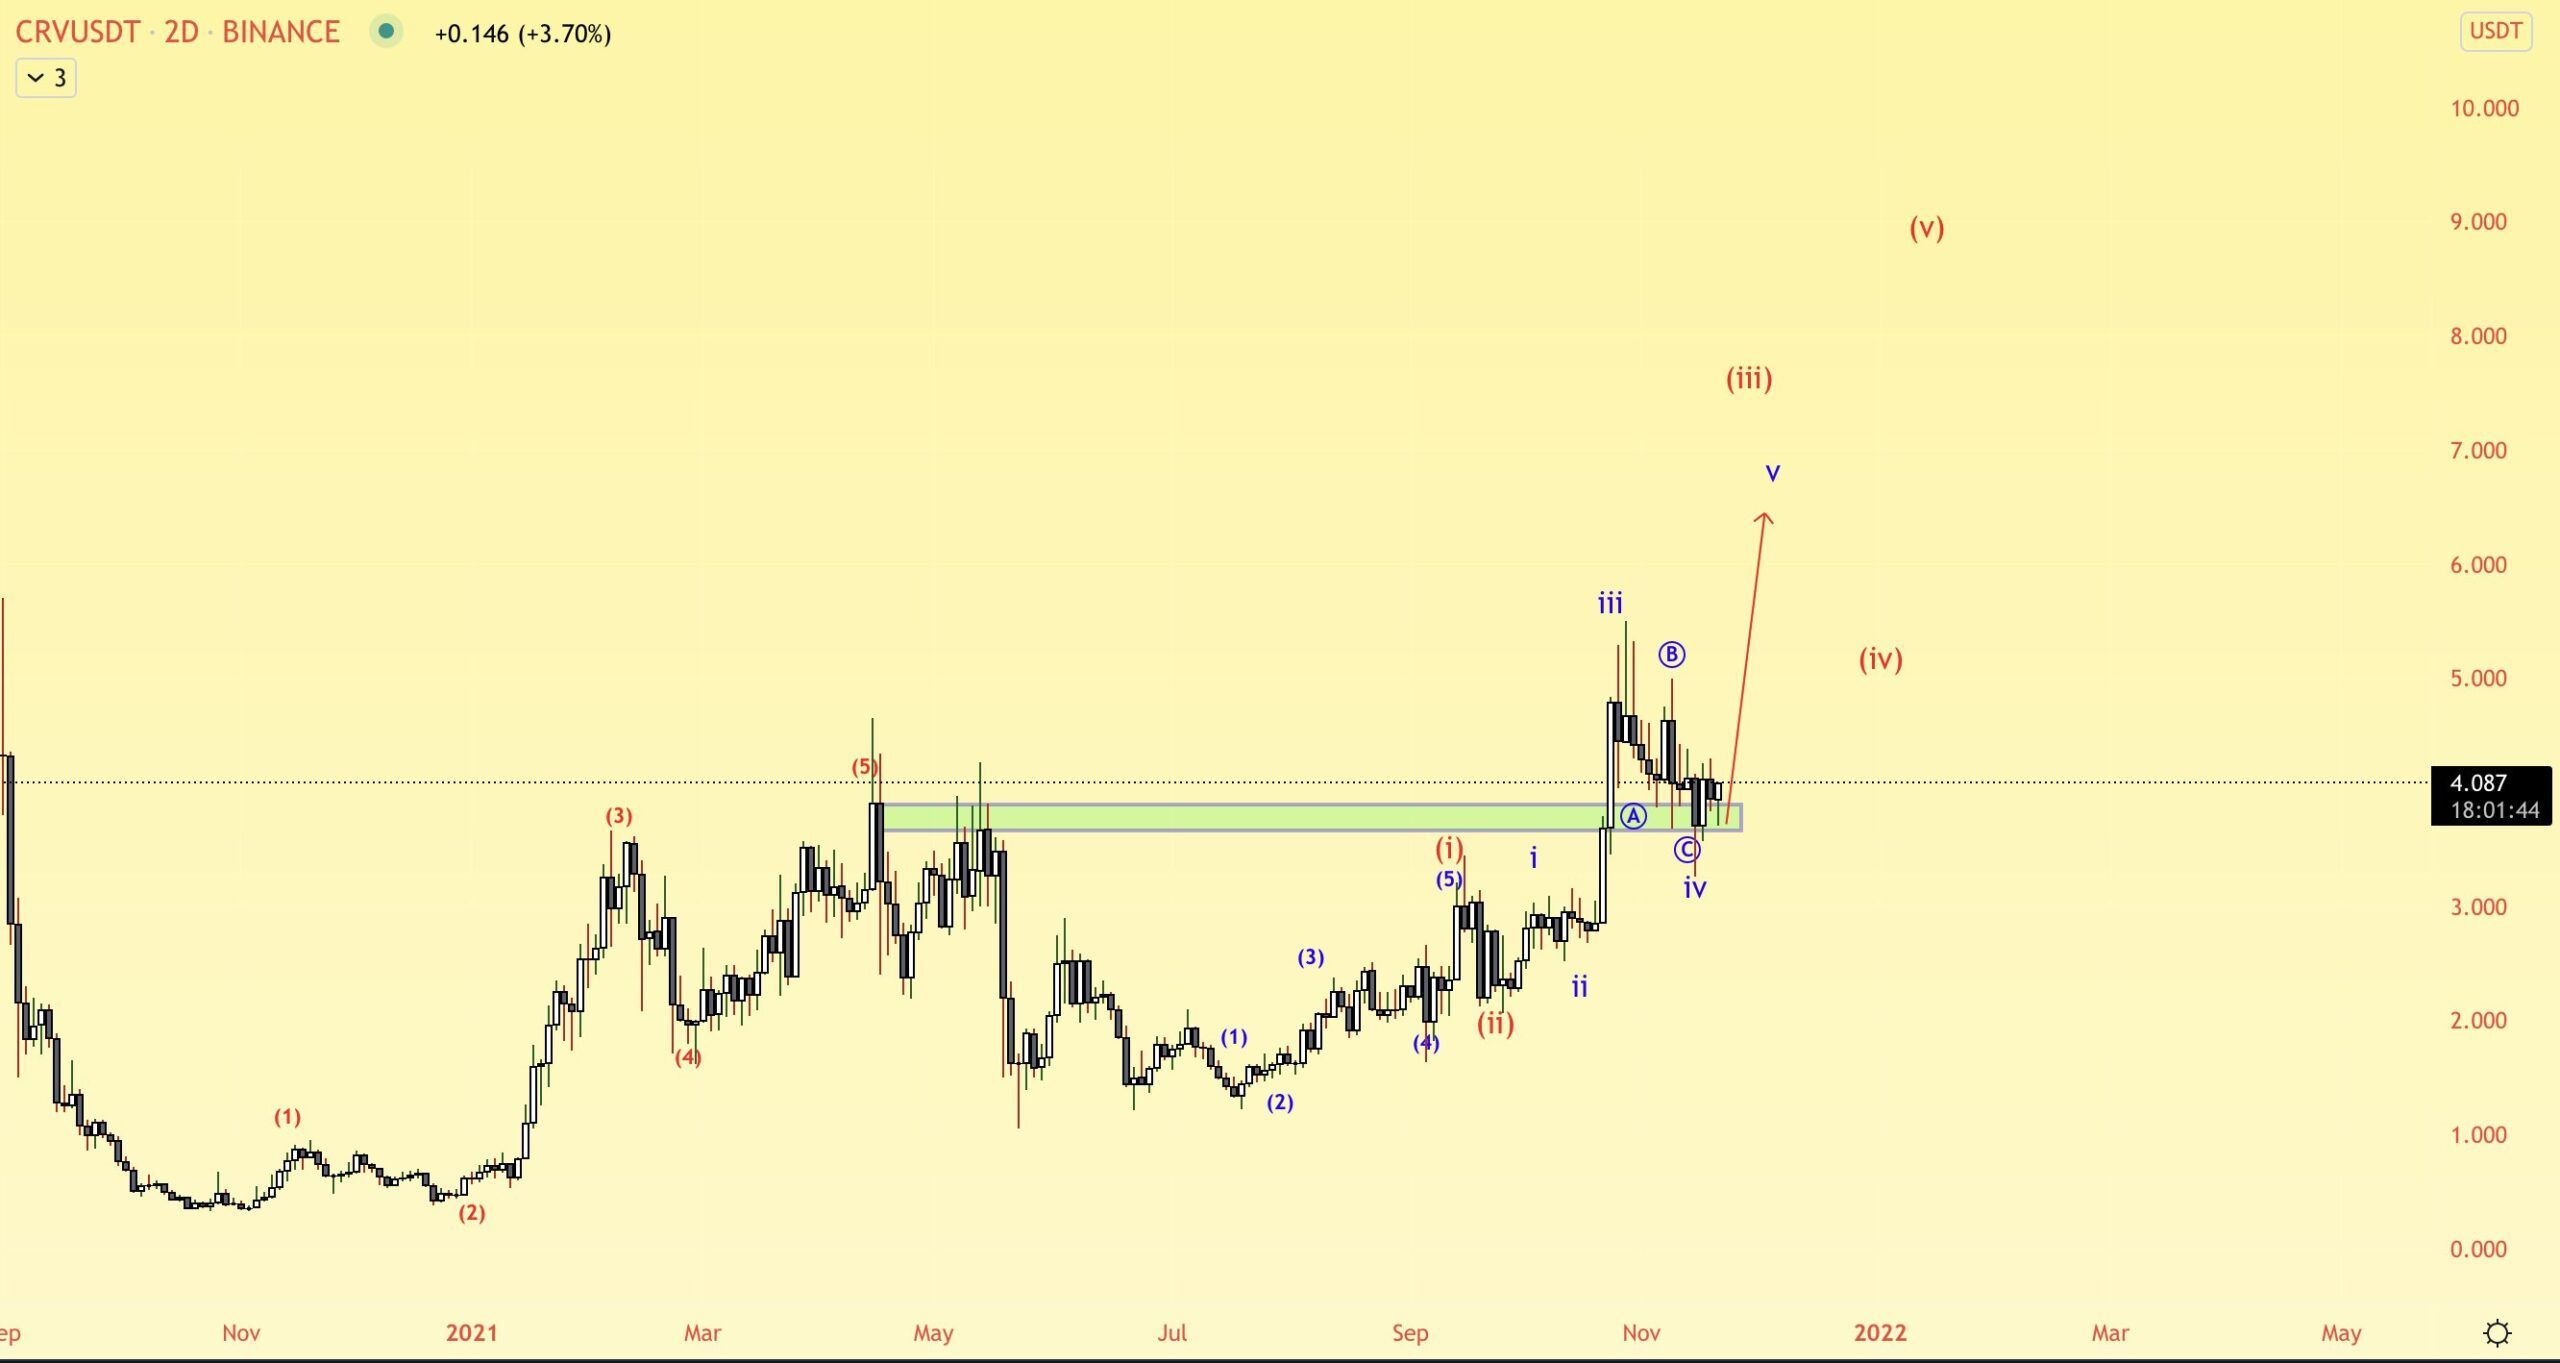
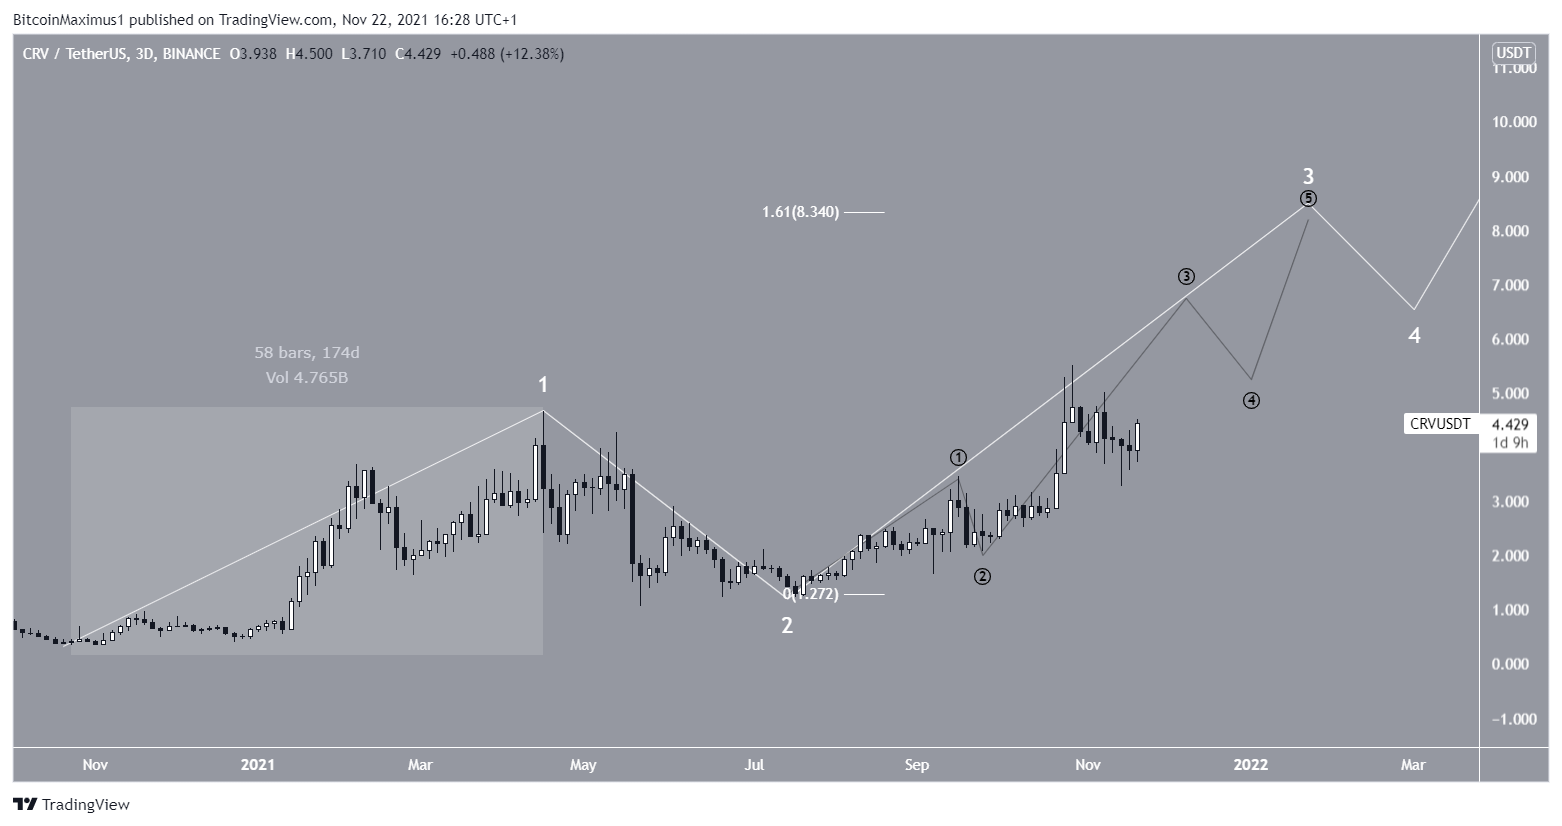
It seems likely that the entire movement from Nov 2020 to May 2021 (highlighted) was part of a long-term wave one. If so, the current increase is part of wave three of a five wave upward movement. Wave three is usually the sharpest.
A potential target for the top of wave three (white) is at $8.34. This would give waves 1:3 a 1:1.61 length, which is common in such upward movements.
The sub-wave count is given in black.
For BeInCrypto’s latest Bitcoin (BTC) analysis, click here.


