
Axie Infinity (AXS) has failed to create a bullish structure after bouncing from its June lows. As a result, a breakdown could occur soon.
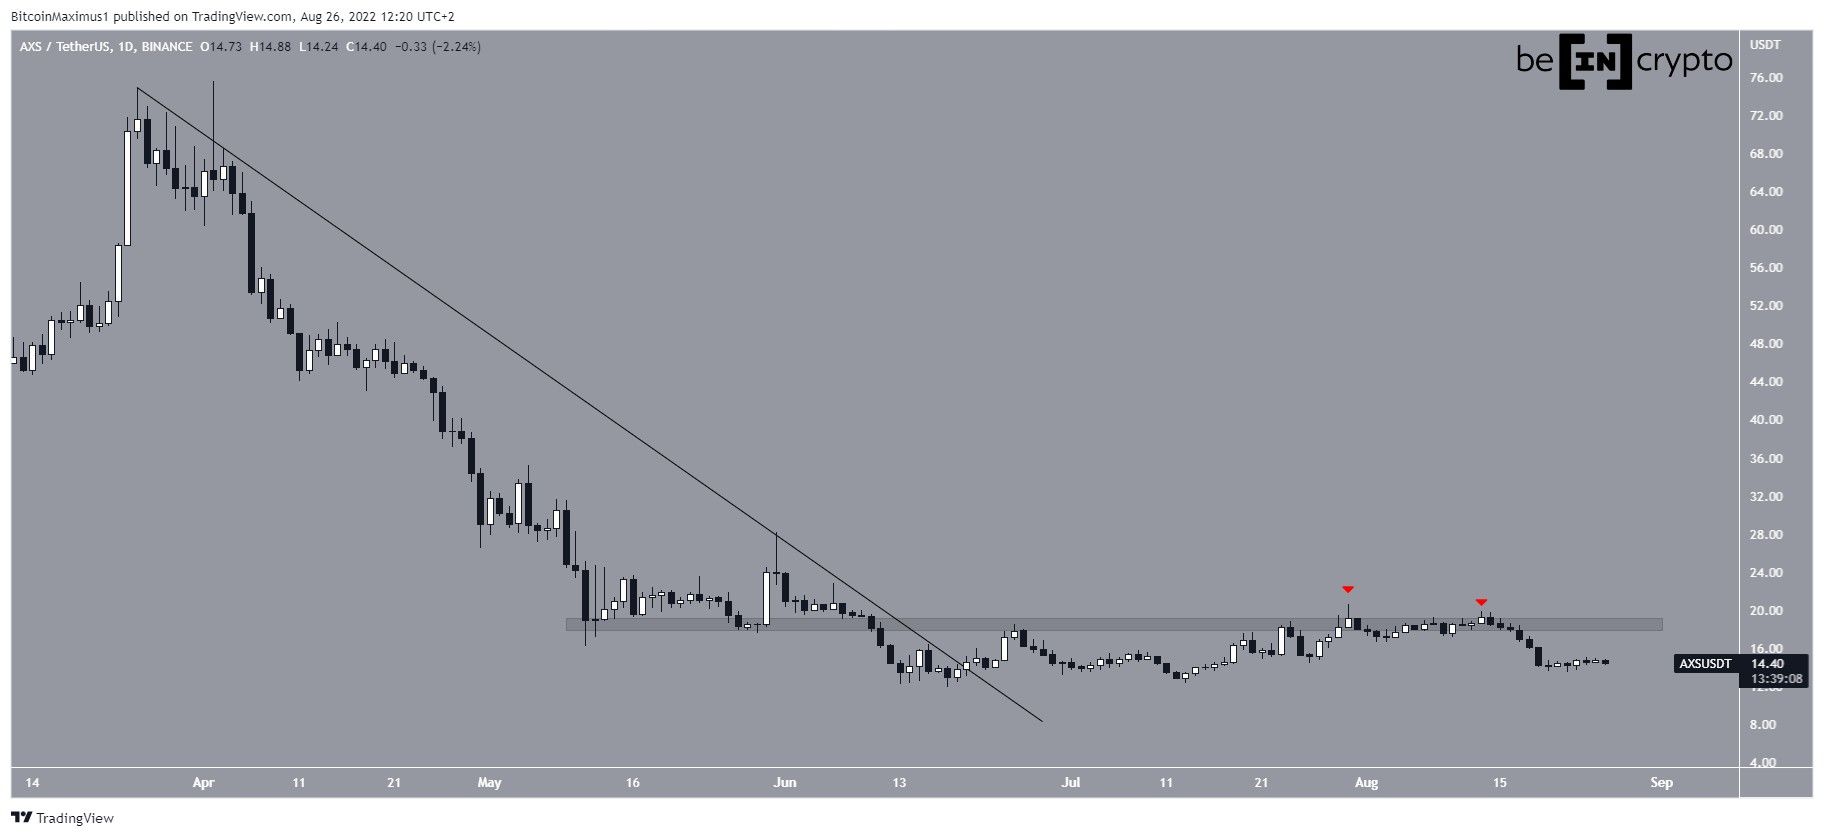
AXS has been moving upwards since June 18, and broke out from a descending resistance line two days later. Prior to the breakout, the resistance line had been in place since the end of March.
However, it failed to initiate a significant upward movement and was rejected twice by the $18.75 resistance area (red icons). The failure to break out shows significant weakness, since the breakout could not be sustained.
So, as a result of the rejection, it is possible that the price will fall below its June lows.
Bearish AXS pattern
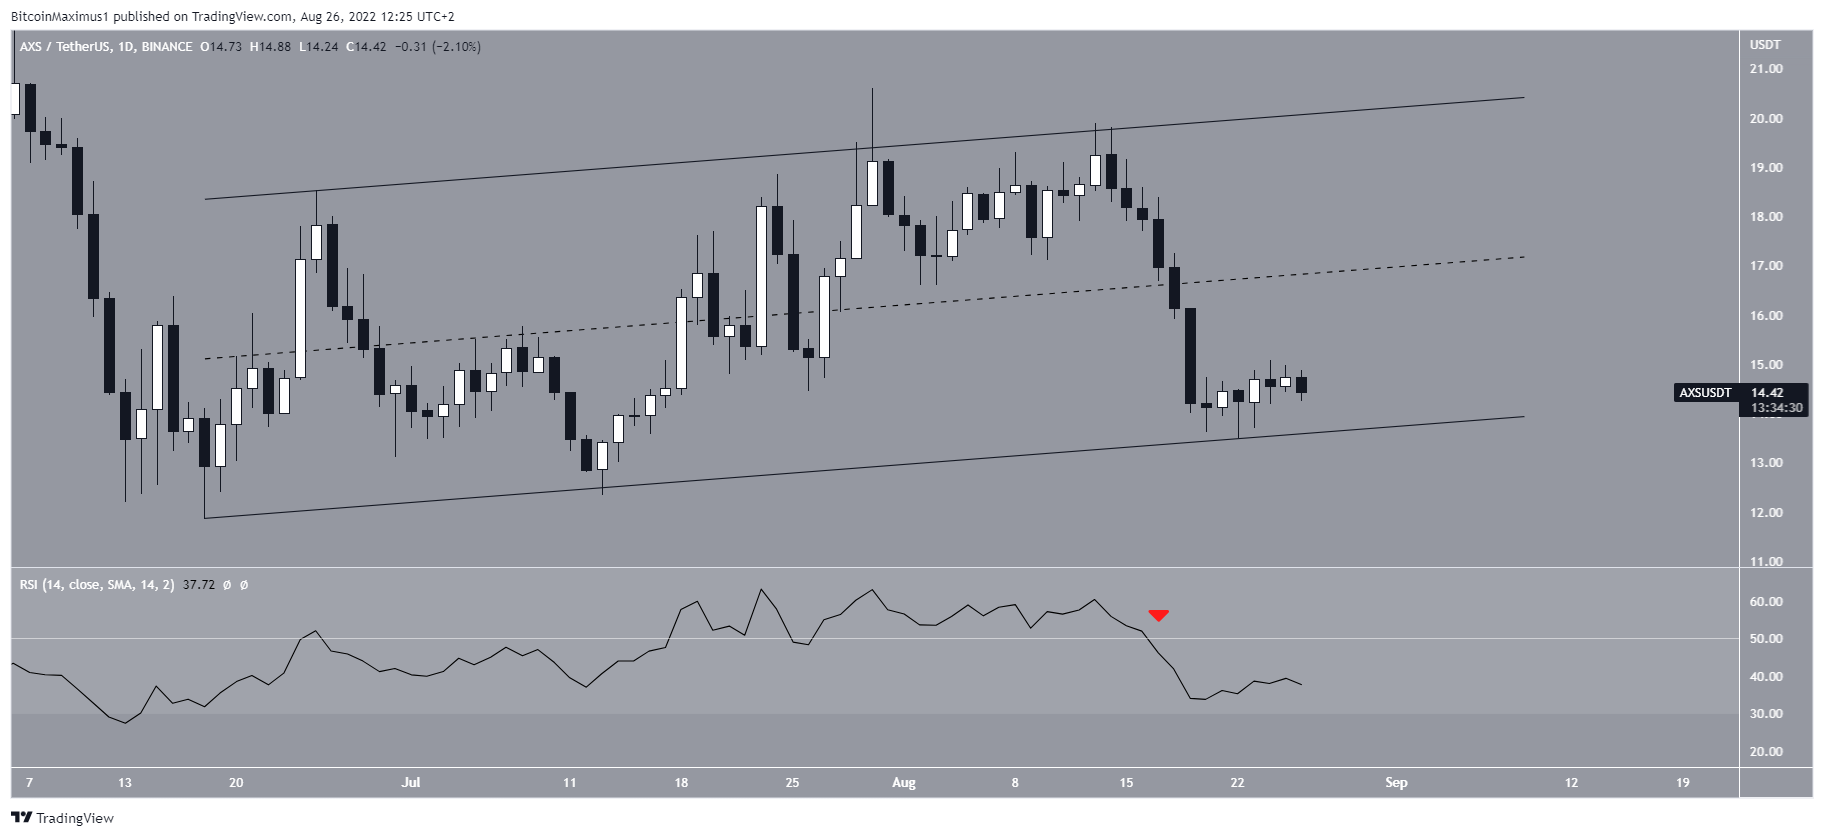
The daily chart shows that AXS has been trading inside an ascending parallel channel since its June lows. Such channels usually contain corrective movements, meaning that a breakdown from it would be the most likely scenario.
Additionally, the daily RSI has broken down below 50 (red icon), further supporting the possibility that the price will break down.
So, both the price action and technical indicator readings from the daily time frame suggest that a breakdown from the channel is expected. This would likely take the price to a new yearly low.
Future movement
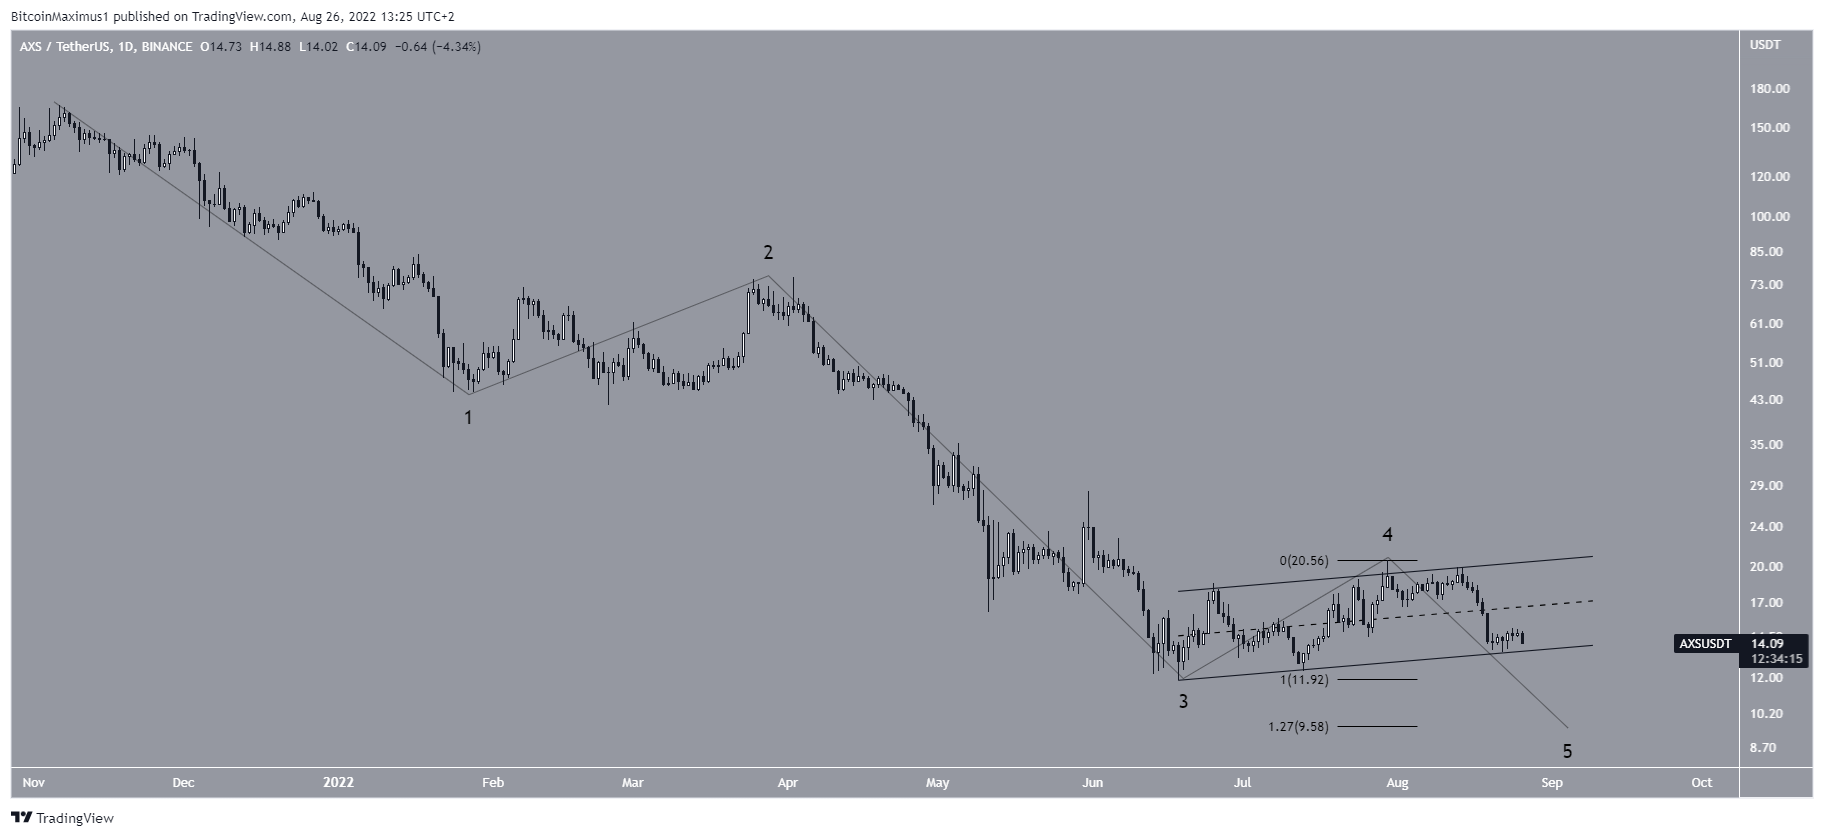
Measuring from the all-time high, it seems that AXS is in the fifth and final wave of a bearish impulse. The presence of the aforementioned channel suggests that the price is in wave four.
So, a breakdown from this channel would confirm that the fifth and final wave is underway.
The first potential target for the bottom of this movement is at $9.60. The target is found by the 1.27 external Fib retracement level when measuring the most recent bounce.
For Be[in]Crypto’s latest Bitcoin (BTC) analysis, click here
