SAND has broken out from a descending resistance line.
promo
BeInCrypto takes a look at the price movement for three different gaming tokens : Axie Infinity (AXS), Smooth Love Potion (SLP) and The Sandbox (SAND).
AXS
Axie Infinity (AXS) has been moving downwards since it reached an all-time high of $155 on Oct 4. The downward movement however has been very gradual, leading only to a local low of $111 on Oct 11. The token has been moving upwards since.
Technical indicators are mixed. The RSI, which is a momentum indicator, is decreasing. This means that the upward movement is losing momentum. However, the trendline is very close to breaking, which would be a bullish signal which often precedes upward movements. The same reading is given by the MACD, which is created by a short- and long-term moving average (MA).
The next closest resistance levels are at $170 and $216. These are the 2.61 and 3.61 external Fib retracement resistance levels. When a token is at an all-time high, they are used to determine the closest resistance levels.
Chart By TradingView
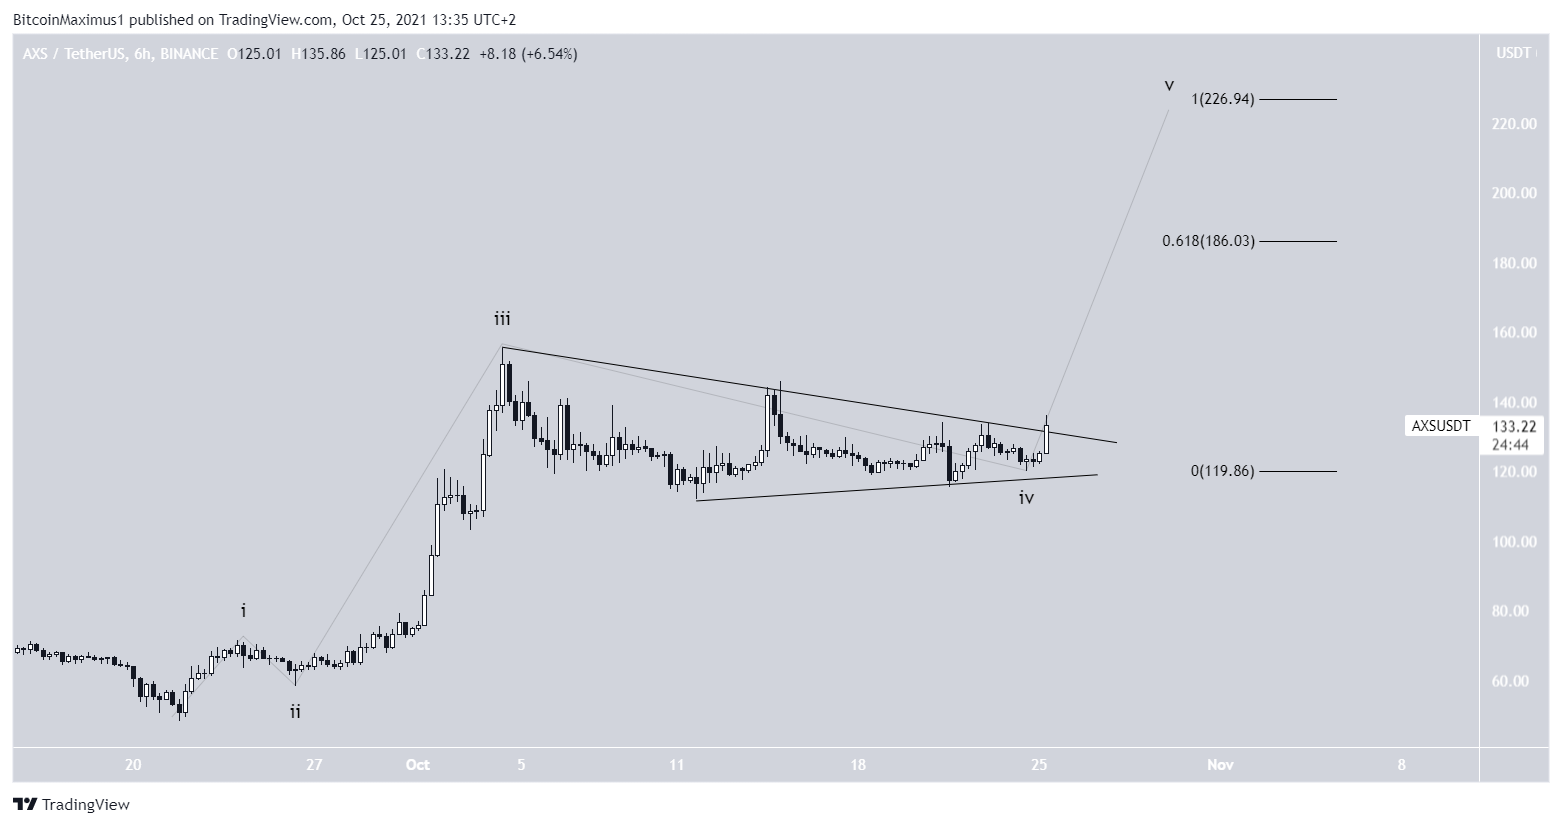
The wave count indicates that AXS has most likely completed wave four of a bullish impulse (black). A bullish impulse is a five wave upward movement, and wave four most often takes the shape of a symmetrical triangle.
Using the length of waves 1-3, the most likely targets for the top of the upward movement would are at $186 and $226.
Since the latter coincides with the previously outlined $216 fib resistance, it would be more likely to act as a high.
Chart By TradingView
Highlights
AXS is breaking out from a symmetrical triangle.
It has possibly begun wave five of a bullish impulse.
SLP
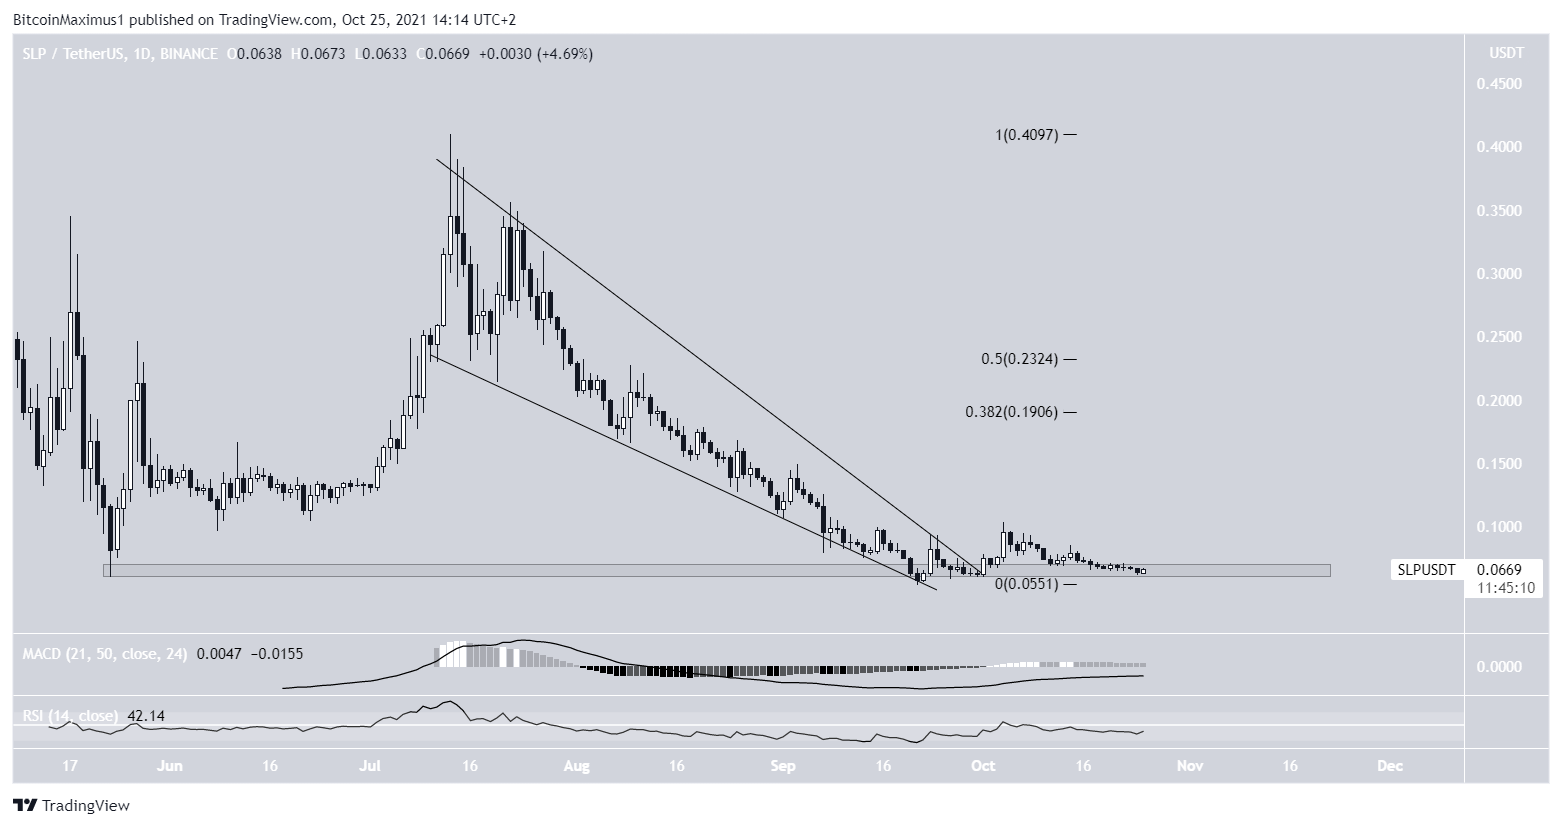
Smooth Love Potion (SLP) had been decreasing inside a descending wedge since July 13. The descending wedge is considered a bullish pattern, meaning that a breakout would be expected in the majority of the cases.
On Oct 1, SLP did break out from this pattern. However, it has failed to initiate a significant upward movement and is back at the $0.066 horizontal support area. This is the final support area prior to a new all-time low.
Both the MACD and RSI give a bearish/neutral reading. The former is negative, meaning that the short-term trend is slower than the long-term one, while the latter is below 50, a sign of a bearish trend.
Chart By TradingView
Highlights
SLP has broken out from a descending wedge.
There is support at $0.066.
SAND
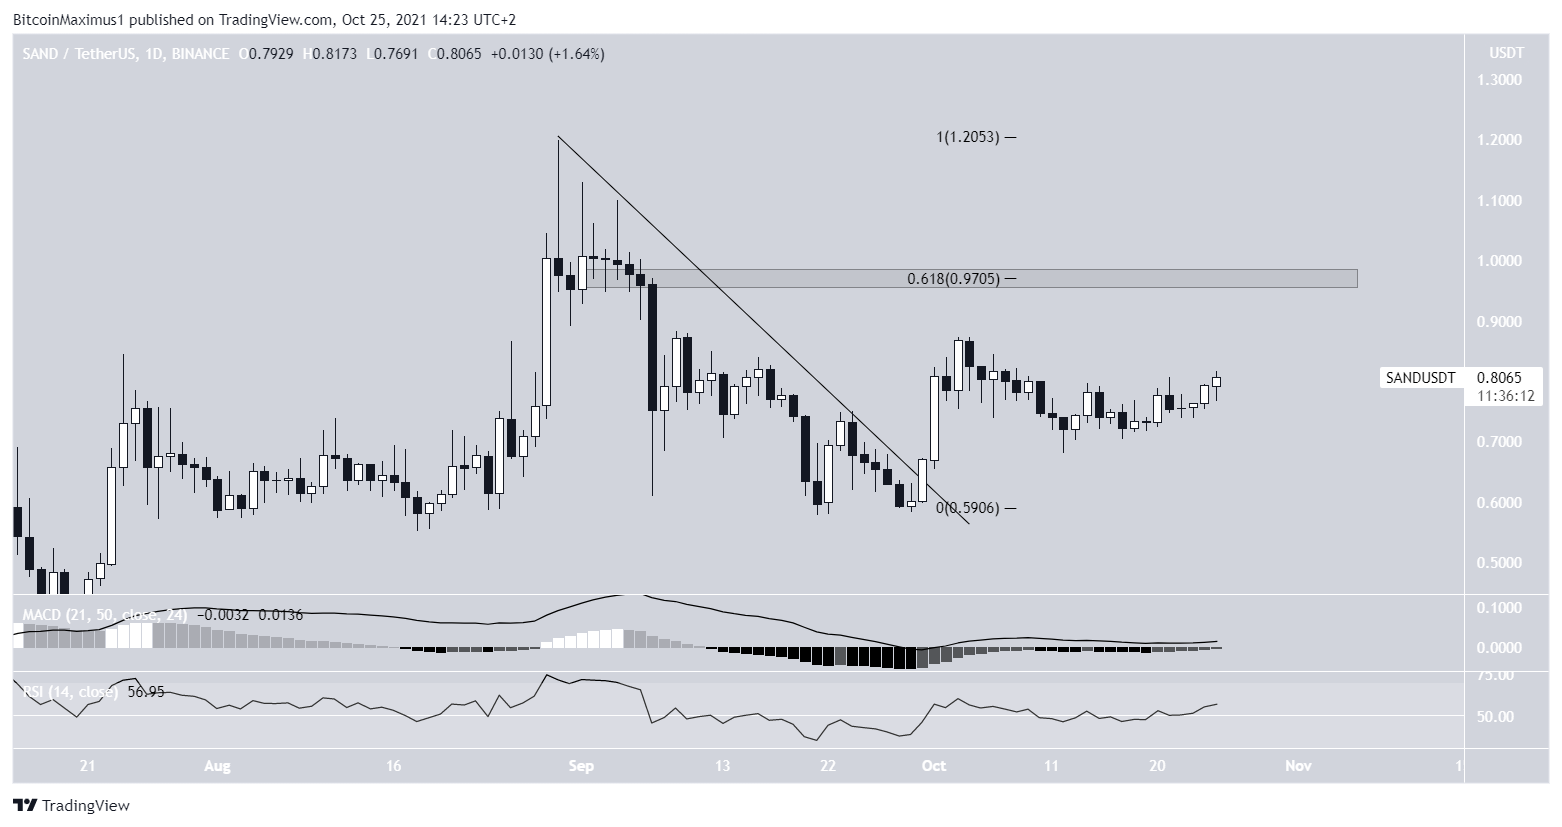
The Sandbox (SAND) has been increasing since Sept 30, when it broke out from a descending resistance line. The breakout indicated that the previous downward movement had come to an end.
The increase is supported by both the MACD and RSI, which are moving upwards. The former is positive, meaning that the short-term trend is faster than the long-term one, while the latter is above 50, a sign of bullish momentum.
The closest resistance area is at $0.97. This is the 0.618 Fib retracement resistance level and a horizontal resistance area.
If SAND manages to reclaim it, it would likely increase towards a new all-time high price.
Chart By TradingView
Highlights
SAND has broken out from a descending resistance line.
In line with the Trust Project guidelines, this price analysis article is for informational purposes only and should not be considered financial or investment advice. BeInCrypto is committed to accurate, unbiased reporting, but market conditions are subject to change without notice. Always conduct your own research and consult with a professional before making any financial decisions. Please note that our Terms and Conditions, Privacy Policy, and Disclaimers have been updated.
Valdrin discovered cryptocurrencies while he was getting his MSc in Financial Markets from the Barcelona School of Economics. Shortly after graduating, he began writing for several different cryptocurrency related websites as a freelancer before eventually taking on the role of BeInCrypto's Senior Analyst.
(I do not have a discord and will not contact you first there. Beware of scammers)