


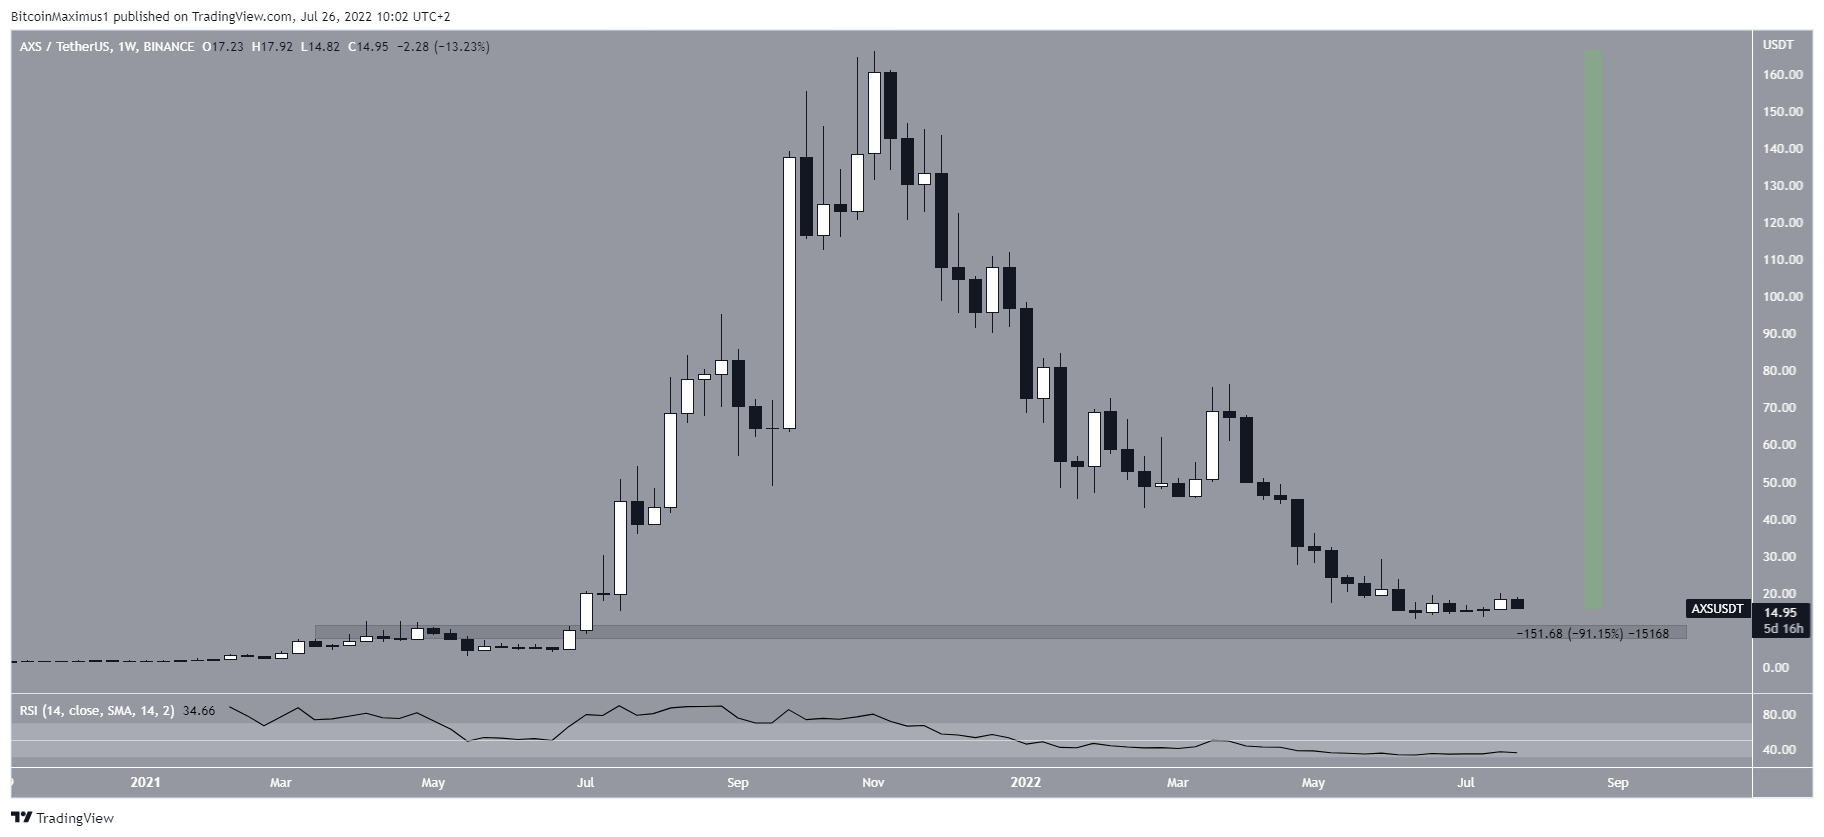
Axie Infinity (AXS) is trading inside a bearish pattern and has been rejected by a horizontal resistance area, indicating that it could still be in a bearish trend.
AXS has been falling since reaching an all-time high price of $166 in Nov. The downward movement so far led to a low of $11.85 in June. While the price has bounced slightly since, it has failed to initiate any significant upward movement.
The closest support area is at $9, created by the May 2021 highs. While the price is trading close to it, the weekly RSI is falling and is below 50, thus failing to provide any signs of a potential bullish reversal.
Measuring from the all-time high, AXS has fallen by 91%.
Potential bounce
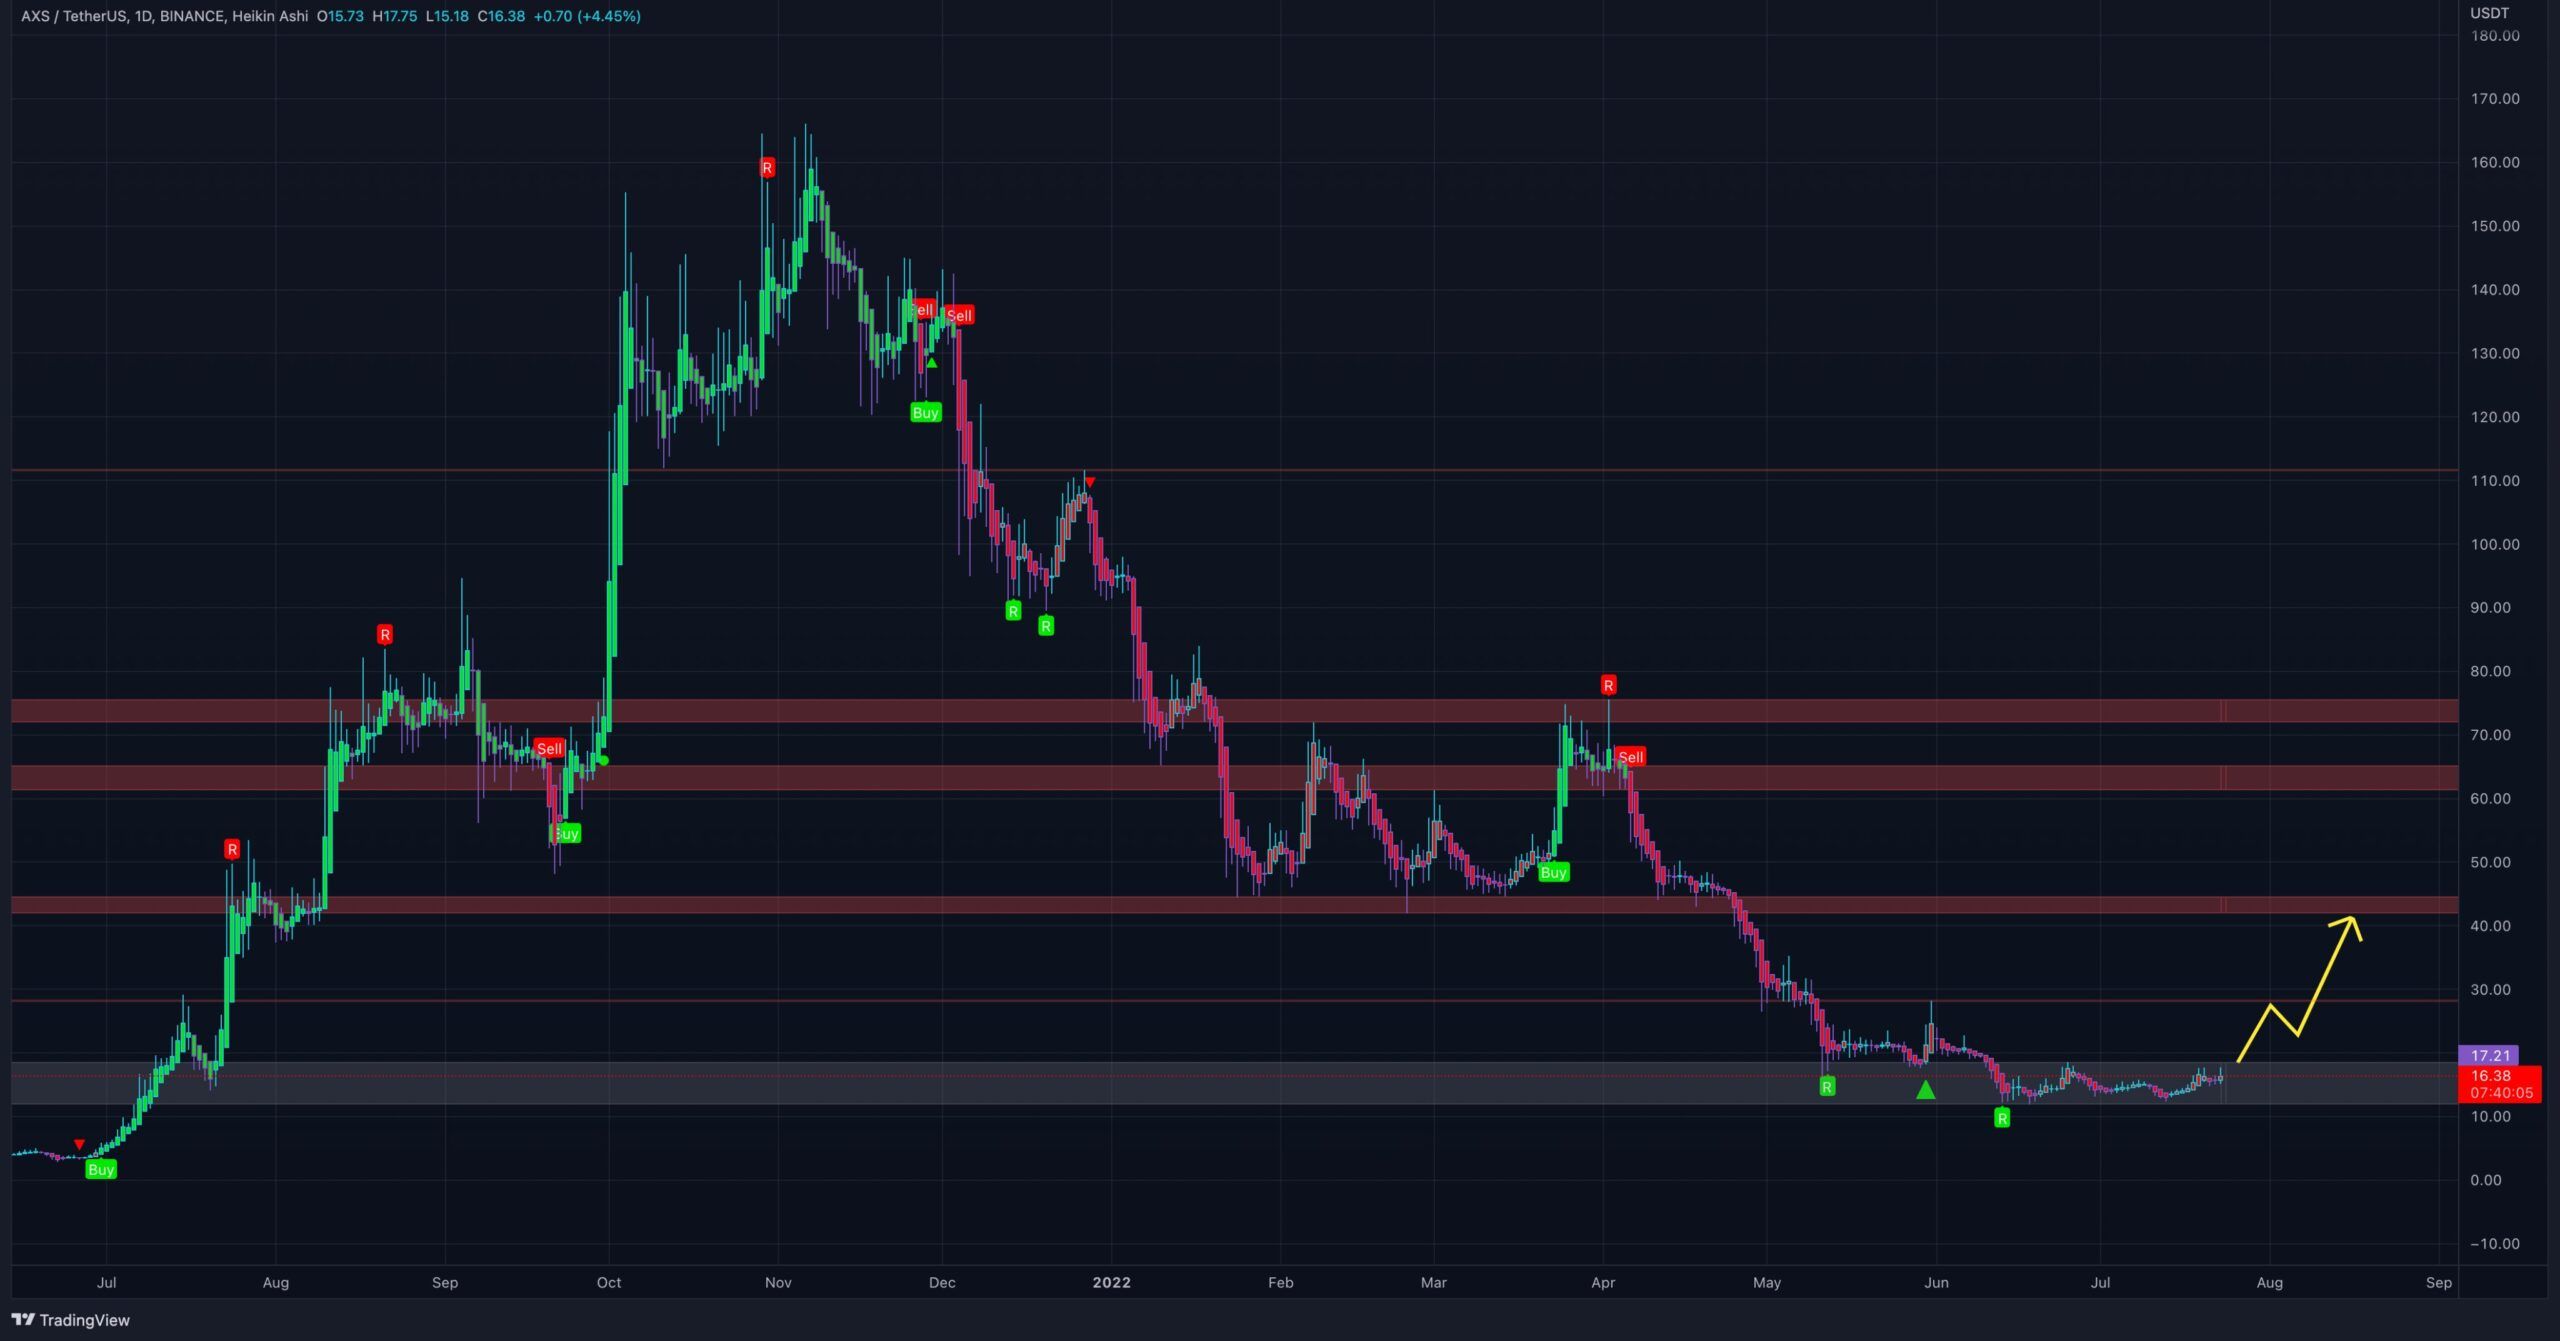
Cryptocurrency trader @MTI_Trading tweeted a chart of AXS, stating that the price is trading inside an accumulation range and could bounce soon.
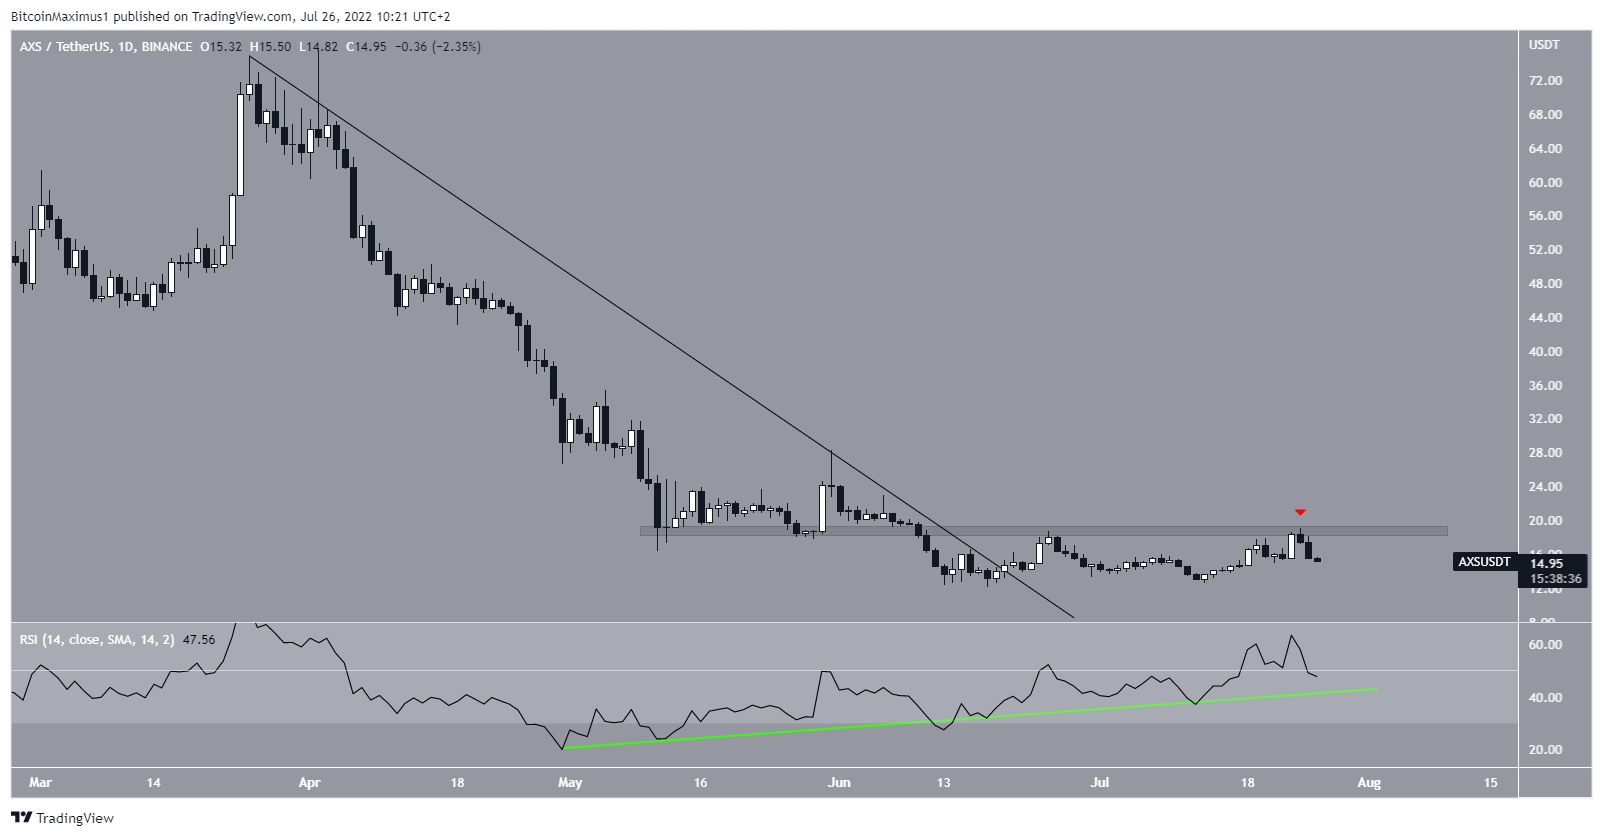
The daily chart does support the possibility of a potential bounce. The two main reasons for this are the breakout from a descending resistance line and the bullish divergence in the daily RSI.
Moreover, the RSI is trading at 50 and its bullish divergence trend line (green line) is still intact. As long as it is so, it is possible that the trend is bullish.
However, the price has also been rejected by the $18 resistance area (red icon) and fallen sharply afterwards.
In order for the trend to be confirmed as bullish, AXS has to break out from this resistance line.
Short-term AXS breakdown
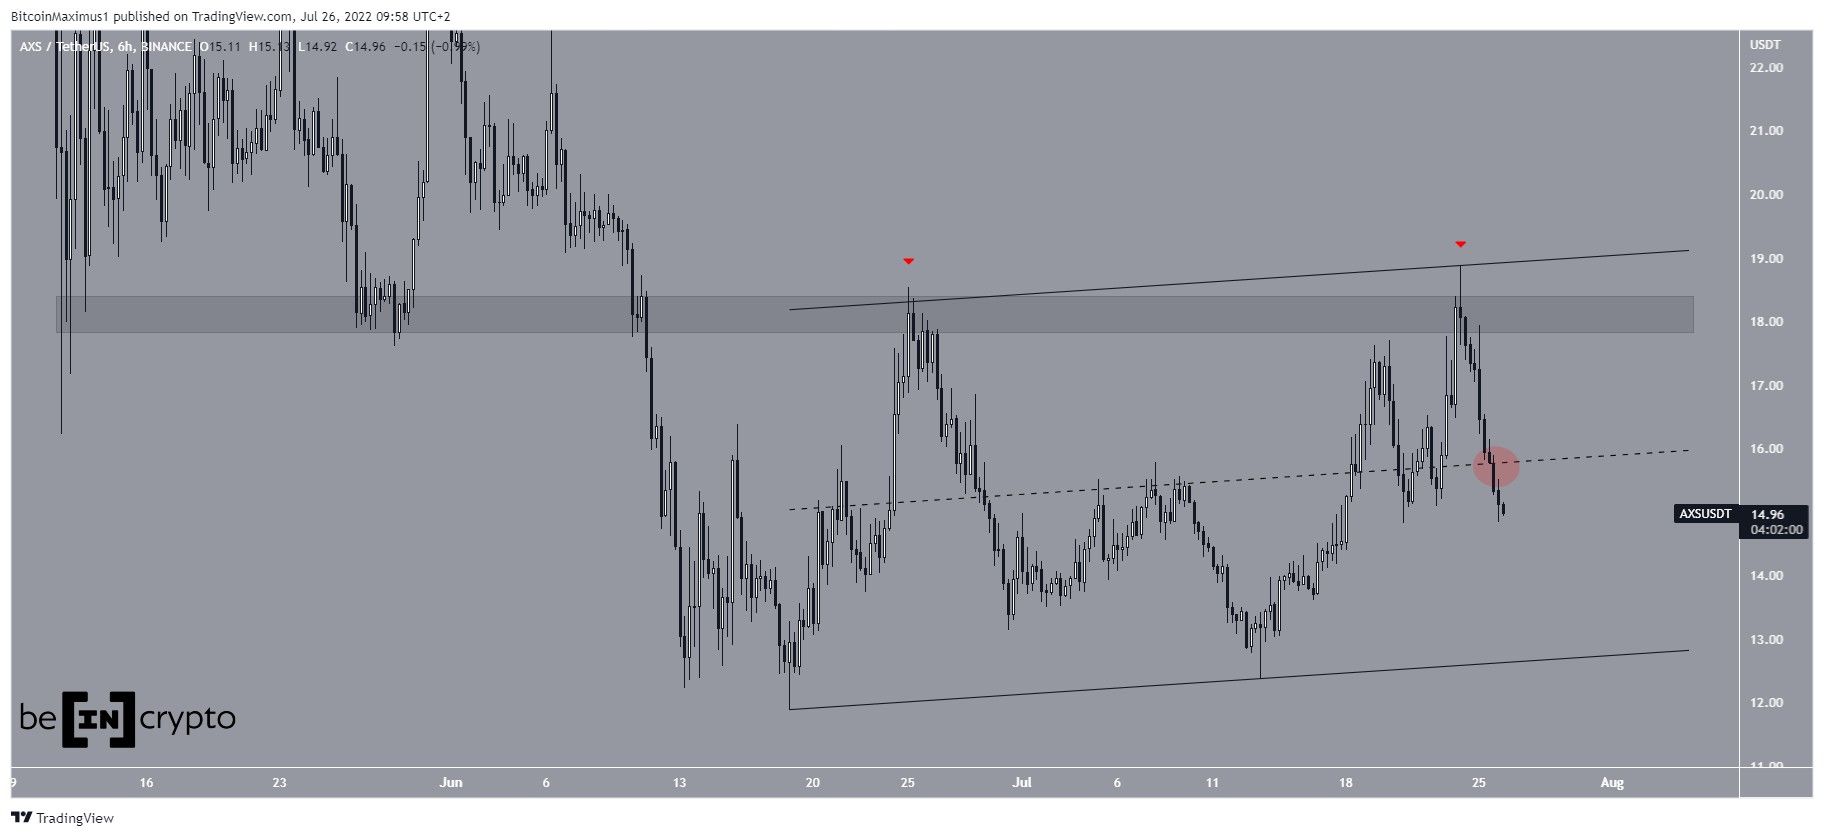
Finally, the six-hour chart provides a bearish outlook that suggests the price will break down.
Besides being rejected by the $18 resistance area, AXS has been trading inside an ascending parallel channel since its July lows. Such channels usually contain corrective movements, meaning that a breakdown from it would be likely.
Furthermore, the price is trading below the middle of the channel (red icon). If a breakdown occurs, a drop towards the previously outlined $10 area would be expected.
For Be[in]Crypto’s latest Bitcoin (BTC) analysis, click here


