Axie Infinity (AXS) has created a bullish pattern inside a long-term horizontal support area.
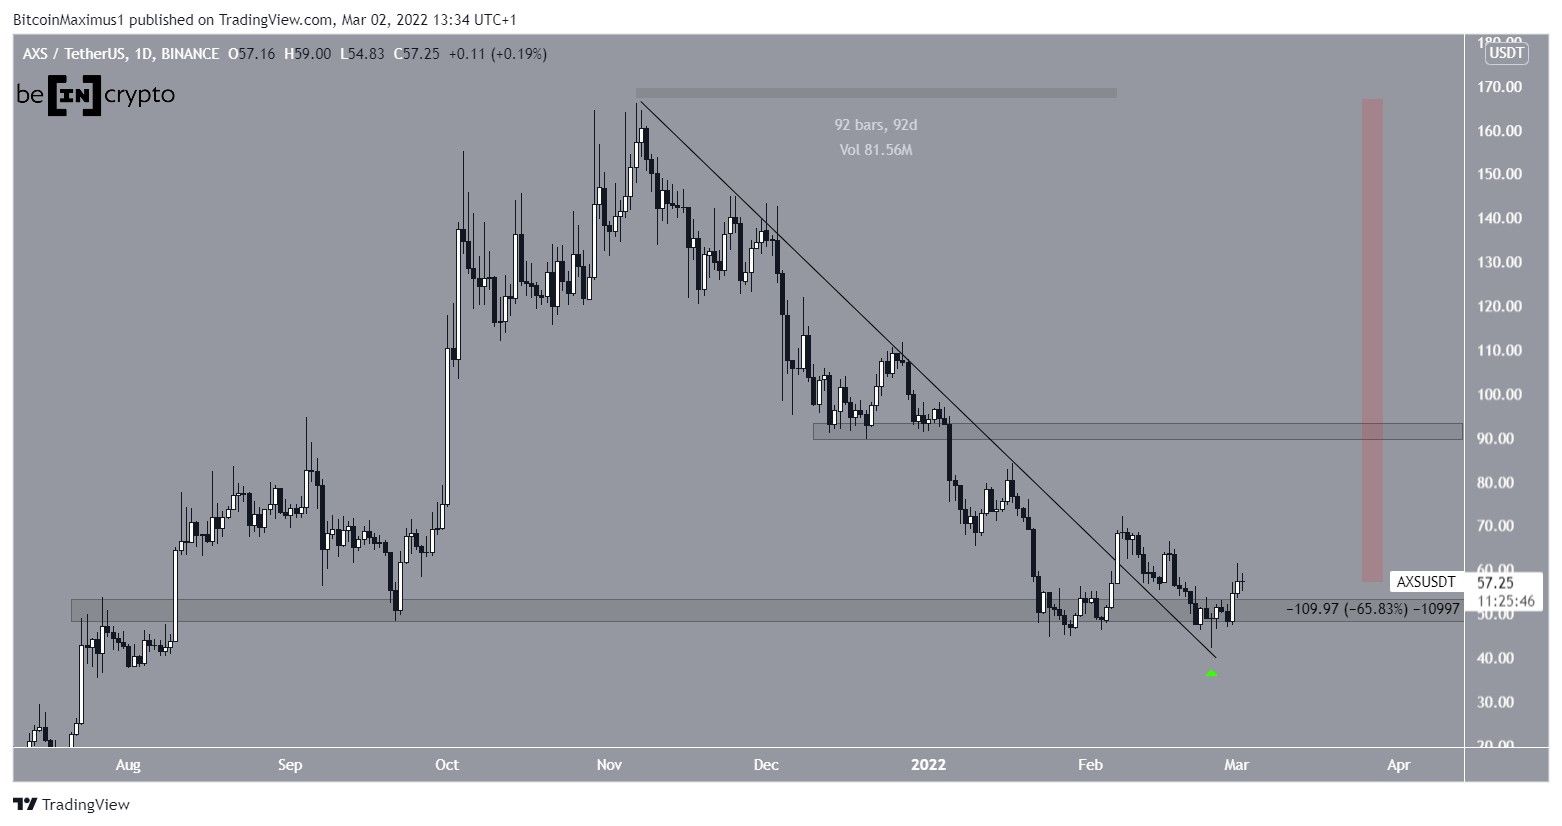
AXS has been decreasing alongside a descending resistance line since reaching an all-time high price of $166 on Nov 6.
After reaching the $51 horizontal support area, AXS bounced and broke out from the aforementioned descending resistance line. This meant that the resistance line stood for 92 days prior to the breakout. Afterwards, it returned to validate it as support (green icon) on Feb 24.
The price has been increasing since. If the upward movement continues, the next closest resistance area would be at $92.
However, despite the bounce, AXS is still trading 66% below its all-time high price.
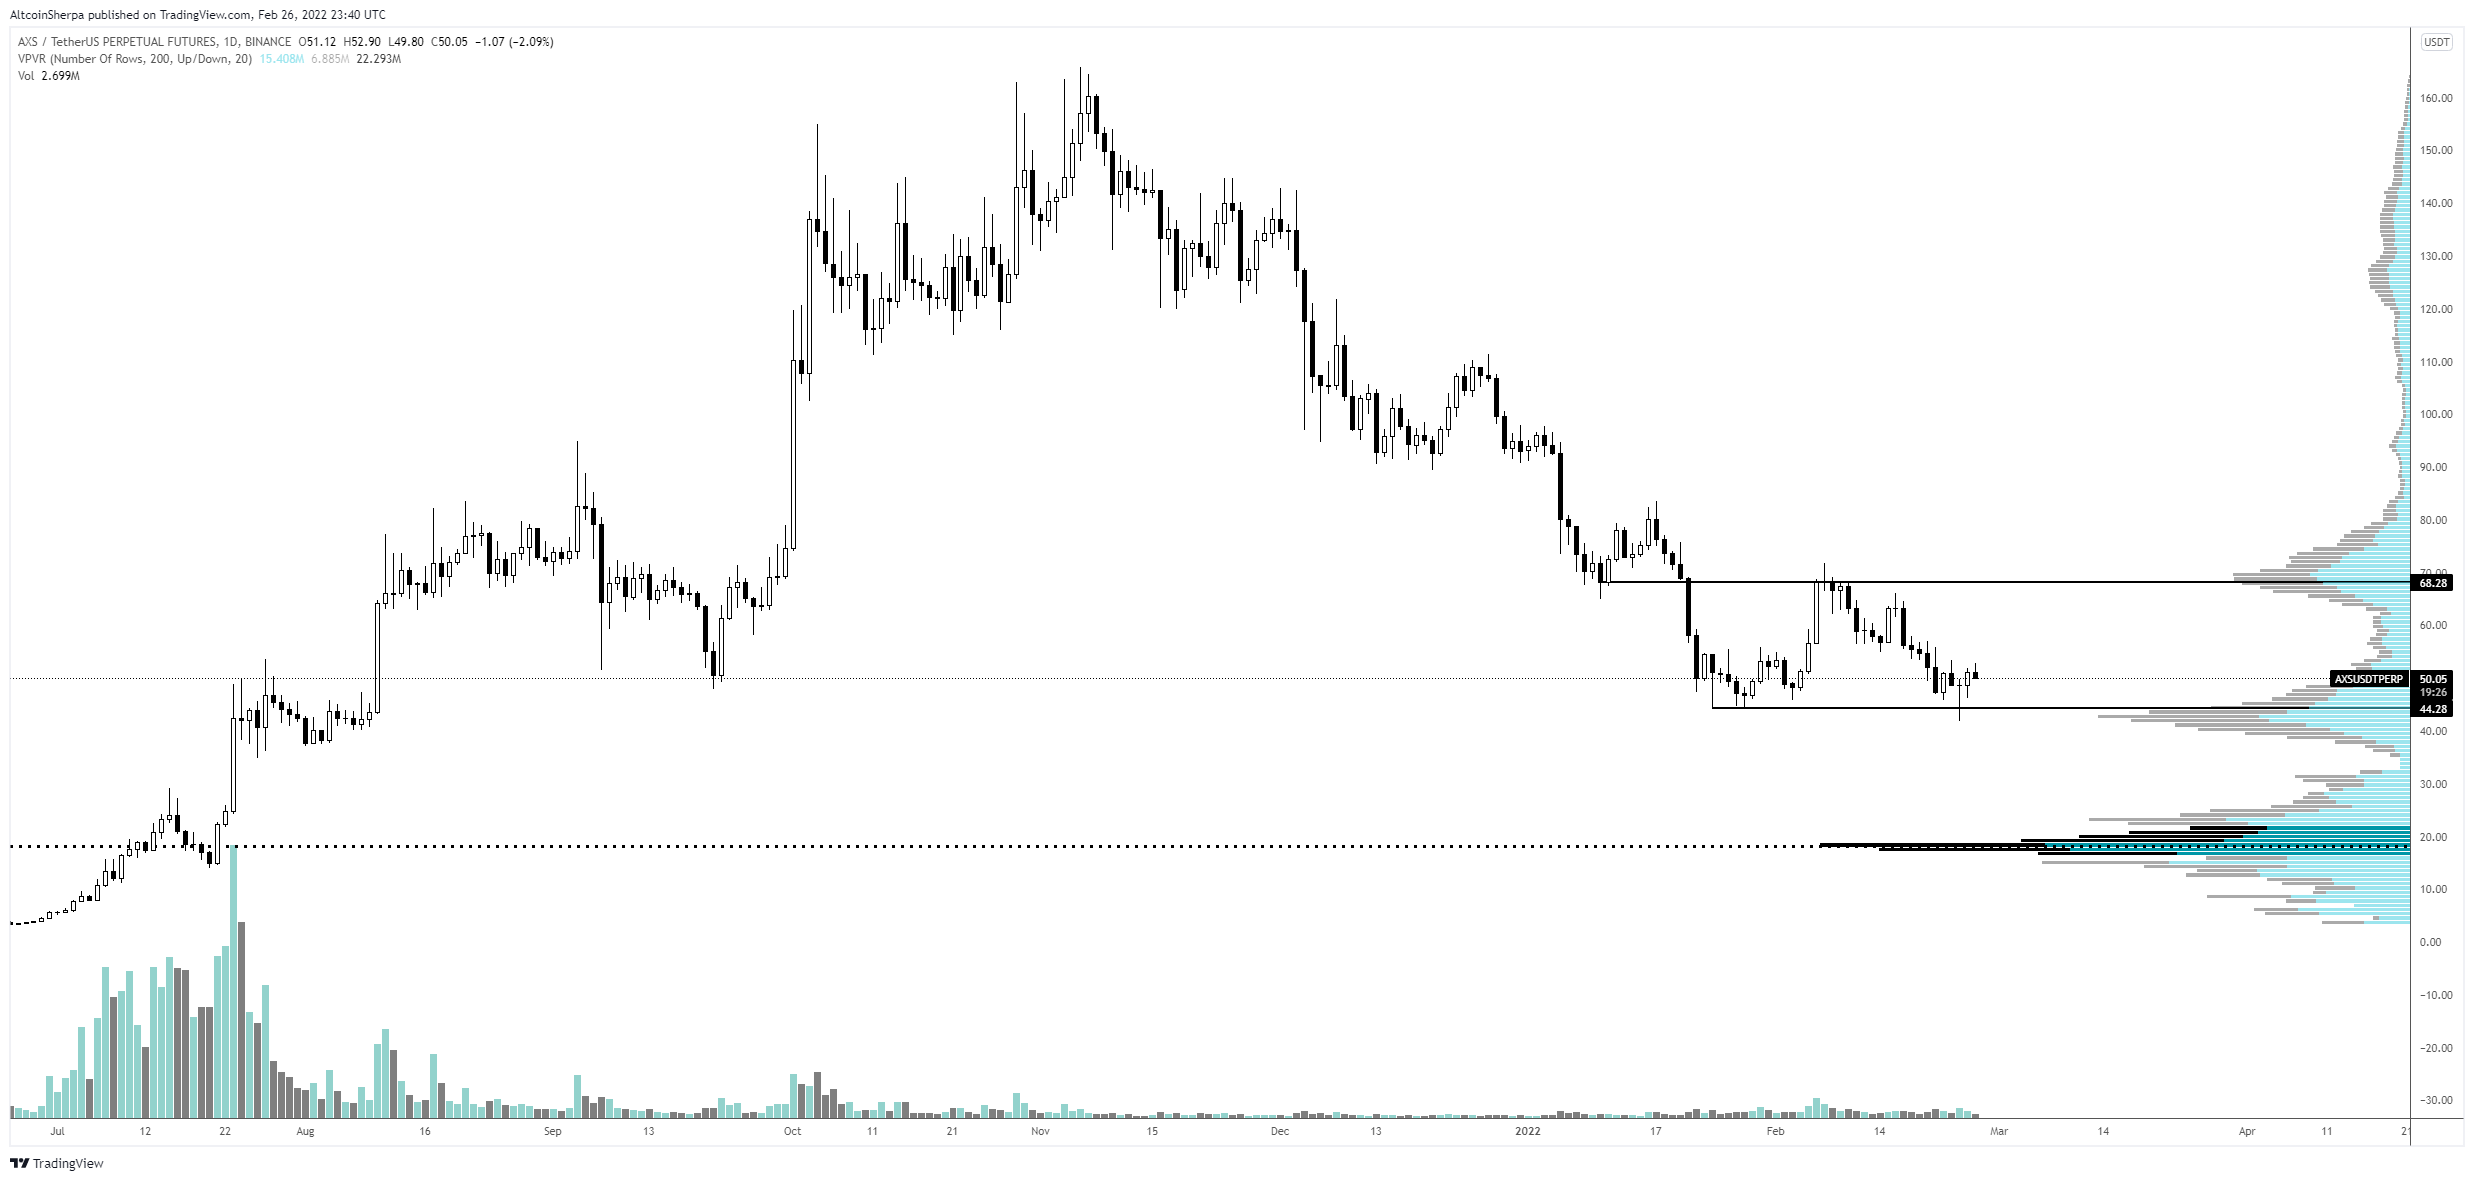
Cryptocurrency trader @AltcoinSherpa tweeted a chart of AXS, stating that the correction could soon be complete.
A look at technical indicators is required in order to determine if AXS will continue moving upwards.
Bullish AXS pattern
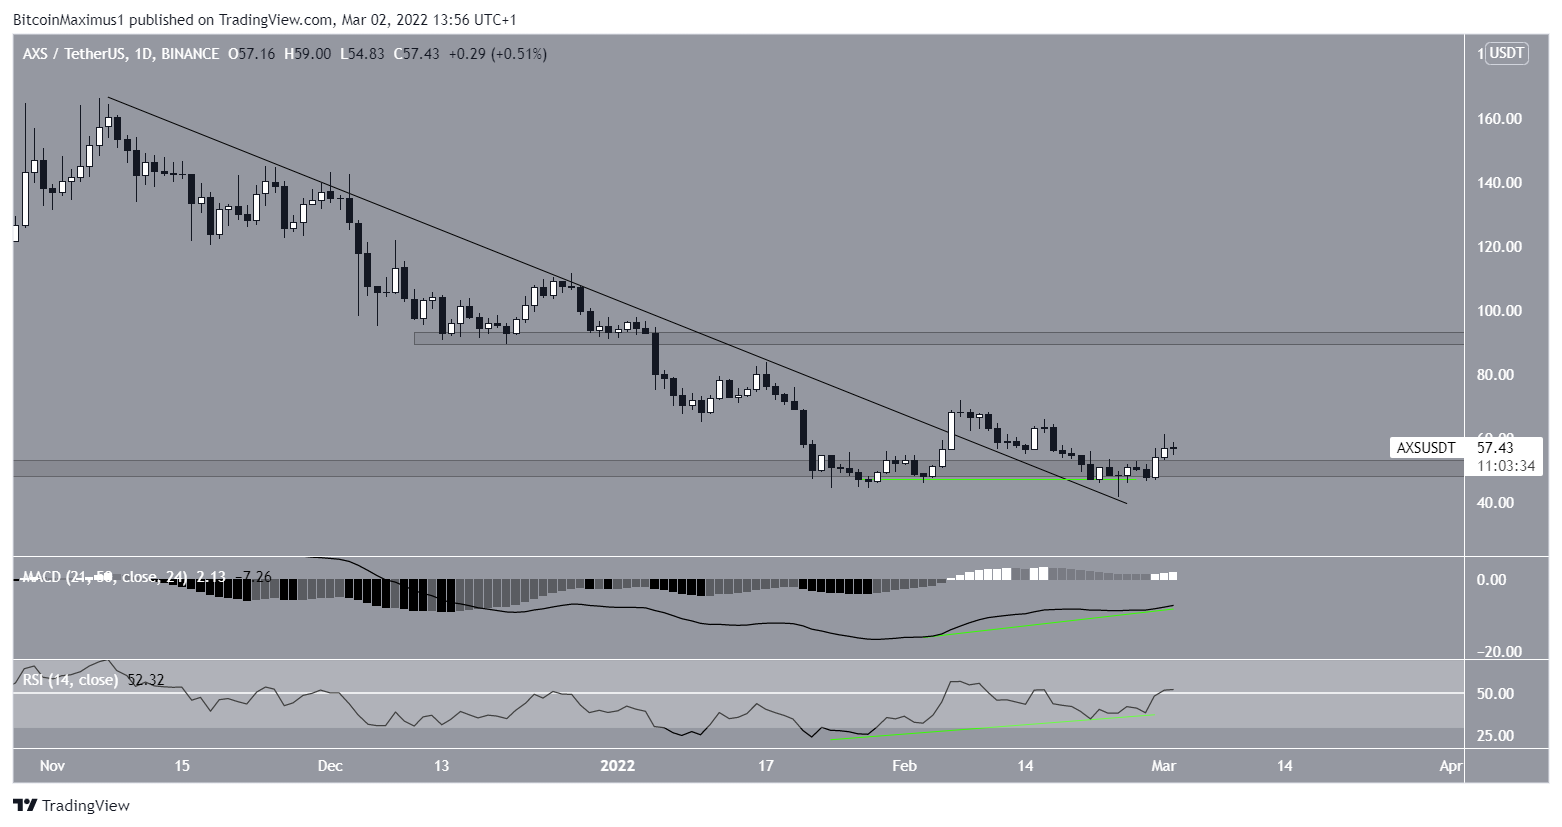
Technical indicators in the daily time-frame support the continuation of the upward movement. This is especially evident in the pronounced bullish divergences (green lines) in both the RSI and MACD. Such divergences often precede bullish trend reversals.
Furthermore, the RSI has just moved above 50, which is also considered a sign of bullish momentum.
Finally, the movement between Jan 18 and Feb 18 resembles a double bottom, which is considered a bullish pattern.
Therefore, readings from the daily time-frame suggest that an upward movement towards $92 is likely.
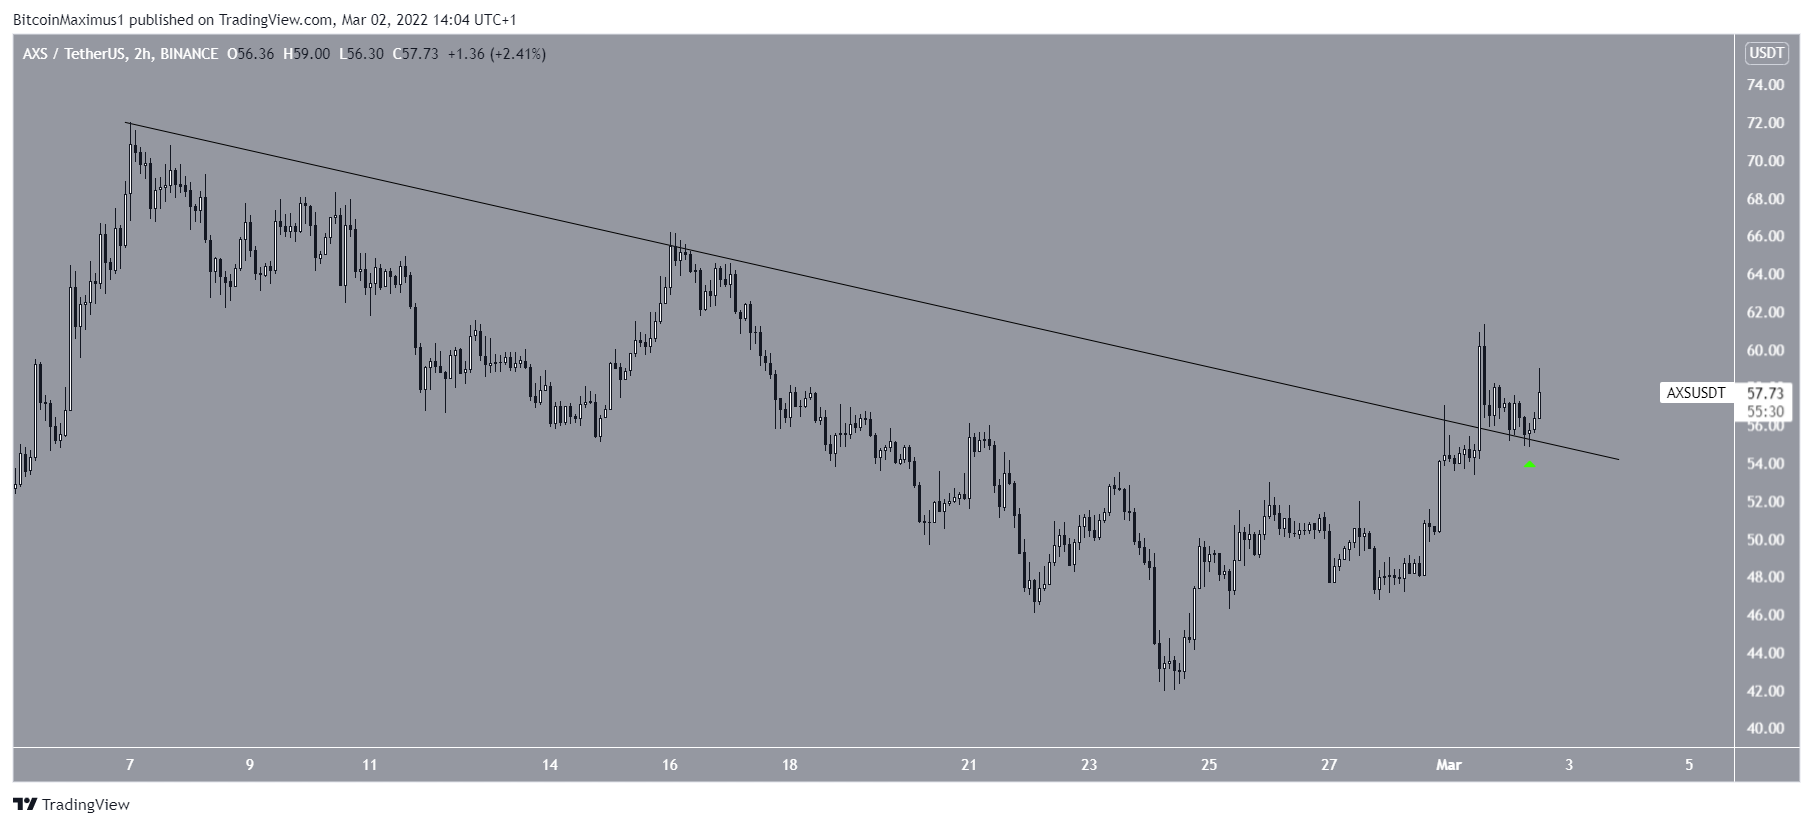
The two-hour chart supports this assessment, since it shows that AXS has broken out from another descending resistance line. Afterwards, it validated it as support on March 2.
Therefore, the daily and two-hour charts are in alignment, indicating that an upward movement is the most likely scenario.