
The Avalanche (AVAX) price has been moving upward since bouncing at the support line of a bullish pattern on Dec. 30. A breakout from it is the most likely forecast.
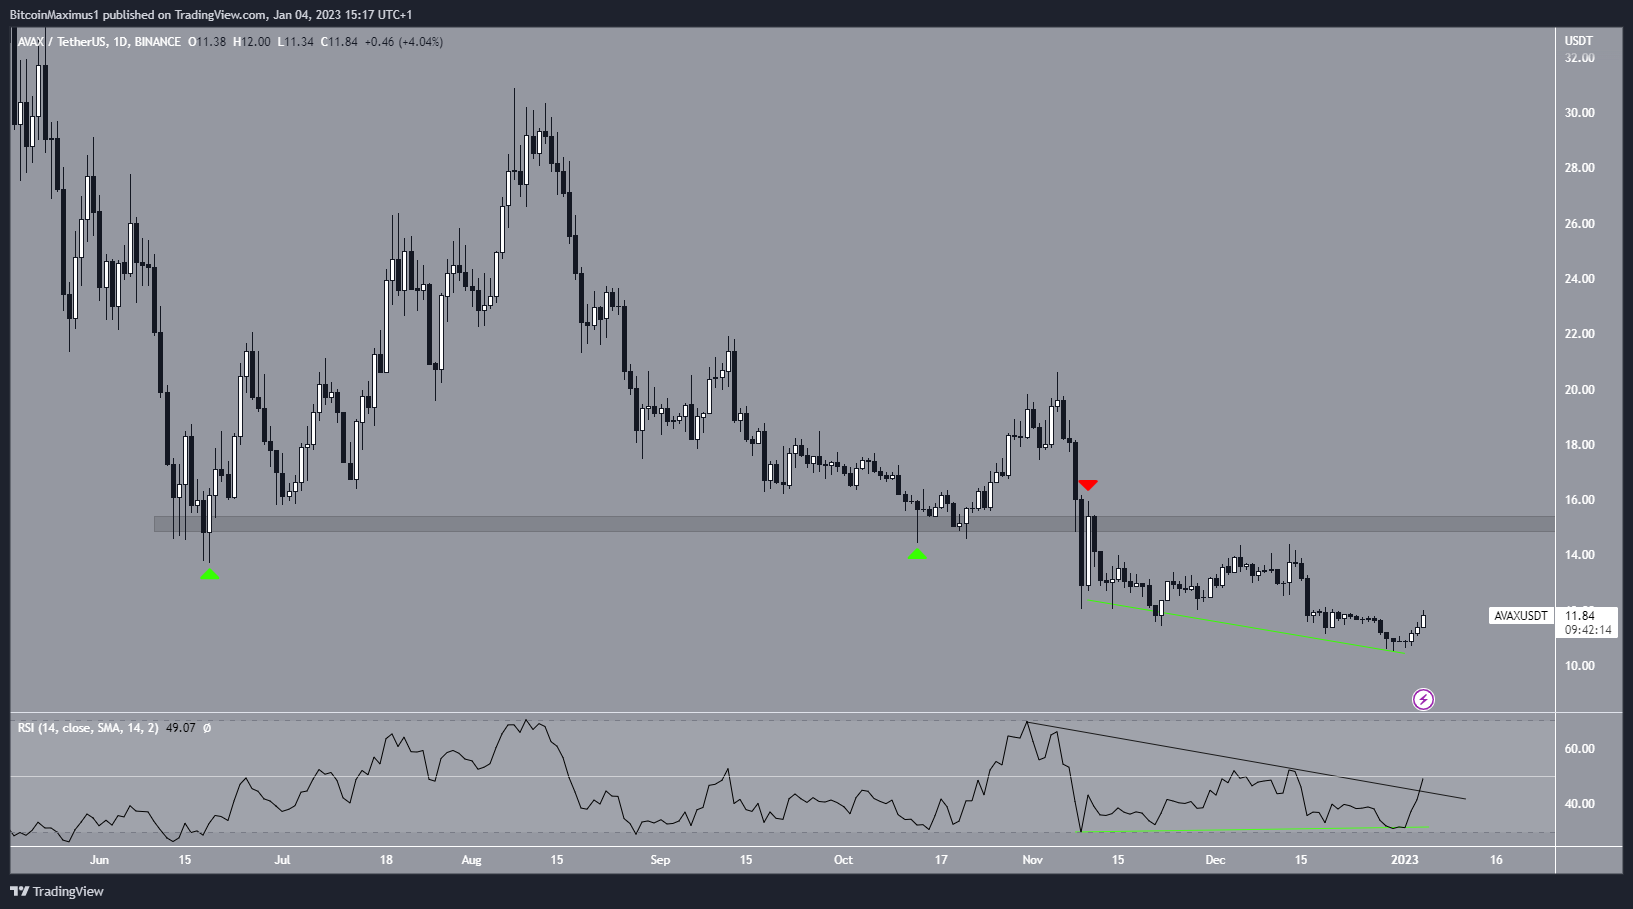
The AVAX price has decreased since reaching a high of $30.89 on Aug. 8, 2021. The downward movement led to a minimum price of $10.54 on Dec. 30. AVAX has been moving upward since.
During the decrease, AVAX fell below the horizontal support area of $15.20. Previously, the area had provided support twice (green icons) before turning to resistance on Nov. 10.
Despite the downward movement, technical indicators provide bullish signs that bode well for the future price. The daily RSI has generated bullish divergence for nearly two months (green line).
Moreover, RSI just broke out from a descending resistance line and has nearly moved above 50. These are considered signs of bullish trends and support an upward movement toward $15.20.
Nevertheless, the Avalanche price forecast cannot be considered bullish until the price moves above the $15.20 resistance area.
AVAX Price Prediction For Jan: Re-test of $15.20 Incoming
The short-term technical analysis of the six-hour time frame also supports the possibility that AVAX will move toward $15.20. The main reason for this is that the AVAX price is trading inside a descending wedge, which is considered a bullish pattern. The current upward movement began once the Avalanche price bounced at its support line (green line).
If a breakout from the wedge occurs, it will make the AVAX price prediction for Jan. bullish, supporting the continuation of the upward movement.
The top of the wedge and the 0.5 Fib retracement resistance level are at $15.60. This creates a cluster of resistance levels at an average price between $15.20-$15.60.
On the other hand, a fall below the Dec. 30 lows of $10.54 (red line) would invalidate this bullish AVAX price analysis and warn of new lows.
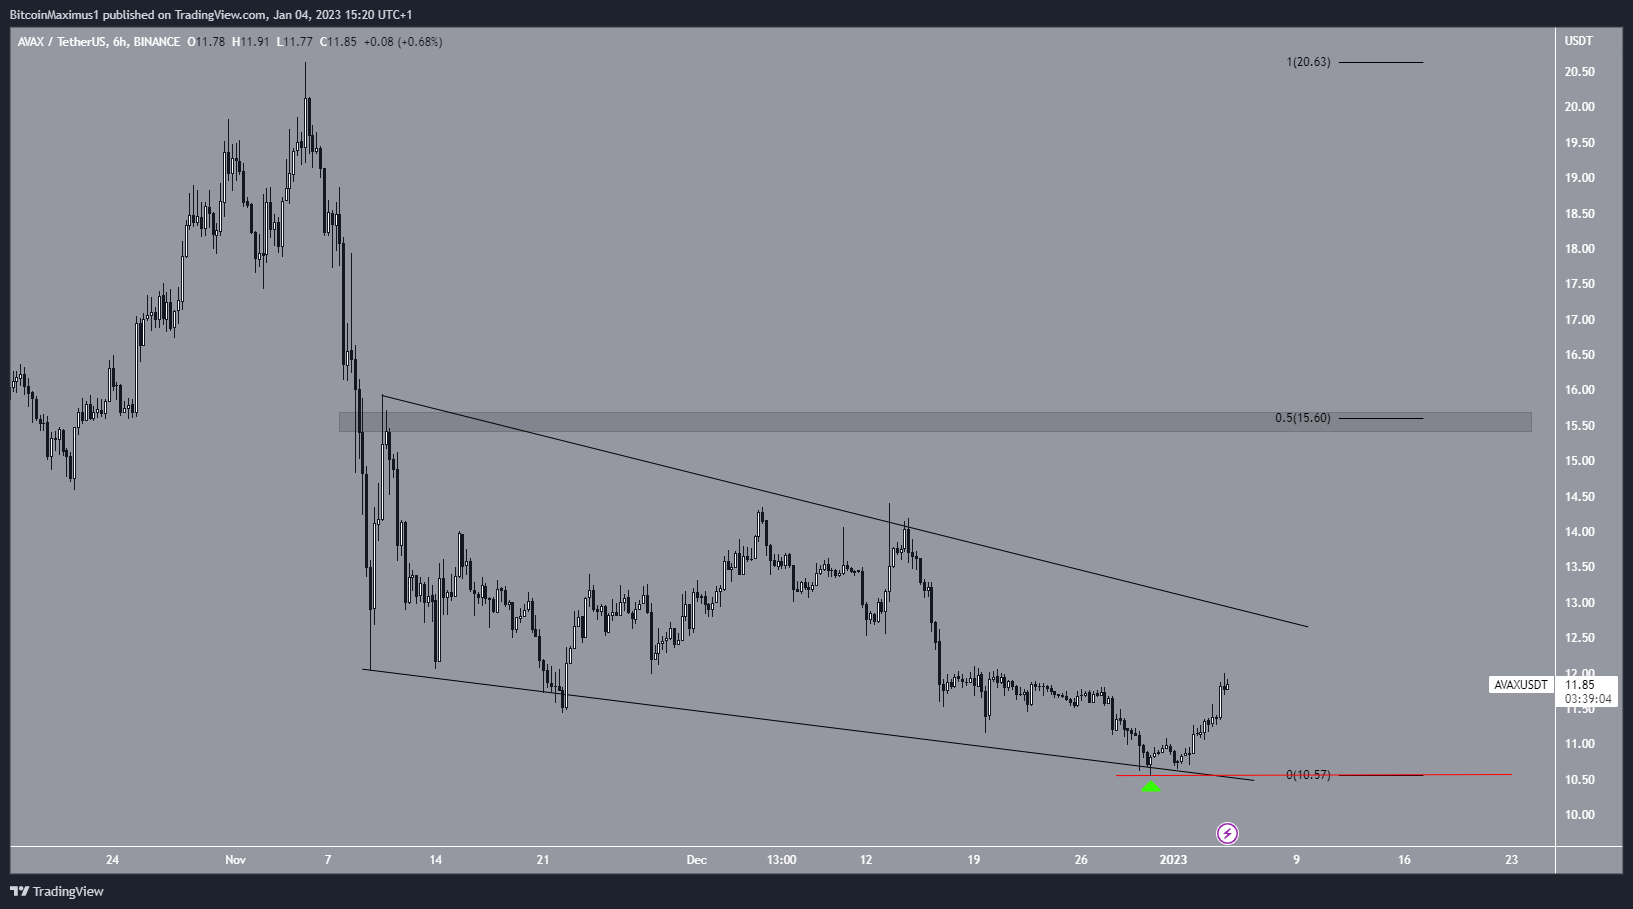
To conclude, the most likely future movement for AVAX is a breakout from the wedge and re-test of resistance at $15.20-$15.60. The future movement once the AVAX price gets there is unclear.
On the other hand, a drop below $10.56 would invalidate this bullish hypothesis.
For BeInCrypto’s latest crypto market analysis, click here.
