
The Avalanche (AVAX) price fell to a new yearly low on Nov. 21. It has nearly reached the final support area at $11.
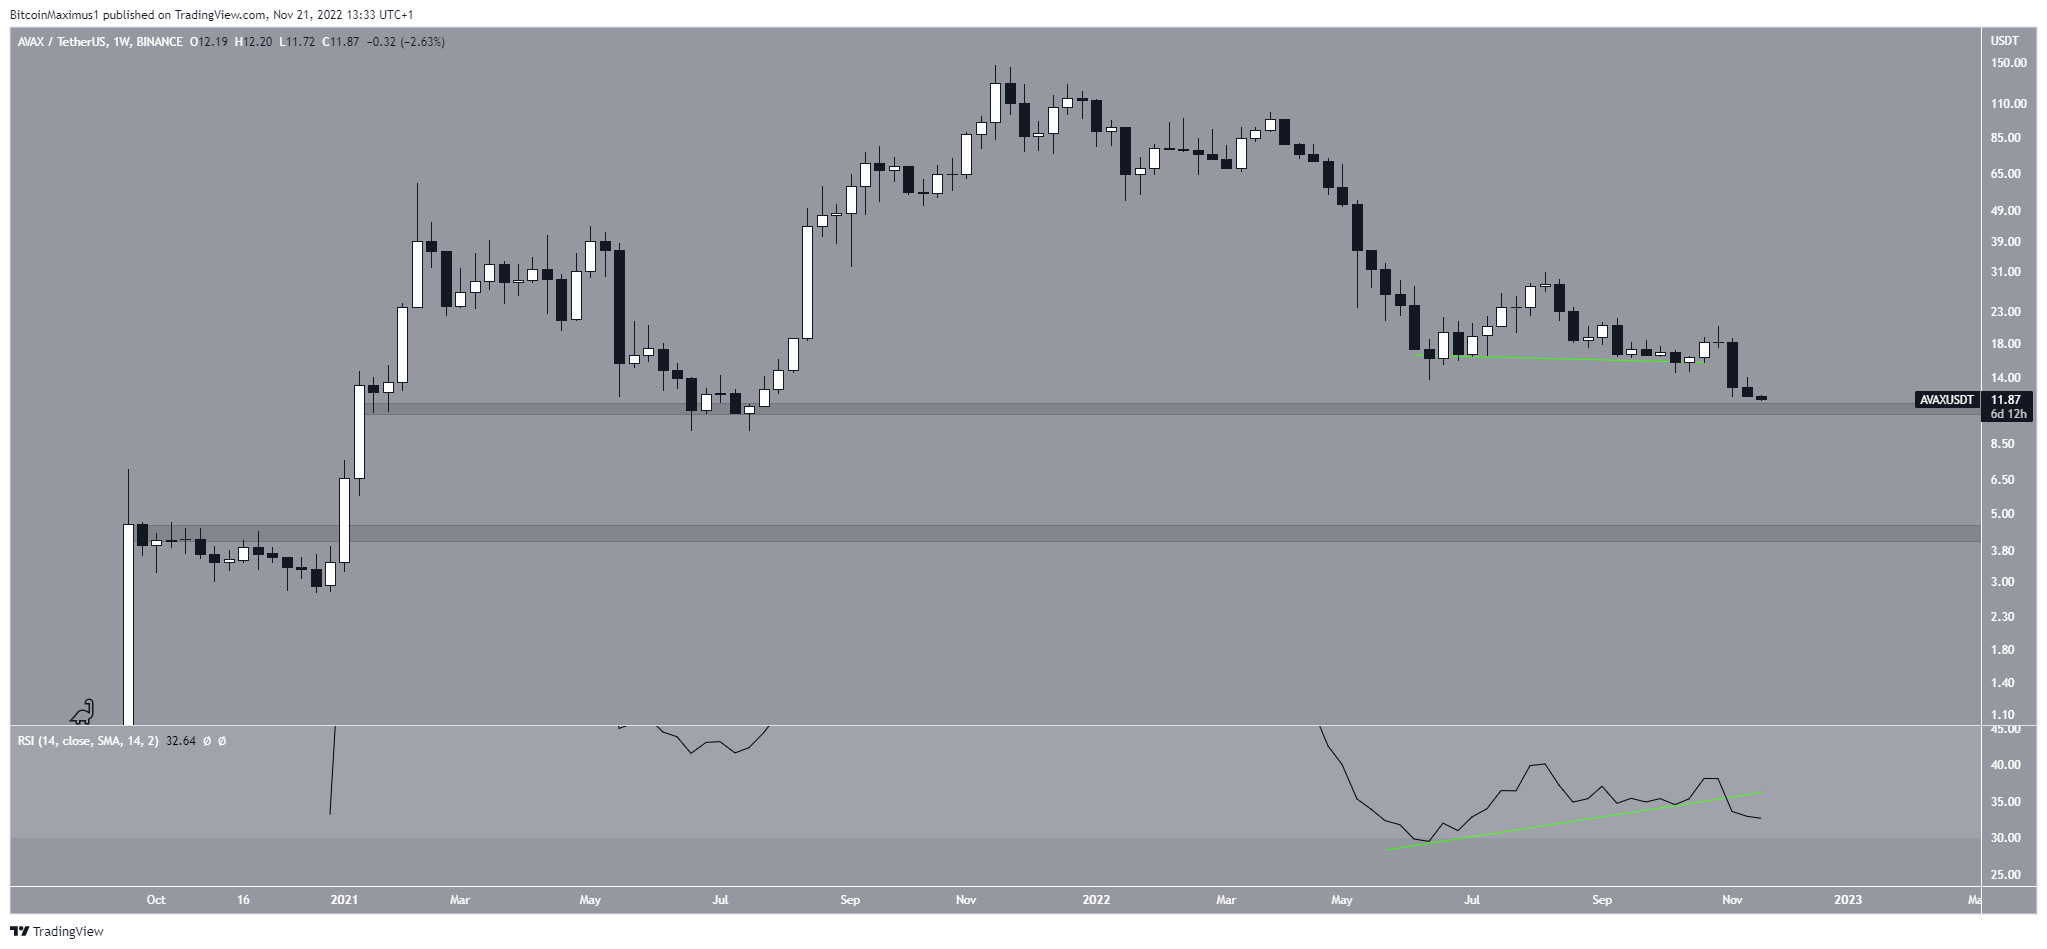
The technical analysis from the weekly time frame shows that the Avalanche price has decreased since reaching an all-time high of $147 in Nov. 2021. The downward movement led to a low of $11.72 in Nov. 2022.
The Avalanche price has nearly reached the main support area at $11. The area has been in place since the beginning of 2021.
The weekly RSI readings suggest that a breakdown will occur. The RSI has broken down from its bullish divergence trend line and is moving downwards. Such breakdowns usually precede price drops.
As a result, the most likely AVAX price prediction is a breakdown from the $11 area. If one occurs, the next support area would be at $4.20.
Avalanche Price Holds on Above Pattern Support
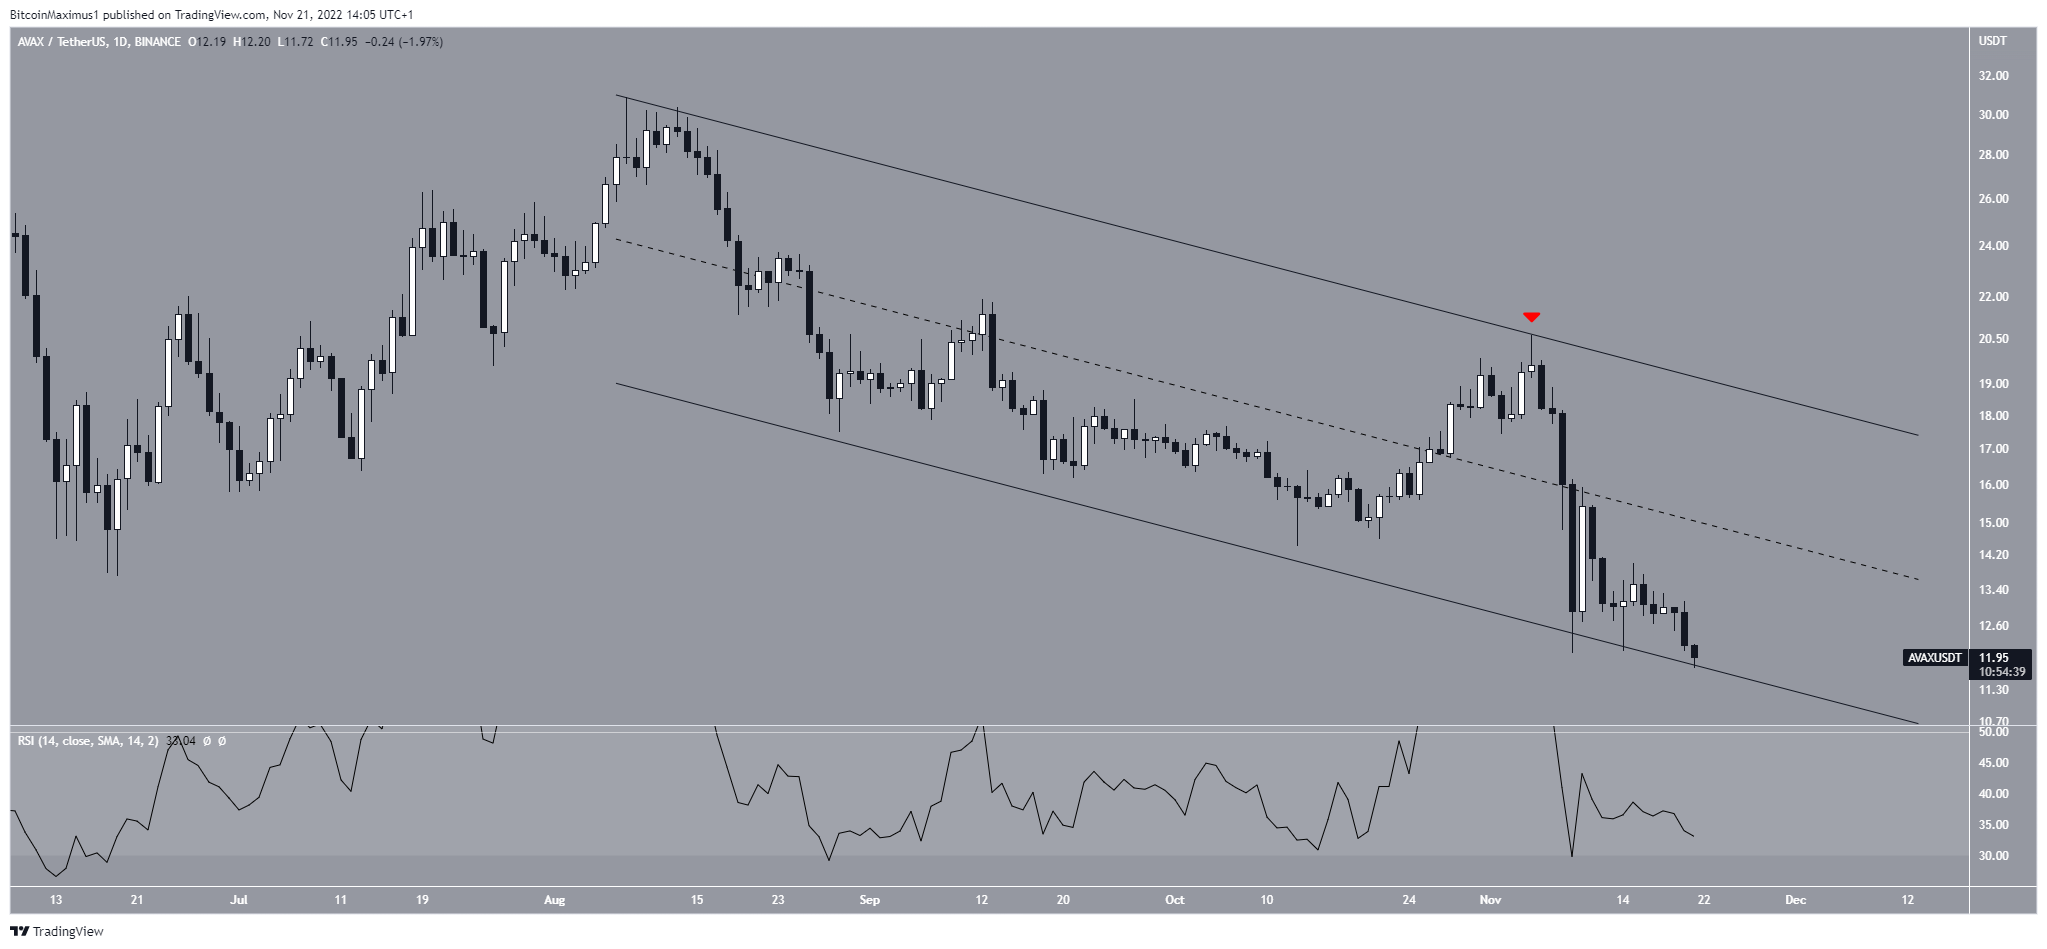
The price chart for the daily time frame gives a mixed Avalanche price prediction.
The Avalanche price has decreased inside a short-term descending parallel channel since the beginning of Aug. Such channels usually contain corrective movements, meaning that an eventual breakout from it would be expected.
However, the Avalanche price has moved downwards since the channel’s resistance line rejected it on Nov. 5 (red icon). Currently, it is trading very close to the channel’s support line, where it has been over the past 24 hours. A potential breakdown from the channel would not bode well for the future price.
The daily RSI has begun to generate bullish divergence but has yet to confirm it. Due to these mixed signs, the previously outlined bearish scenario is the most likely.
A movement above the channel’s middle is required for the Avalanche price trend to be considered bullish.
For BeInCrypto’s latest crypto market analysis, click here.
Disclaimer: BeInCrypto strives to provide accurate and up-to-date news and information, but it will not be responsible for any missing facts or inaccurate information. You comply and understand that you should use any of this information at your own risk. Cryptocurrencies are highly volatile financial assets, so research and make your own financial decisions.
