Avalanche (AVAX) has maintained an uptrend in the last week amid the broader market recovery. Trading at $28.78 at press time, the altcoin’s price has risen by 8% in the past seven days.
This uptick comes after an extended period of decline. For context, on July 3, AVAX’s value plummeted to an eight-month low of $24.45 before rebounding to log its most recent gains. However, despite this, AVAX’s whales continue to distribute their holdings.
Avalanche Whales Are Not Convinced
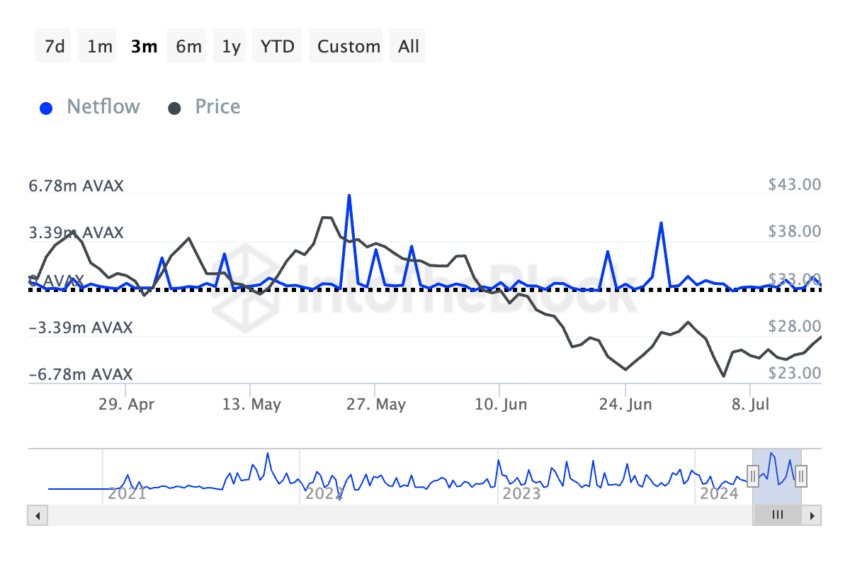
While AVAX’s value has increased by almost 10% in the last week, its large holder netflow has plummeted. According to IntoTheBlock’s data, it has dropped by 1.43% during that period. In the past 30 days, it has plunged by over 40%.
Large holders refer to addresses that hold over 0.1% of an asset’s circulating supply. An asset’s large holder netflow measures the difference between the coins these investors buy and the amount they sell over a specific period.

When an asset’s large holder netflow spikes, it signals that whale addresses are buying it. This is a bullish signal. On the other hand, when it declines, this cohort of investors are selling their holdings. It is a bearish signal, suggesting potential selling pressure and a risk of price decline.
Read More: How To Buy Avalanche (AVAX) and Everything You Need To Know
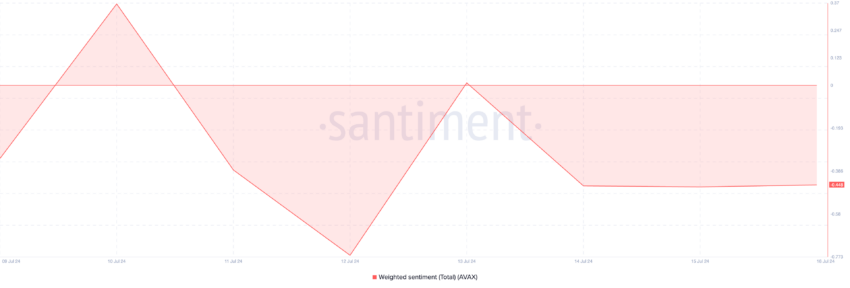
The whales’ move to sell may be due to the bearish sentiments plaguing AVAX despite the past week’s rally. Santiment’s data show that its weighted sentiment has remained negative in the past seven days. As of this writing, it is -0.48%.

This metric tracks the overall mood of the market regarding an asset. It considers the sentiment trailing the asset and the volume of social media discussions.
When it returns a negative value, the asset’s market is overwhelmed by negative sentiment, and its price is expected to fall.
AVAX Price Prediction: The Rally Might Be Here to Stay
Readings from some of AVAX’s key technical indicators observed on a one-day chart hint at the possibility of a sustained rally.
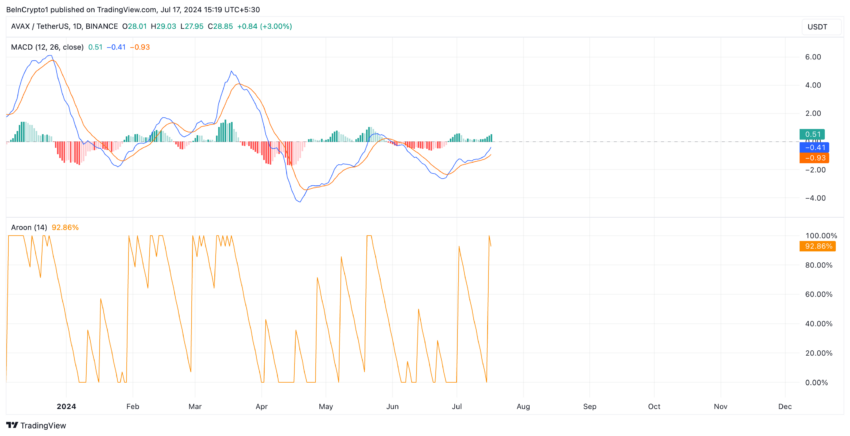
For example, its Aroon Indicator confirms that the current uptrend is strong. The token’s Aroon Up Line is at 92.86%. This indicator identifies an asset’s trend strength and potential price reversal points. When the Aroon Up line is close to 100, it indicates that the uptrend is strong and that the most recent high was reached relatively recently.
Further, AVAX’s Moving average convergence/divergence (MACD) shows that buying activity outweighs selling pressure in the market. As of this writing, the token’s MACD line (blue) rests above the signal line (orange) and trends toward the zero line.
When an asset’s MACD indicator is set up this way, its short-term momentum is higher than the long-term momentum, suggesting an upward trend. It is a bullish signal, and traders interpret it as a sign to go long.

AVAX will exchange hands at $32.09 if this current trend is maintained.
Read More: Avalanche (AVAX) Price Prediction 2024/2025/2030

However, if demand craters and selling pressure rises, the token’s price will drop to $21.80.
Disclaimer
In line with the Trust Project guidelines, this price analysis article is for informational purposes only and should not be considered financial or investment advice. BeInCrypto is committed to accurate, unbiased reporting, but market conditions are subject to change without notice. Always conduct your own research and consult with a professional before making any financial decisions. Please note that our Terms and Conditions, Privacy Policy, and Disclaimers have been updated.

