


The ATOM price has been trading inside a descending channel since Dec. 15, 2019. While the price bounced on its support line on March 1, it has yet to show clear signs of a reversal and a possible breakout.
Cosmos (ATOM) Price Highlights
- The price is trading inside a descending channel.
- It is facing resistance from the 200-day moving average (MA).
- The price broke out from a descending resistance line.
- There is resistance at 4,400 satoshis.
- ATOM is trading inside a short-term descending wedge.
Well-known margin trader @LSDinmycoffee tweeted an ATOM price chart, wondering if the previous breakout was just a deviation and the price is still trading inside the same descending wedge. Since the wedge is considered a bullish reversal pattern, a breakout would be expected in that case.
What if it was a deviation and the falling wedge is still valid.
Be careful though, it lost dma200 and it's turning into a resistance.
I'm not buying here. pic.twitter.com/zJljbPfOOL
— krillin ॐ (@LSDinmycoffee) March 6, 2020
Is the ATOM price trading inside a descending wedge? If yes, when will it break out? Continue reading below if you are interested in finding out.
Descending Channel
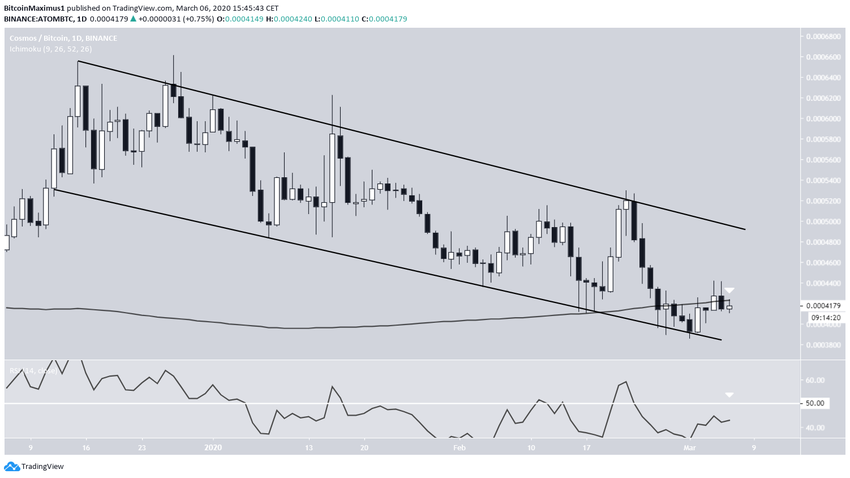
The price movement since Dec. 15, 2019 looks more like a descending channel than descending wedge, as is outlined in the tweet. Both the resistance and support areas have been validated numerous times and the lines are parallel to teach other, making this the most credible pattern.
Even though the price bounced on the support line, technical indicators give a bearish picture. The price is trading below the 200-day moving average (MA), having validated it as resistance. In addition, the daily RSI is way below 50, indicative that the price is in a bearish trend.
Future Movement
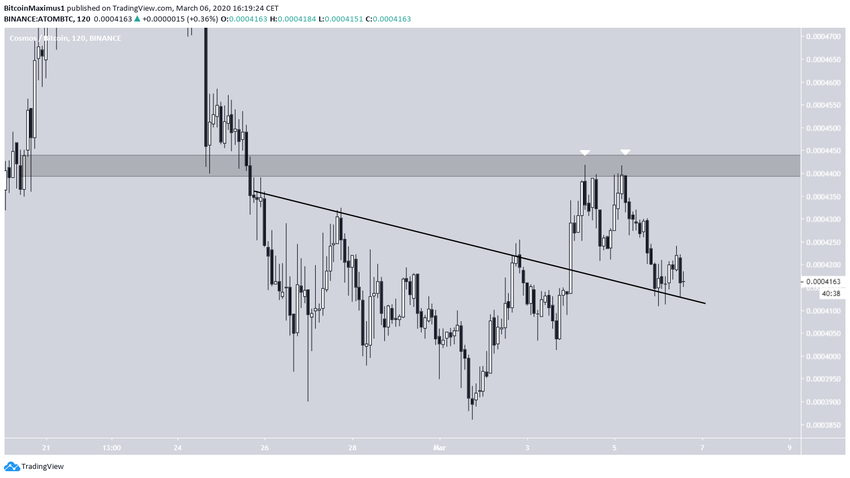
The short-term movement provides a bullish outlook. The price has broken out from a descending resistance line and validated it as support afterward.
The closest resistance area is found at 4,400 satoshis, where the price has made a double top prior to decreasing and validating the resistance line.
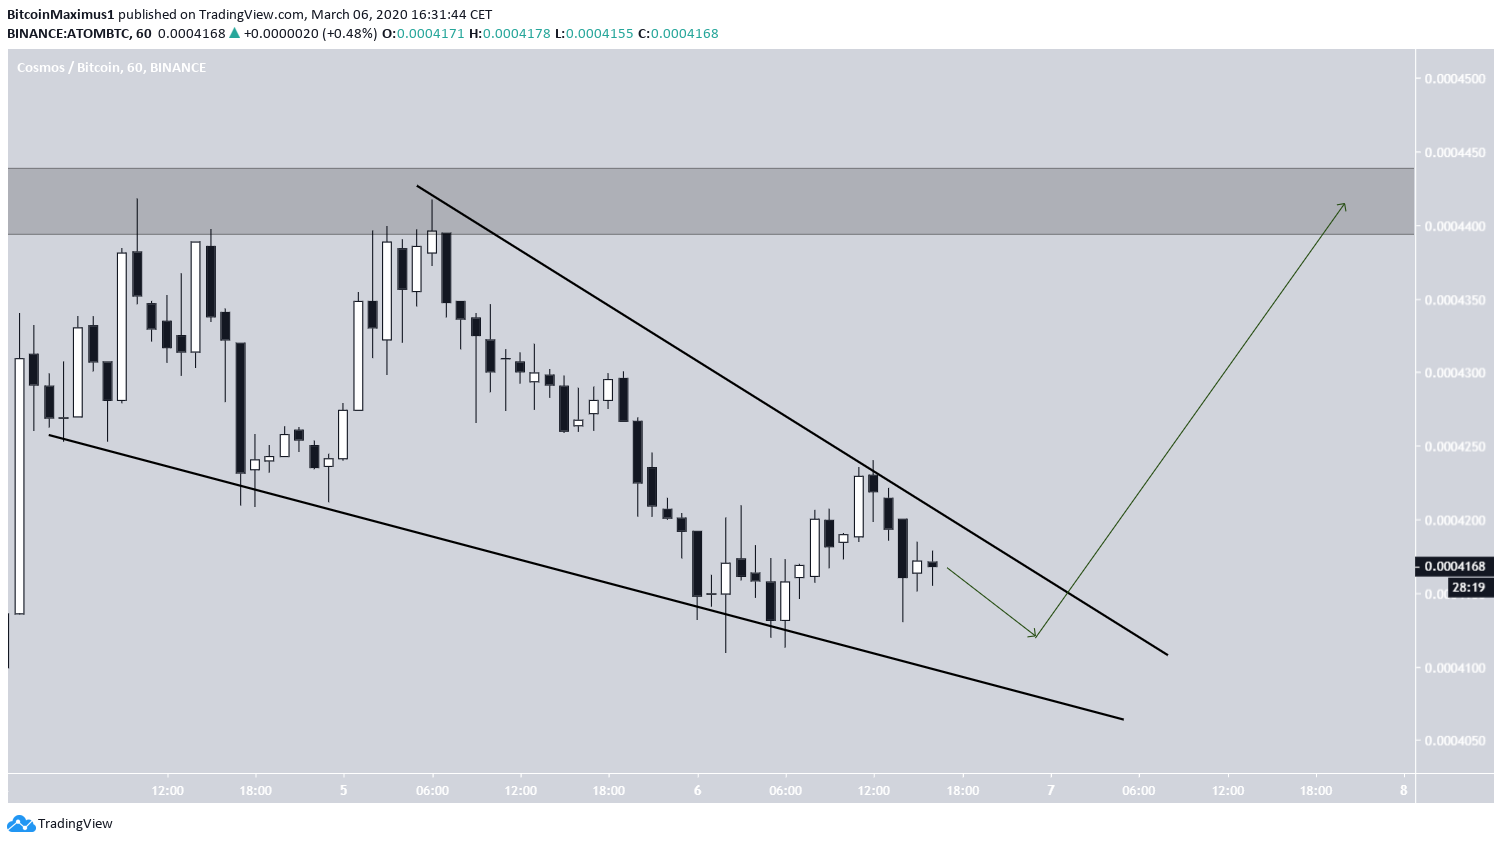
The hourly chart indicates that the price is expected to make another attempt at moving above this resistance area, considering it is also trading inside a short-term descending wedge, which is considered a bullish reversal pattern.
Therefore, this confluence of bullish signs is indicative of a future breakout. While the breakout could eventually take the price to the resistance line of the descending channel, we cannot at the current time confidently predict whether the price will break out from the channel or not.
To conclude, the ATOM price is trading inside a longer-term descending channel and a short-term descending wedge. We are expecting it to break out from the wedge and reach the resistance area outlined above and possibly the resistance line of the channel.


