

The Cosmos (ATOM) price is trading inside a symmetrical triangle, from which a breakout is expected.
UMA (UMA) has bounced at the $19 support area and has broken out from a descending resistance line afterward.
Loopring (LRC) is trading inside a parallel ascending channel, from which a breakdown is expected.
Cosmos (ATOM)
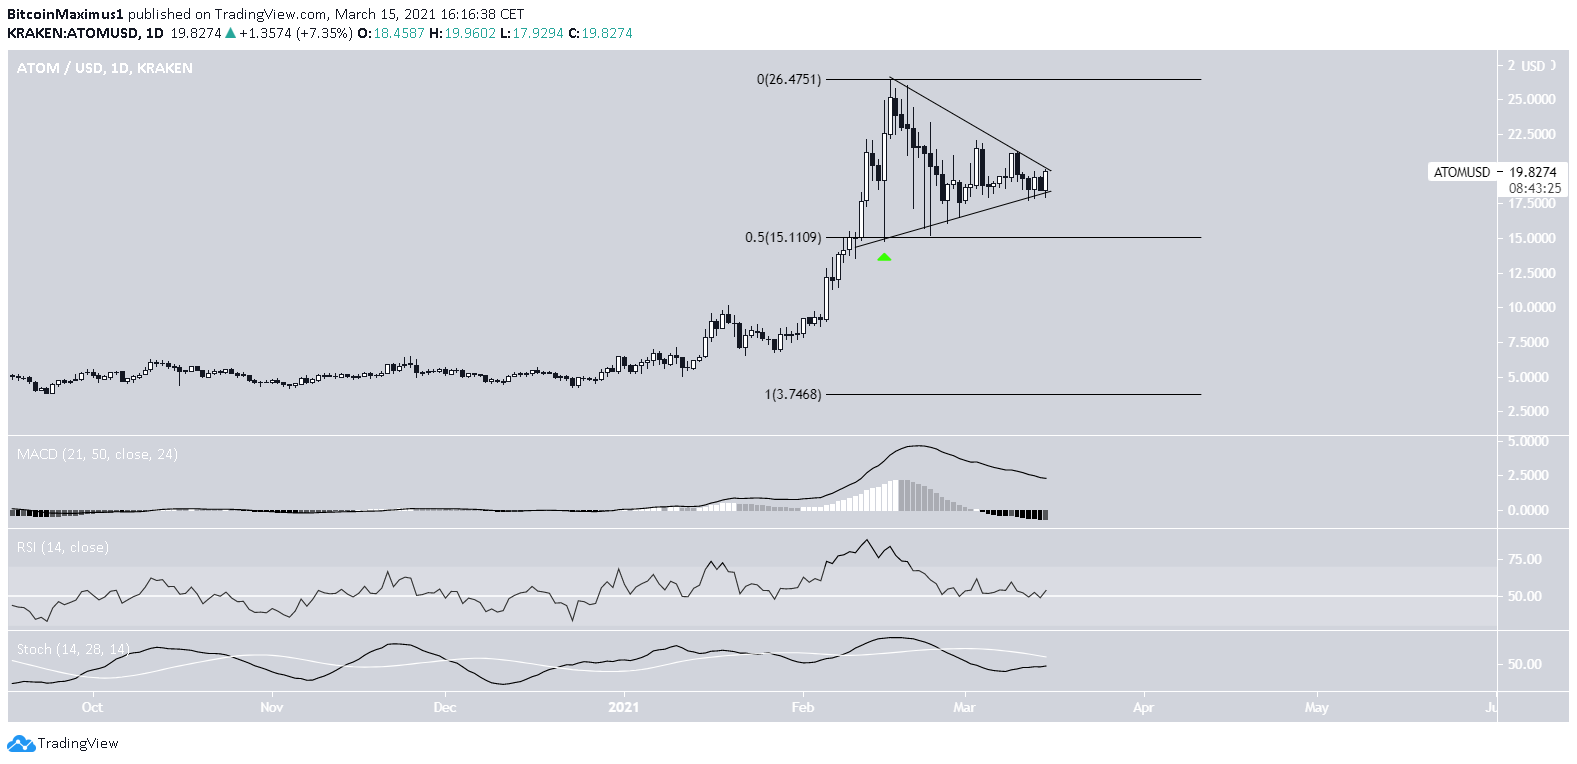
ATOM has been decreasing since Feb. 16, when it reached an all-time high price of $26.47.
The decrease stopped once ATOM reached the 0.5 Fib retracement level. This caused a bounce and left a long lower wick in place.
Since then, ATOM has been trading inside a symmetrical triangle. Currently, it is approaching the point of convergence between resistance and support. Therefore, a decisive movement is expected.
However, the symmetrical triangle is a neutral pattern.
In addition, technical indicators are neutral. Therefore, a look at lower time-frames is required in order to determine the direction of the breakout.
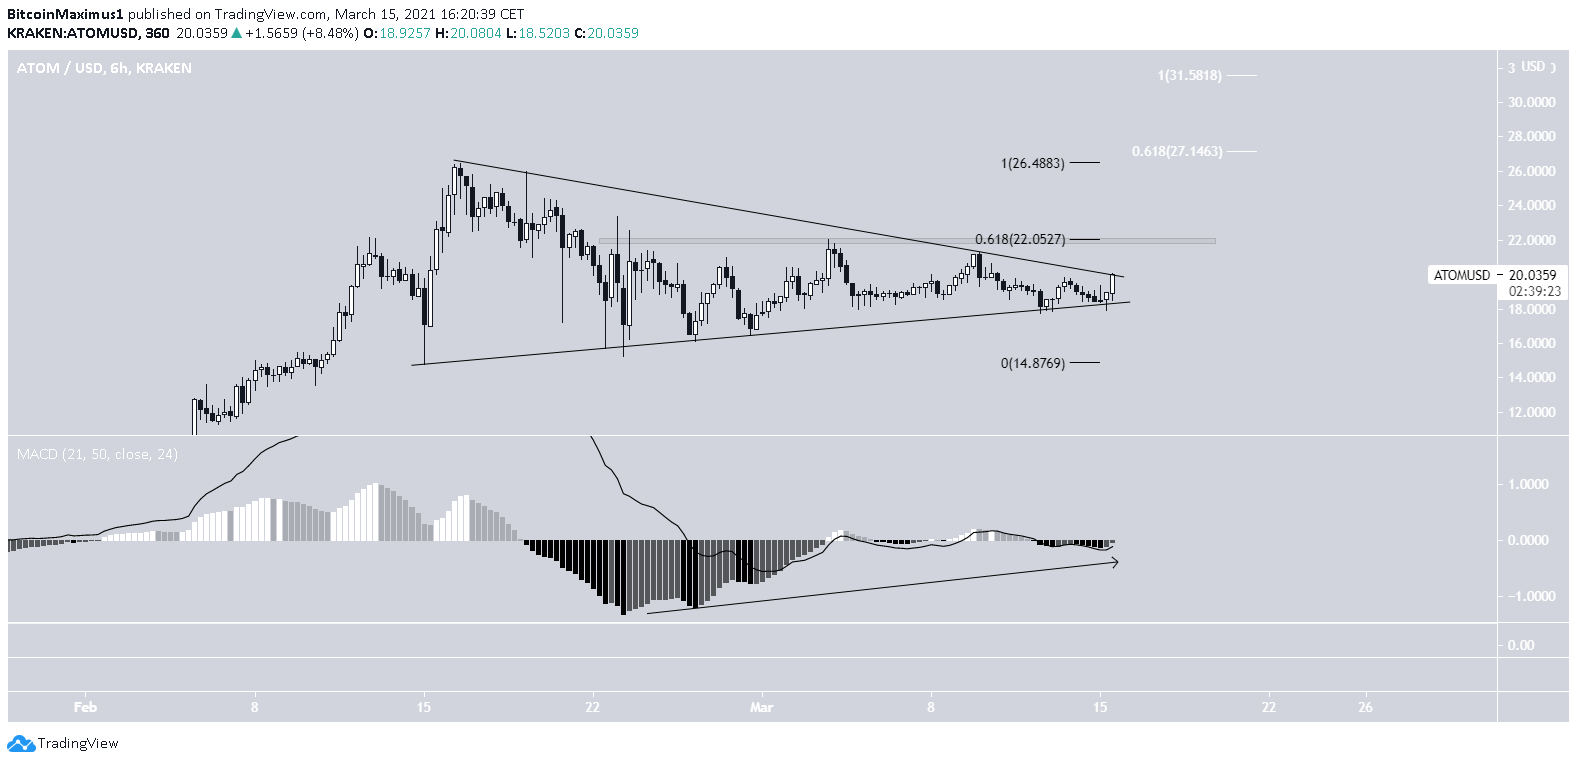
The six-hour chart is bullish.
The MACD supports the possibility of the breakout, having nearly crossed positive.
Once ATOM breaks out, the next closest resistance area is $22, followed by $26.50.
Projecting the length of the triangle gives us two possible targets. The first one is at $27, coinciding with the Feb. highs, while the next one is $31.50.
Highlights
- ATOM is trading inside a symmetrical triangle.
- There is resistance at $22 and $27.
UMA (UMA)
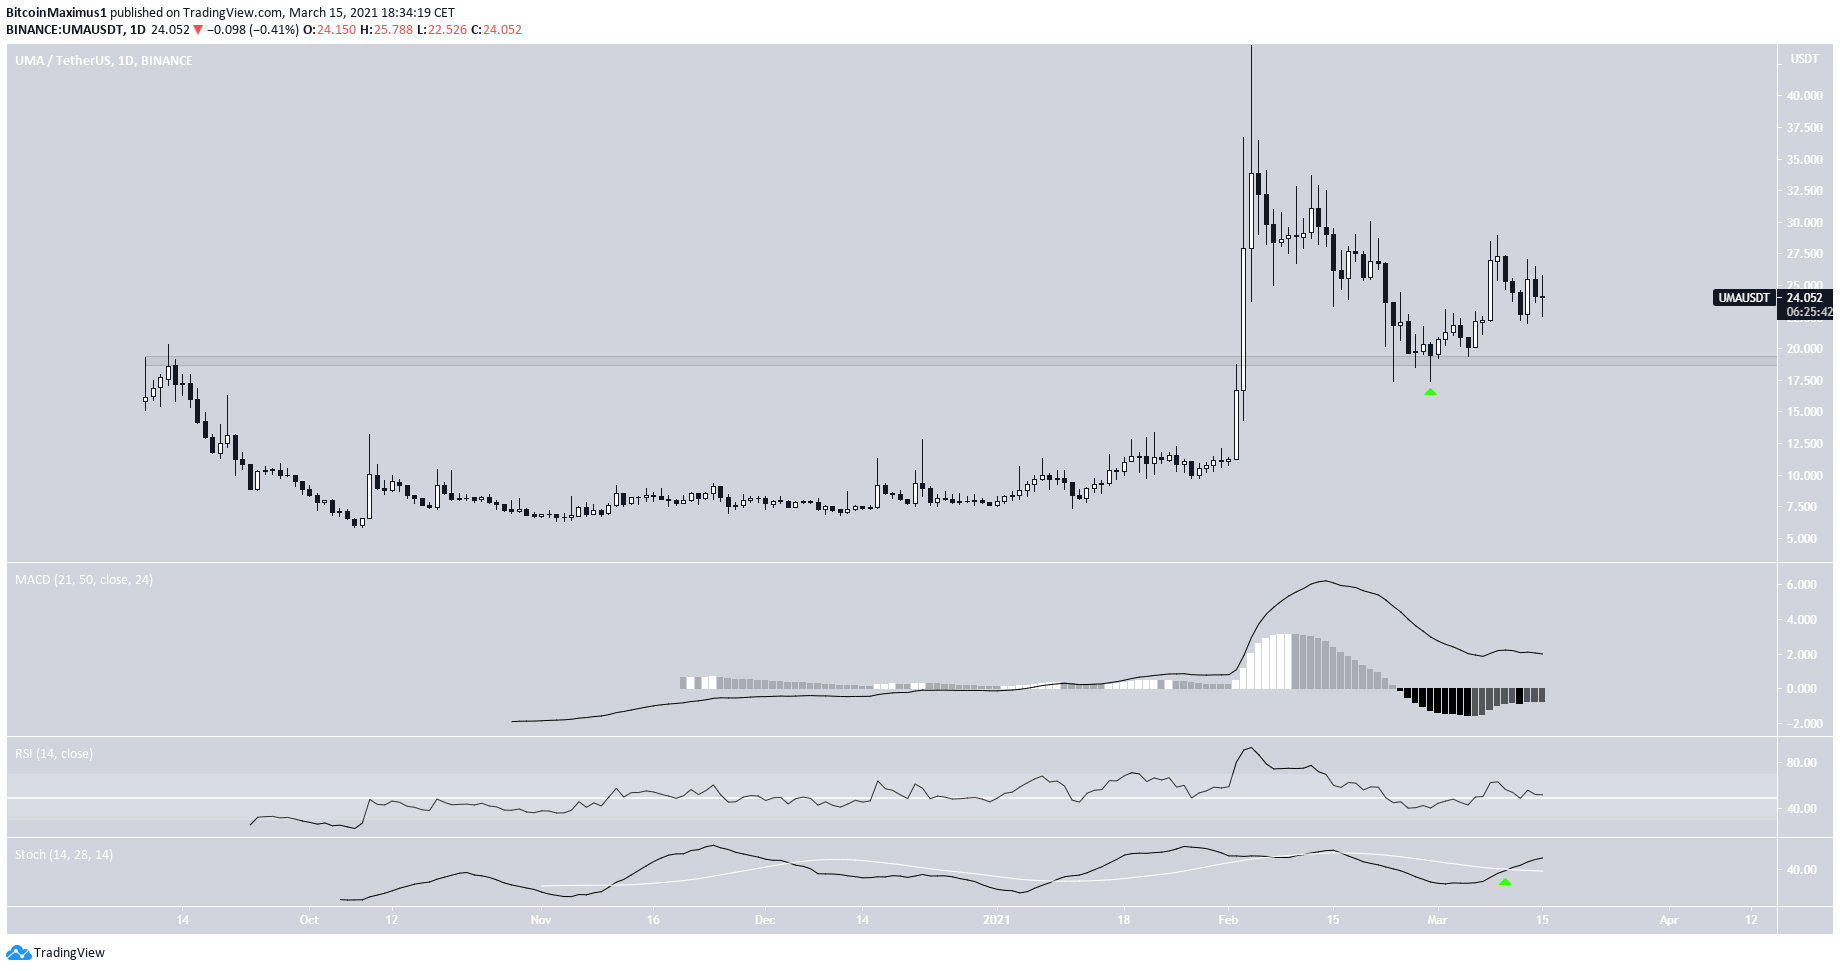
On Feb. 4, UMA reached an all-time high price of $43.99. However, it began a downward move almost immediately afterward, which took it back to the $19 support area, where it bounced.
Currently, UMA is trading at $24.
Technical indicators are bullish. The Stochastic oscillator has made a bullish cross, and the MACD has given a bullish reversal signal.
While the RSI is steady, it is above 50, a sign of a bullish trend.
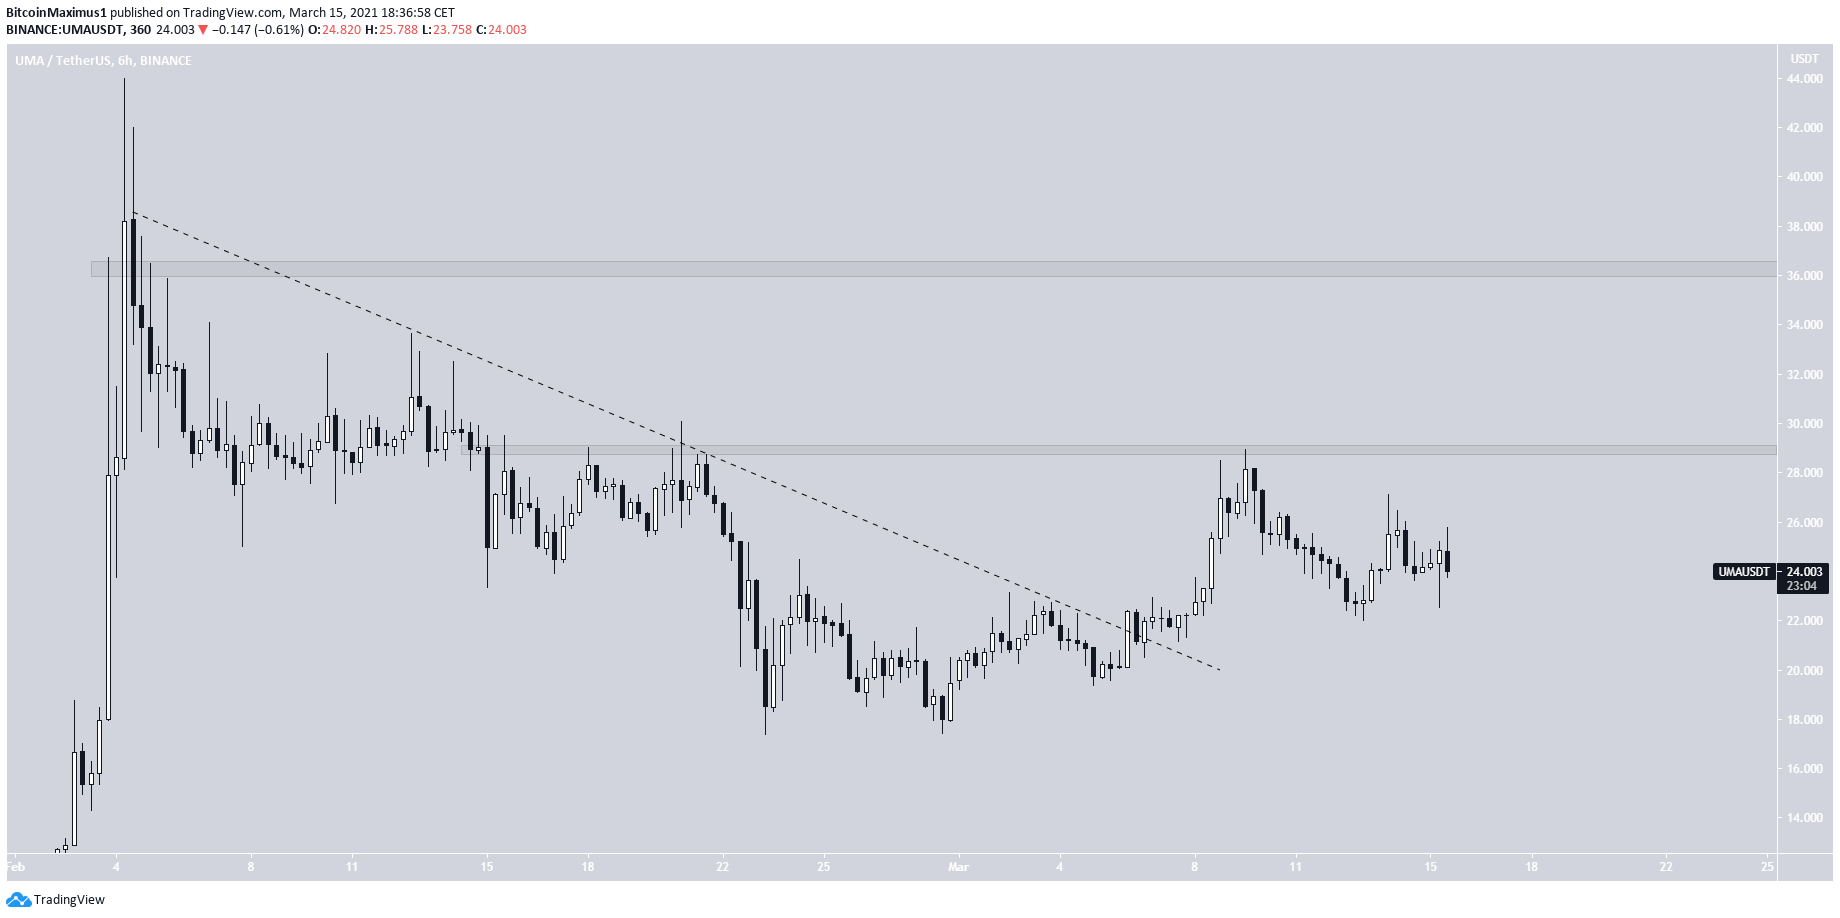
The shorter-term chart shows a breakout from a descending resistance line.
Also, it provides two resistance areas, found at $29 and $36, respectively.
UMA is expected to reach the $29 area and potentially break out towards $36.
Highlights
- UMA has bounced at the $19 support area.
- It has broken out from a descending resistance line.
Loopring (LRC)
LRC has been decreasing since Feb. 12, when it was trading at a high of $0.88. So far, the decrease has taken it to a low of $0.45, doing so on Feb. 23.
While LRC has bounced since the increase does not look impulsive, on the contrary, the parallel channel in which it is trading looks corrective.
Both the RSI & MACD are decreasing, also indicating that the trend is bearish.
Therefore, a breakdown from the channel would be the most likely option.
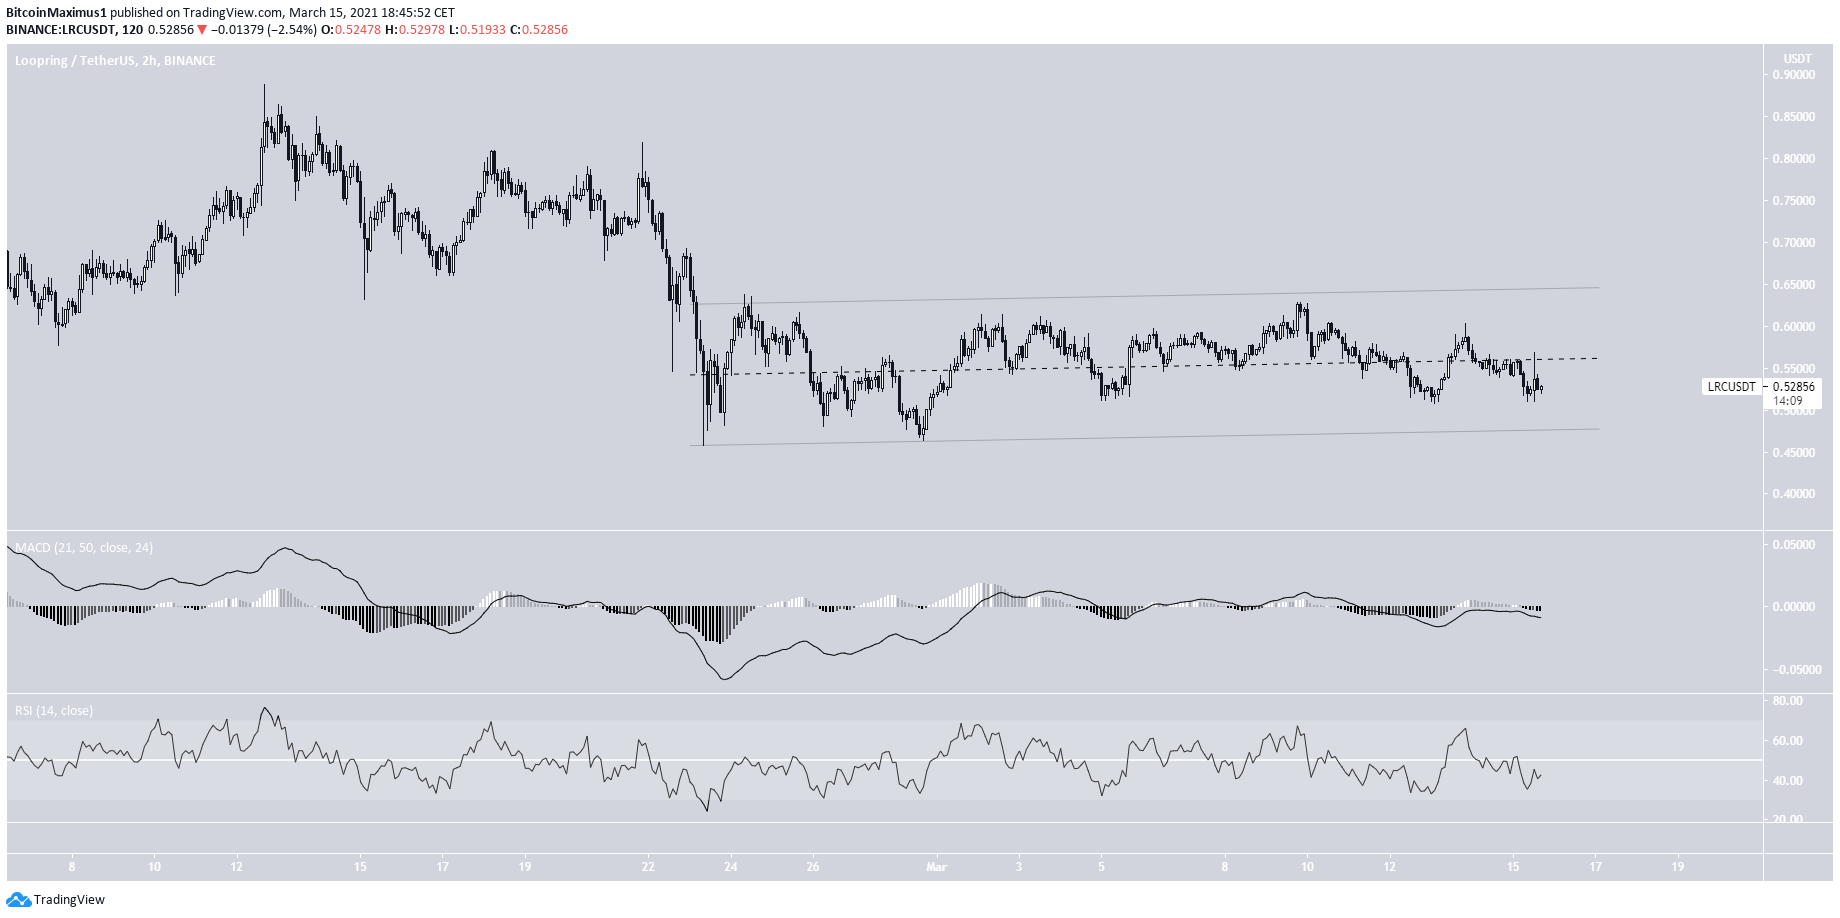
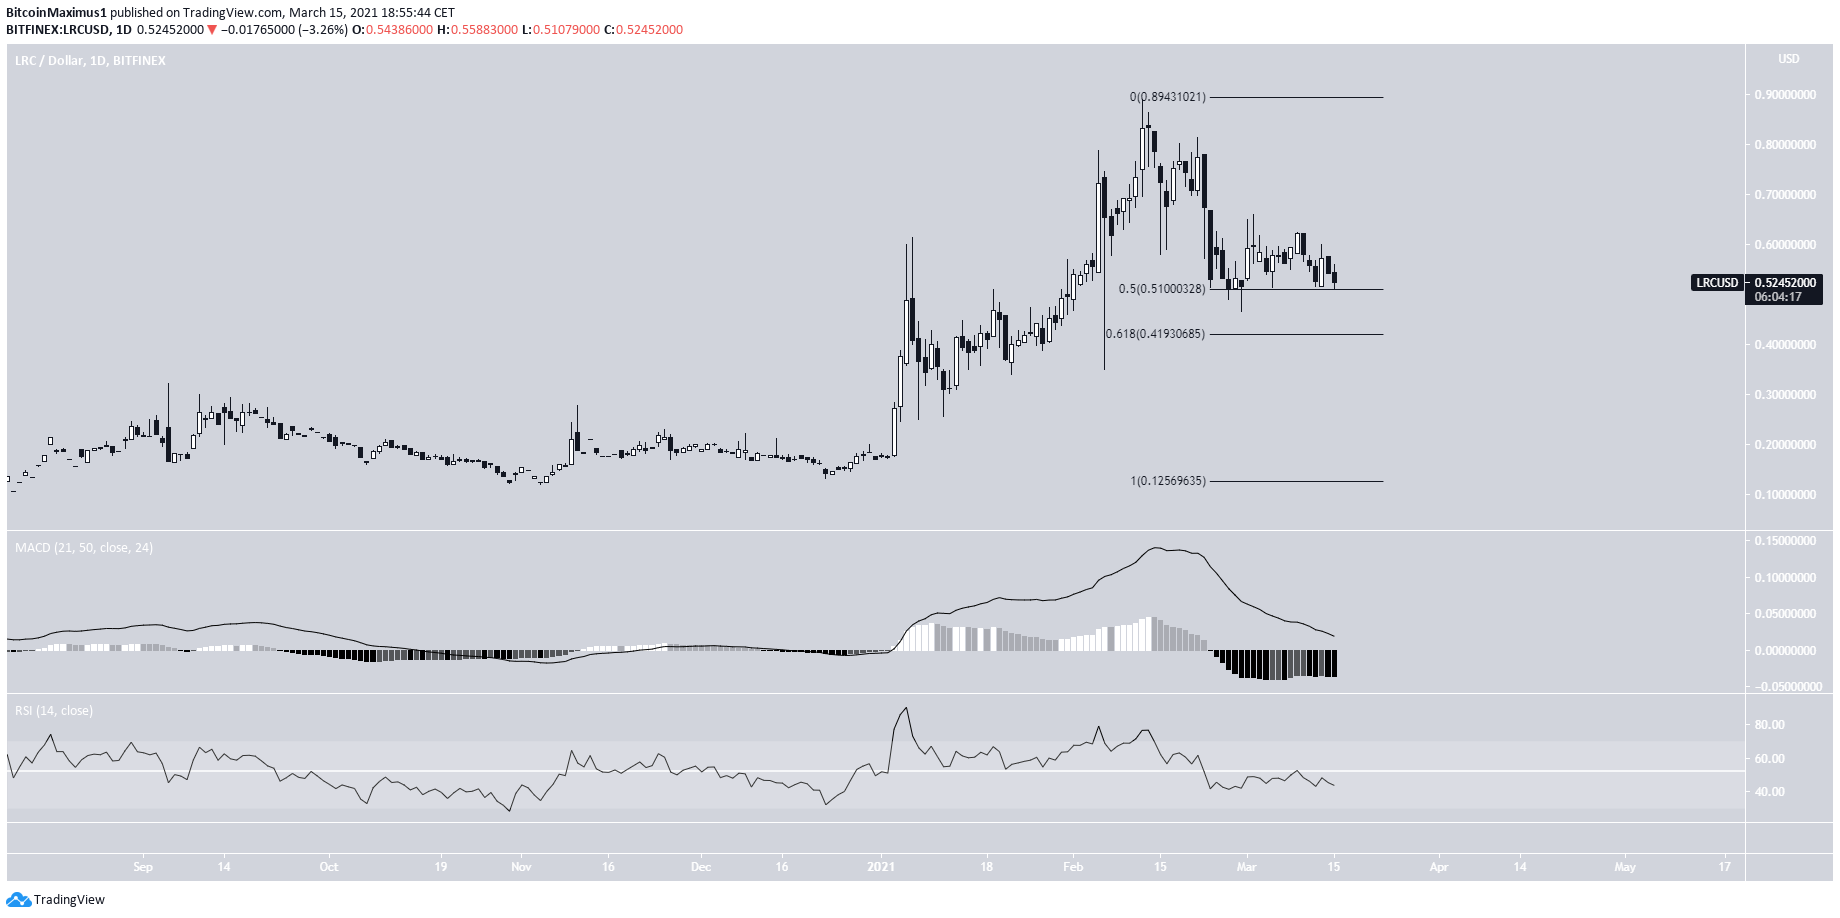
If a breakdown occurs, the next closest support area would be found at $0.42, the 0.618 Fib retracement level of the most recent upward movement.
Indicators in the daily time-frame support this possibility since both the MACD & RSI are decreasing.
Highlights
- LRC is trading inside a short-term parallel ascending channel.
- There is support at $0.51 and $0.42.
For BeInCrypto’s latest Bitcoin (BTC) analysis, click here.
Disclaimer
In line with the Trust Project guidelines, this price analysis article is for informational purposes only and should not be considered financial or investment advice. BeInCrypto is committed to accurate, unbiased reporting, but market conditions are subject to change without notice. Always conduct your own research and consult with a professional before making any financial decisions. Please note that our Terms and Conditions, Privacy Policy, and Disclaimers have been updated.
