


![As the Bitcoin Dominance Rate Decreases, Will Altseason Begin? [Premium Analysis]](/_mfes/post/_next/image/?url=https%3A%2F%2Fassets.beincrypto.com%2Fimg%2F0ZpLdReKINk0qV0_d7u25AmpWIA%3D%2Fsmart%2F97f4ef7ae85747eab49828db237c2714&w=1920&q=75)
The Bitcoin dominance rate reached a high of 70.86% on January 8. It has been decreasing since.
Highlights
- The Bitcoin dominance rate broke down below an ascending support line.
- The 100- and 200-day moving averages (MA) have made a bearish cross.
- There is resistance at 71%.
- There is support at 63 and 61%.
- The rate has created a short-term descending triangle.
Well-known trader CryptoAmsterdam (@damskotrades) posted a Bitcoin dominance price chart. He stated that he believes that if we have a candle close below 67%, we could head down to at least 61%.
$BTC Dom
Closes below red and I’m leaning to a Beautiful way down $ALTS pic.twitter.com/1YThisZs1V— CryptoAmsterdam (@damskotrades) January 20, 2020
Let’s take a closer look at the dominance chart and try to outline its future movement.
Bitcoin Trendline Breakdown
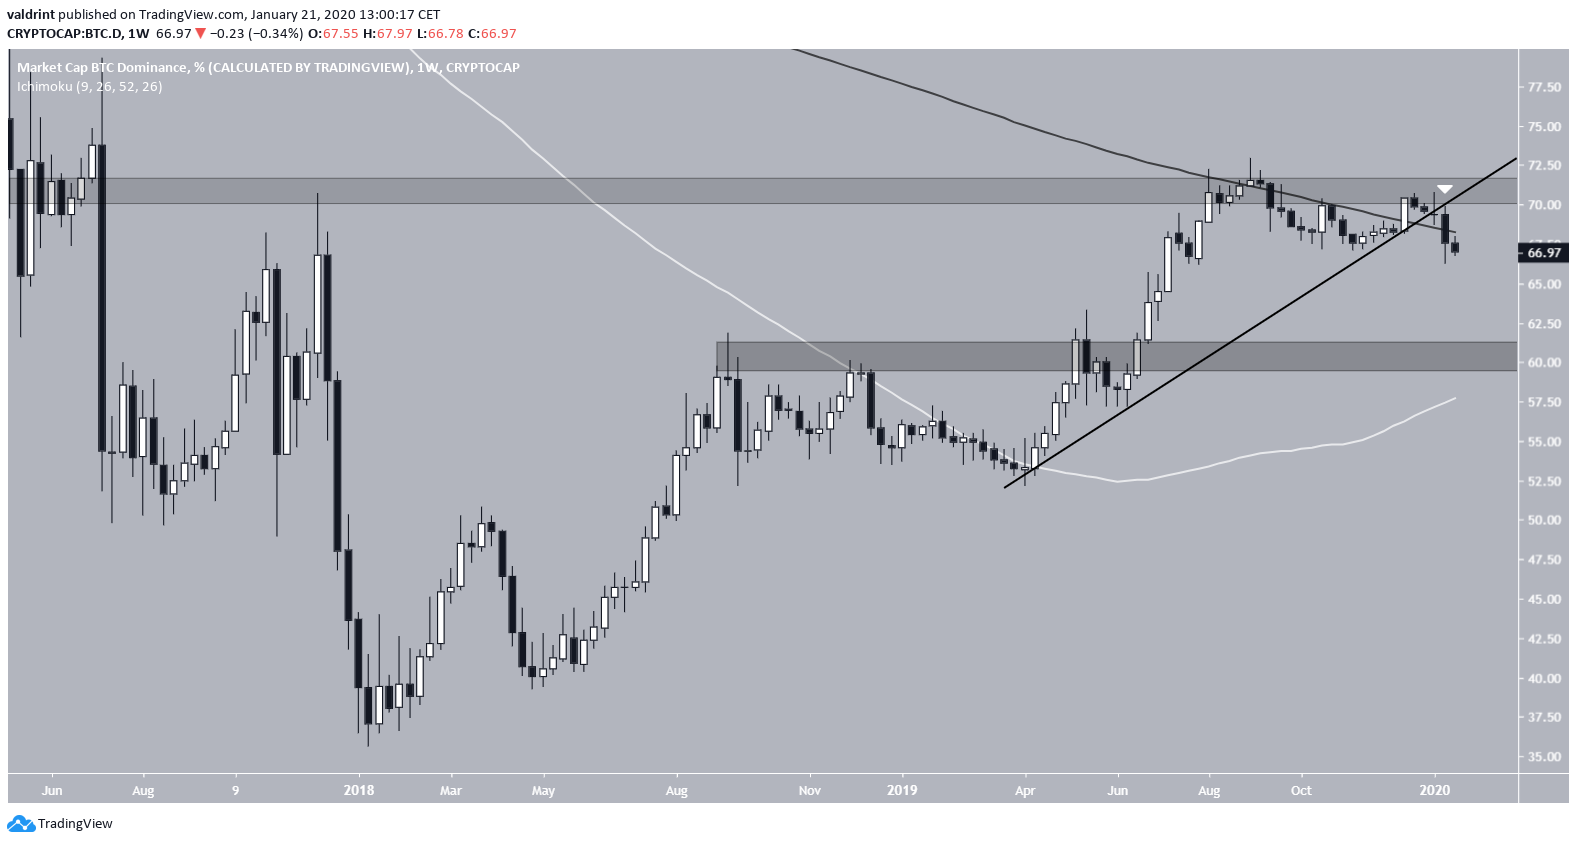
The Bitcoin dominance rate had been following an ascending support line since April 2019. The price reached the 70-72% resistance area, which was supported by the 200-week moving average (MA) and broke down.
The area most probable to provide support is found above 60%, as outlined in the tweet. It is supported by the 100-week MA.
Descending Support Line
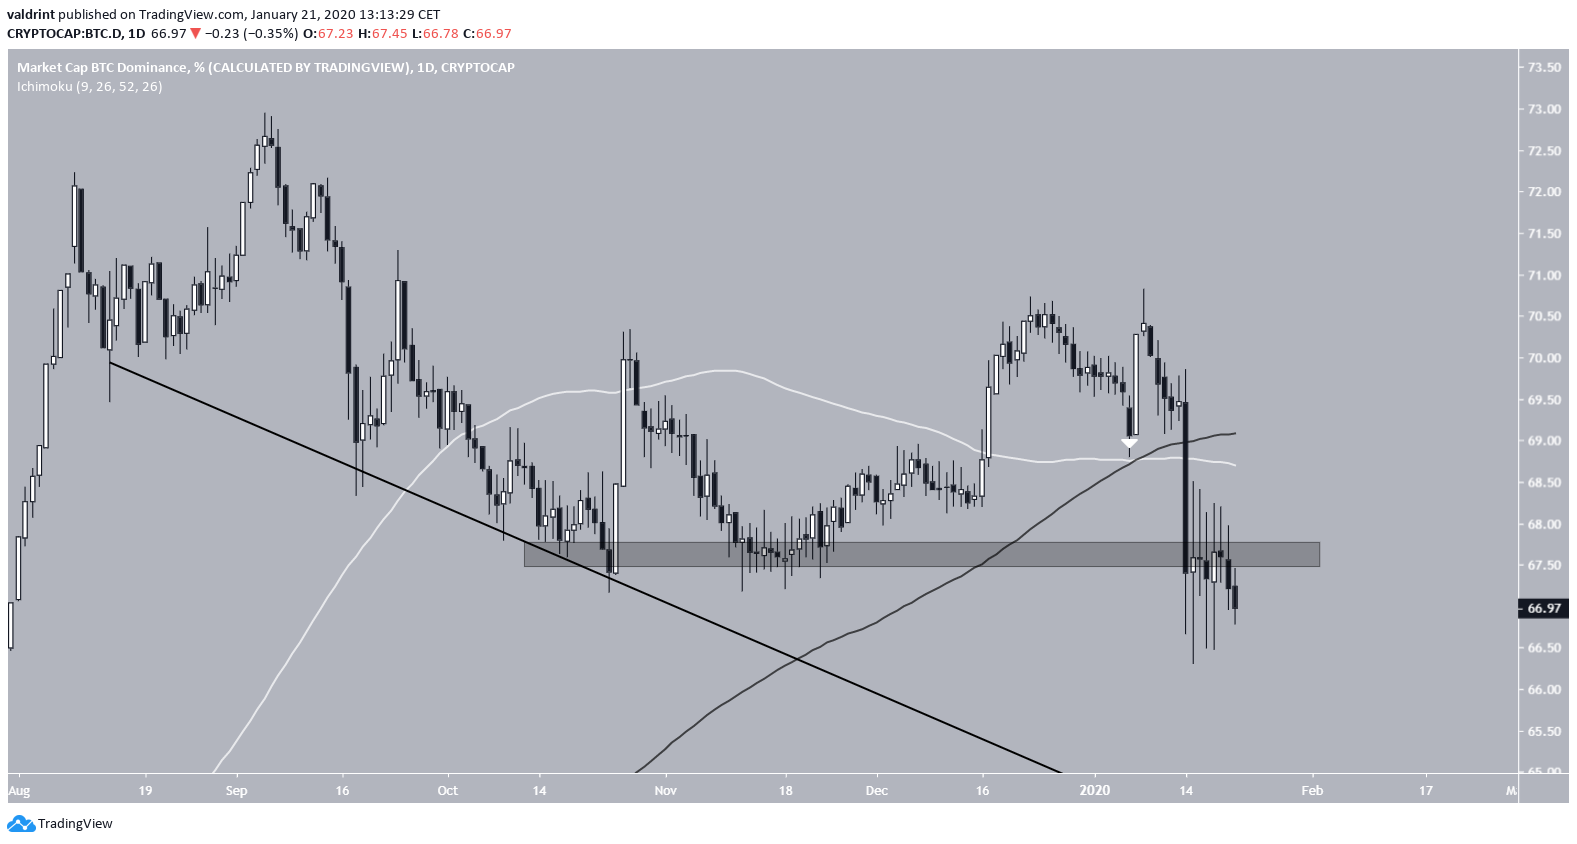
Looking at the daily chart, we can see a possible descending support line in place since August 18, which at the current time is at 64%.
There are two bearish developments:
- The 100- and 200-day moving averages (MA) have made a bearish cross and the price is trading below both.
- The price has fallen below the 67.5% minor support area and validated it as resistance several times in the form of long upper wicks.
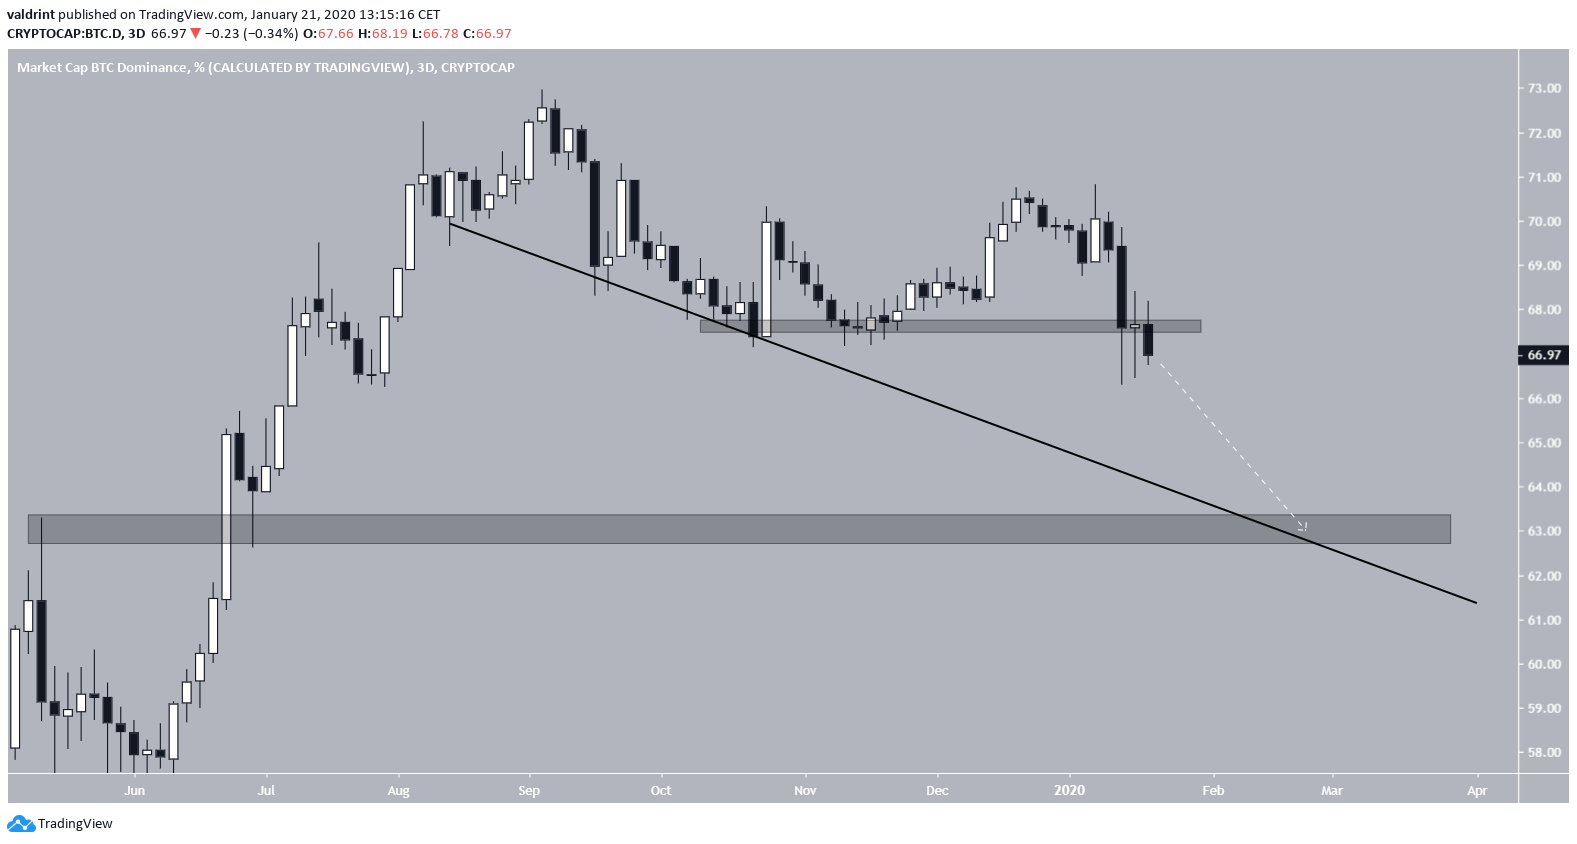
If the price were to decrease at the rate predicted by the descending support line, it would be likely to reach it at the beginning of March, when it would coincide with the 63% support area.
Therefore, while we believe the Bitcoin dominance rate will go down, we do not think the rate of decrease will be as abrupt as the one outlined in the tweet.
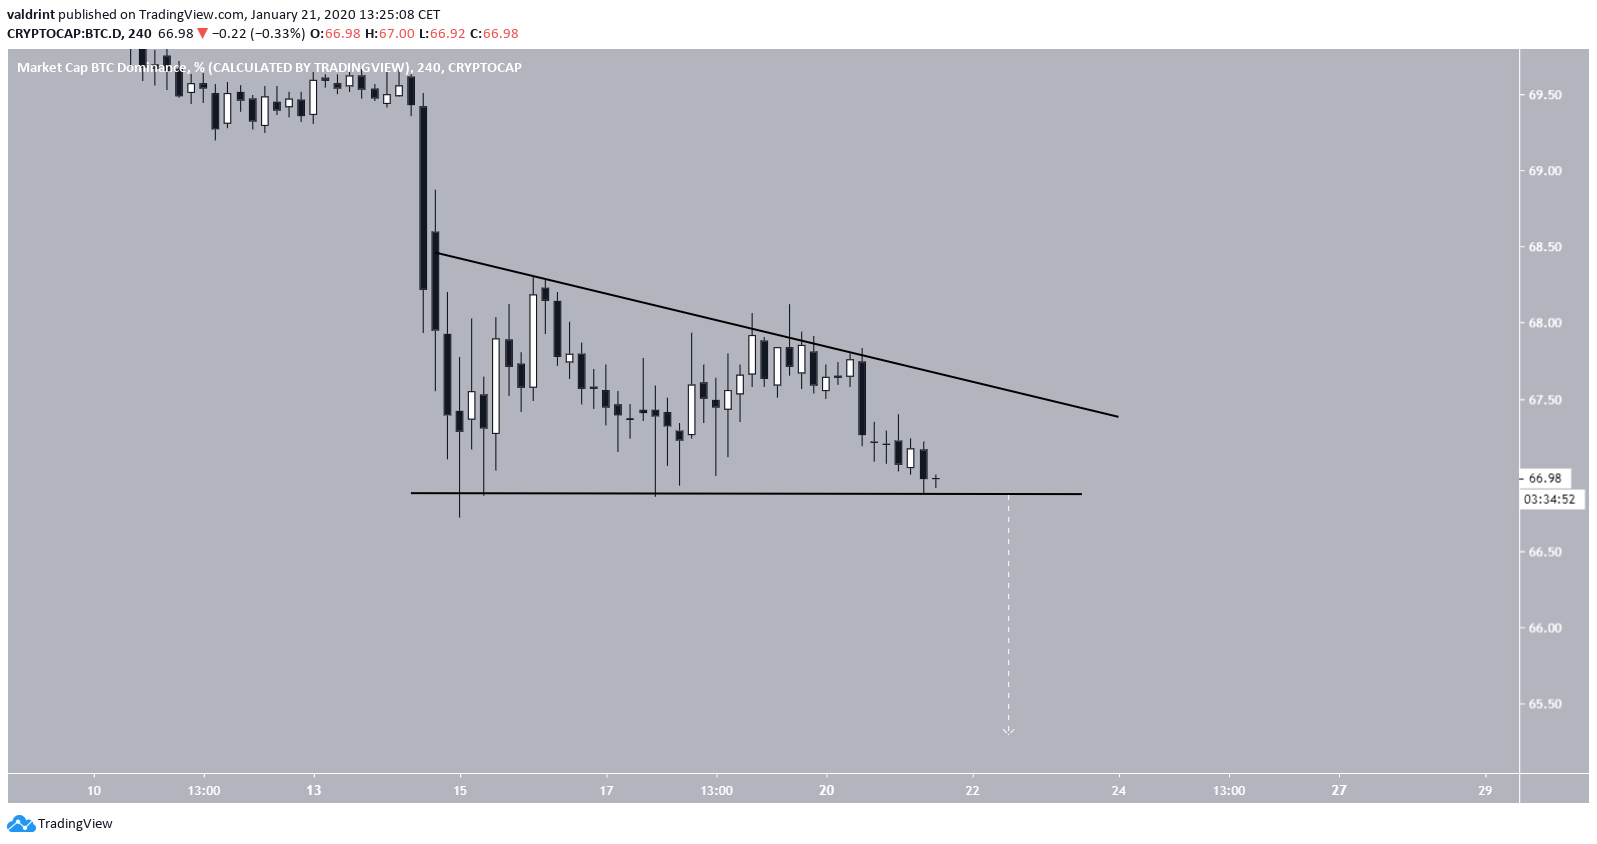
The short-term movement supports the outline of this movement. After the January 14 rapid decrease, the rate has created a descending triangle, which is a bearish pattern. Since it is coming after a Bitcoin price decrease, it would be likely that it acts as a continuation pattern and causes the price to break down.
To conclude, the Bitcoin dominance rate was strongly rejected at the 72% resistance level, possibly indicating that it has reached a top. If it continues to decrease at the current rate, it will reach 63% by the beginning of March.


