

Several states in the U.S. have confirmed cannabis stores as essential due to the component of medical marijuana. Nevertheless, the majority of stocks are trading at or near all-time lows, despite indications that the sector might not be impacted by the economic shutdown.
In this article, we will take a look at the performance of major cannabis indices along with individual companies, and compare their performance to that of cryptocurrencies.
Marijuana Index
One of the biggest indices in the marijuana industry is Horizons Marijuana Life Sciences Index (HMMJ), which was created on April 4, 2017 and has net assets of $307,214,803. At least from a technical analysis perspective, the outlook looks quite bleak. Measuring from Jan. 1, 2019, HMMJ has decreased by a massive 58%, currently being at $6.4. In addition, the index has been on a downward trend since March 25, 2019, or for the past 399 days, following a descending resistance line. On a positive note, the weekly RSI has been generating bullish divergence, an occurrence which often transpires prior to trend reversals and could eventually initiate an upward move. However, the index has a very long way to go in order to make up for previous losses. Even if a breakout were to occur, it would initially be a retracement, until the price makes a higher low and possibly begins a new upward trend.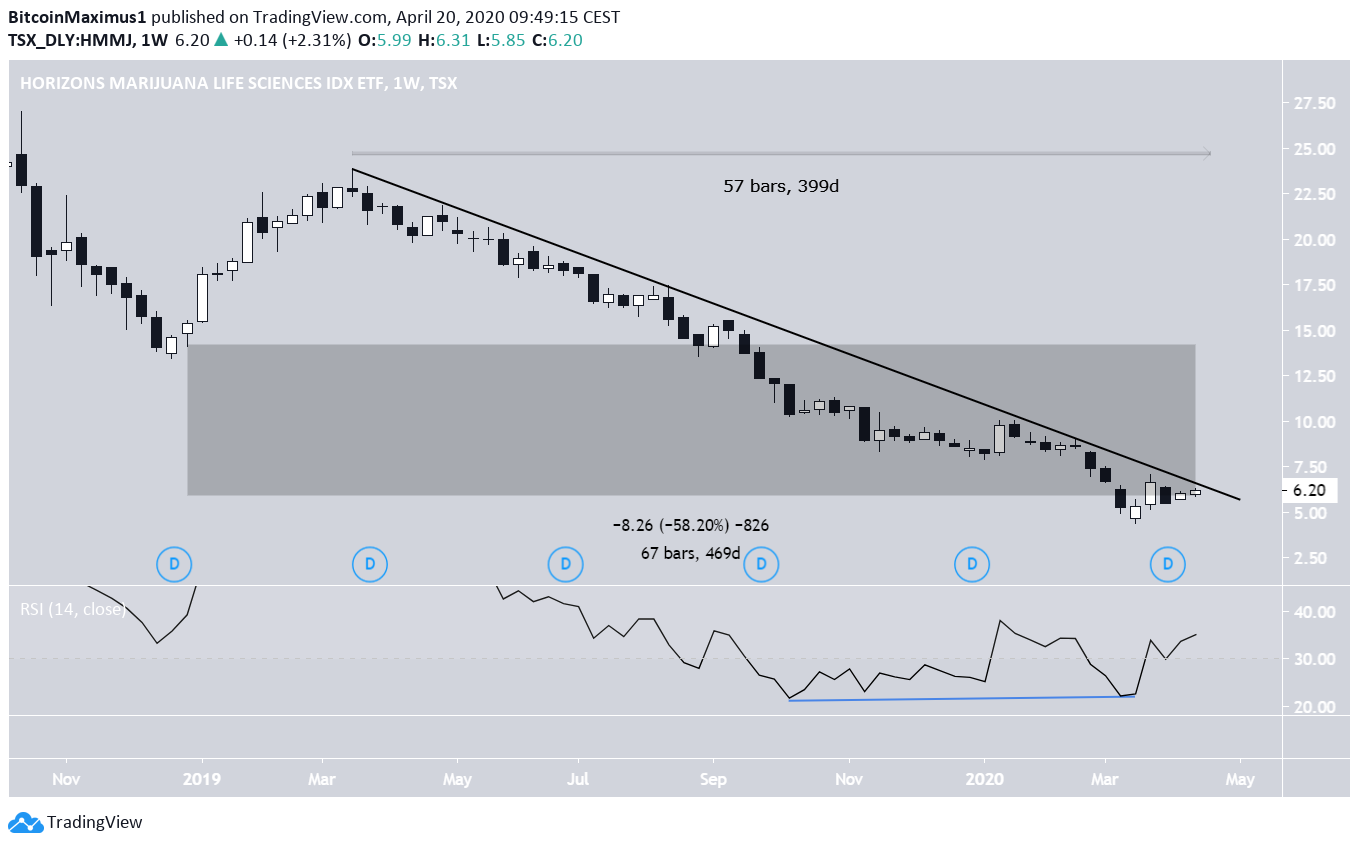
Comparison With Cryptocurrencies
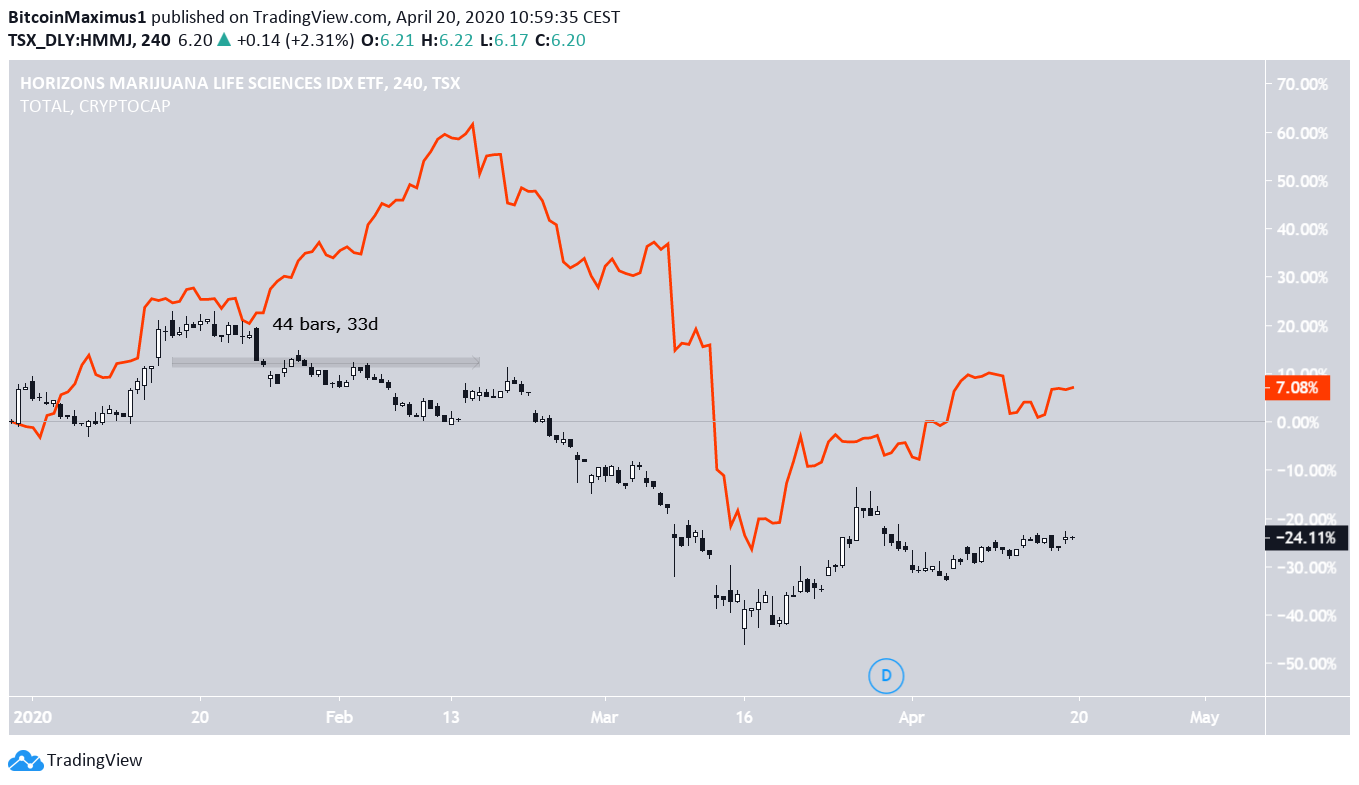
In contrast, the total cryptocurrency market cap has fared much better. Since the beginning of 2019, the total crypto market cap has actually increased, doing so by 17%. In addition, the downtrend began 106 days later than in HMMJ, a time period in which cryptocurrencies made considerable gains, at one point (July 2019) being 160% higher than in the beginning of the year. Also, there was a reactionary upward move in December of the same year, which broke the downward trend and caused the total market cap to increase. The second downward trend began on Feb. 18, 2020 and is still ongoing.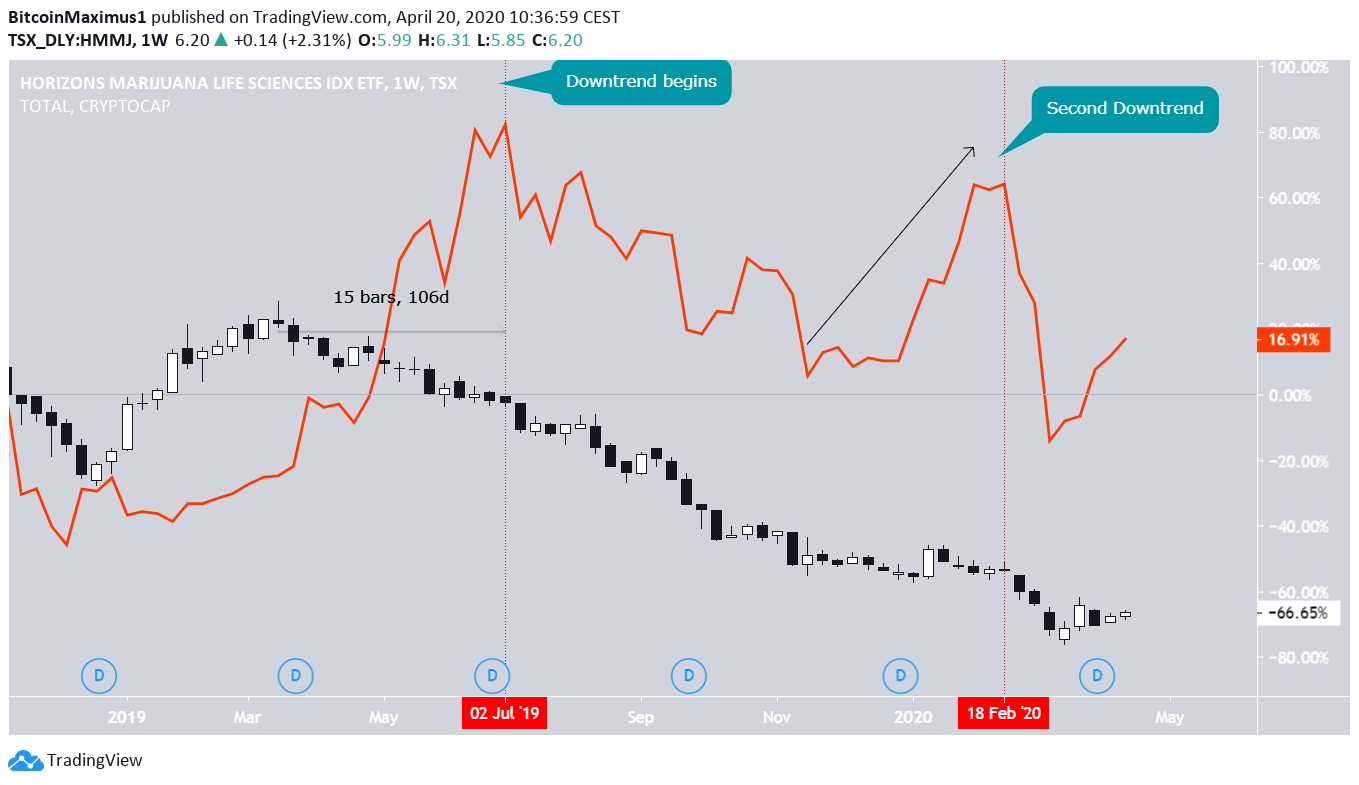
Potential Winners
Despite the downward trend that is in place in almost the entire industry, not all marijuana related stocks have such a bleak outlook. Acreage Holdings (ACRGF) has decreased significantly in 2020, doing so by 72%. However, it has created a double bottom at the current price of $1.6, which is combined with bullish divergence in the RSI. The double bottom is a strong reversal pattern that gains even more significance when combined with the RSI reading.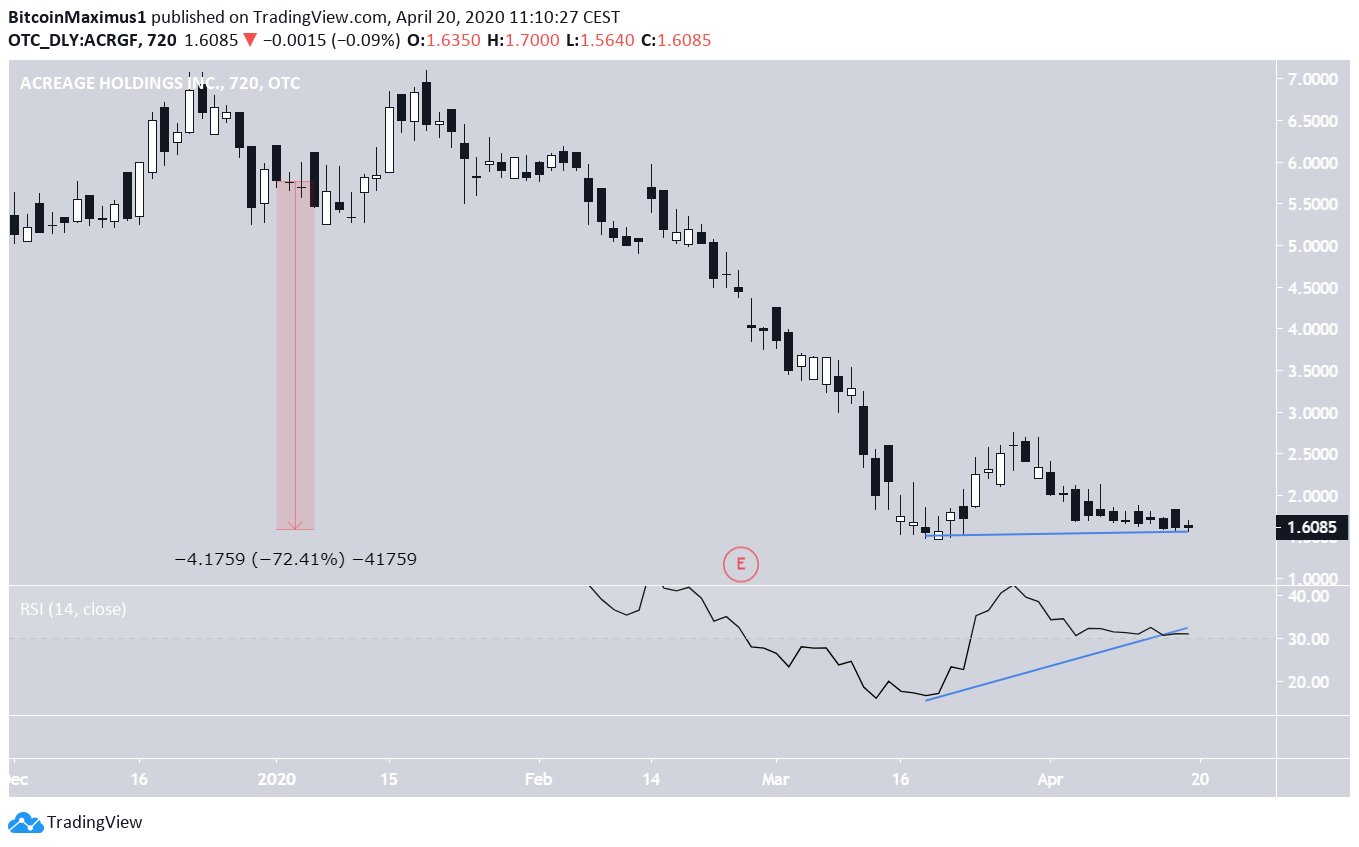
Disclaimer
In line with the Trust Project guidelines, this price analysis article is for informational purposes only and should not be considered financial or investment advice. BeInCrypto is committed to accurate, unbiased reporting, but market conditions are subject to change without notice. Always conduct your own research and consult with a professional before making any financial decisions. Please note that our Terms and Conditions, Privacy Policy, and Disclaimers have been updated.
