


As the market observes the movements of Arbitrum (ARB), many are questioning whether it will shift towards a bullish trend.
Identifying key reversal points is crucial for anticipating such a potential turnaround.
Arbitrum Technical Analysis
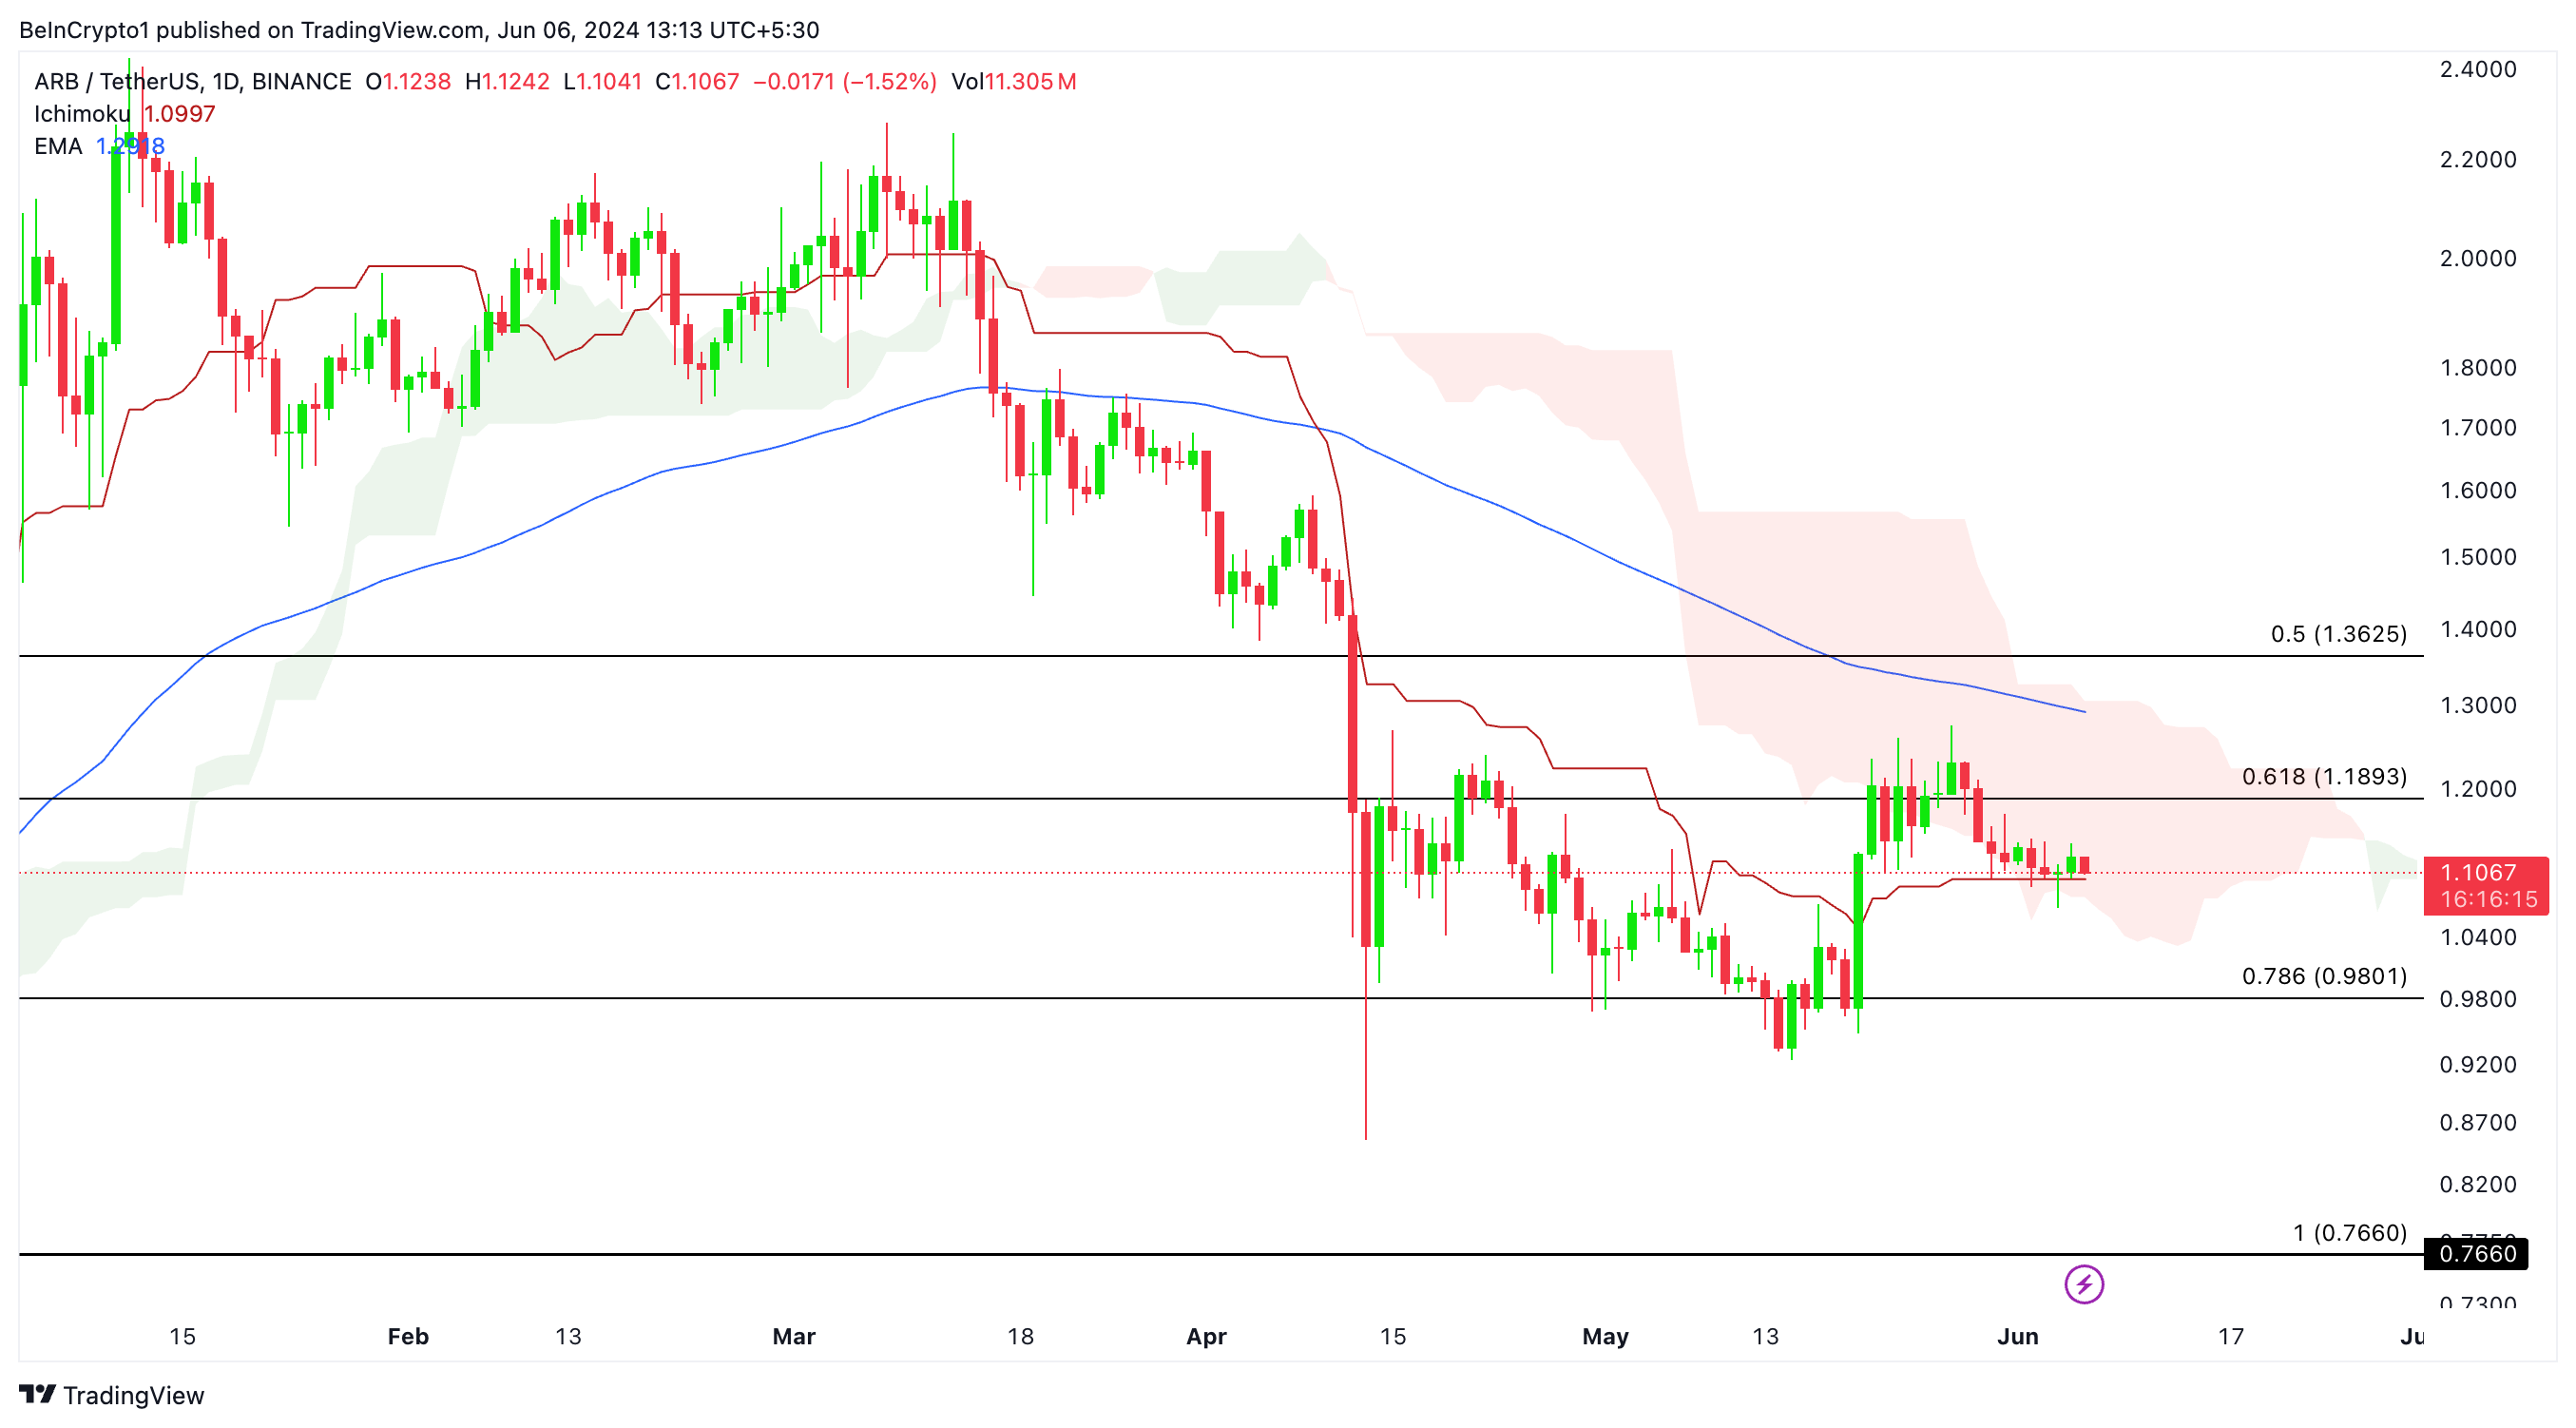
On the daily chart, Arbitrum’s price is trading at the lower boundary of the Ichimoku cloud, indicating a bearish sentiment.
The 100-day EMA, acting as resistance, stands at $1.23. The 100 EMA is near the upper boundary of the daily Ichimoku cloud. A price breakout above the cloud could encounter resistance at the 100 EMA daily.
If the price surpasses this level, it could potentially reach $1.36, which aligns with the 0.5 Fibonacci retracement level. Key Fibonacci retracement levels are at 0.5 ($1.36), 0.618 ($1.18), and 0.786 ($0.98). The price oscillates between these levels, indicating a phase of consolidation.
The daily Ichimoku cloud’s baseline (red line) acts as an important support level. A break below this line could send the price down to $0.98.
Read More: 5 Best Arbitrum (ARB) Wallets in 2024
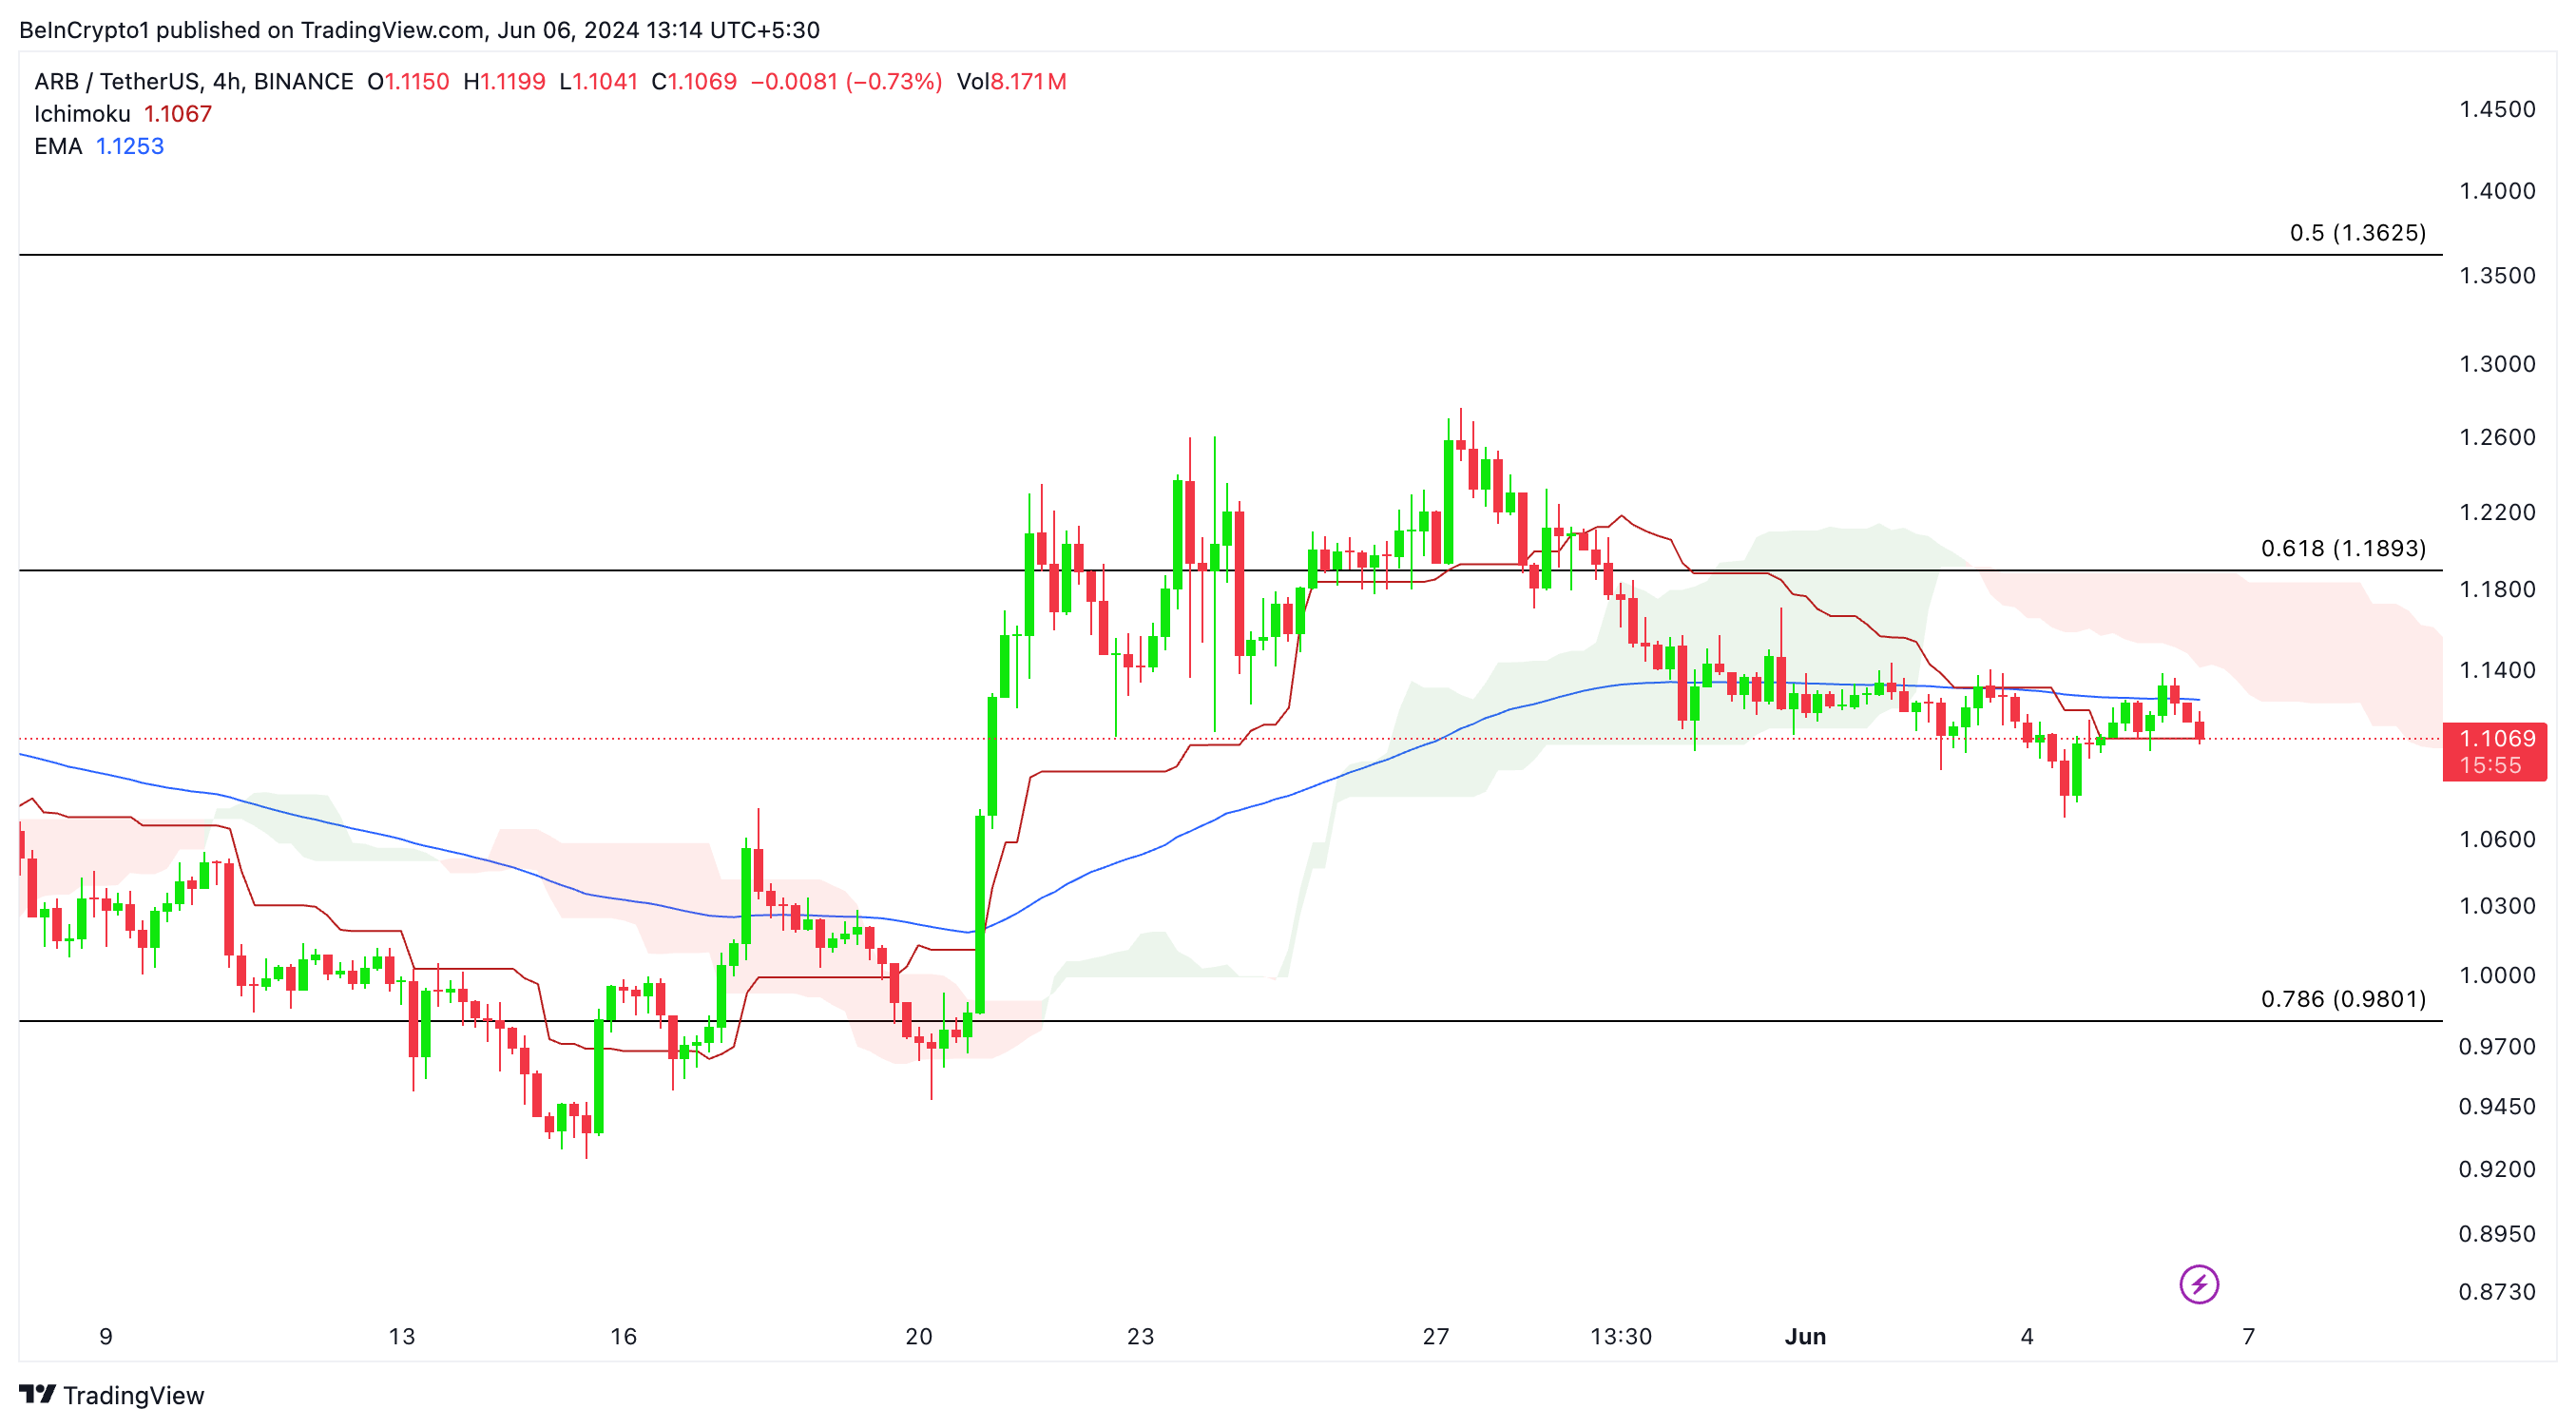
On the 4-hour chart, the Ichimoku cloud is positioned above the price, reinforcing the bearish trend. The 100-period EMA stands at $1.12, acting as short-term resistance.
The price is struggling to break above the baseline of the 4-hour Ichimoku cloud in red. If the price rejects this line and breaks above the 100-period EMA, it could incentivize a move into the cloud and potentially break to the upside.
The most crucial reversal point, signaling a shift from a bearish to a neutral trend, is the price entering the Ichimoku cloud in the 4-hour timeframe.
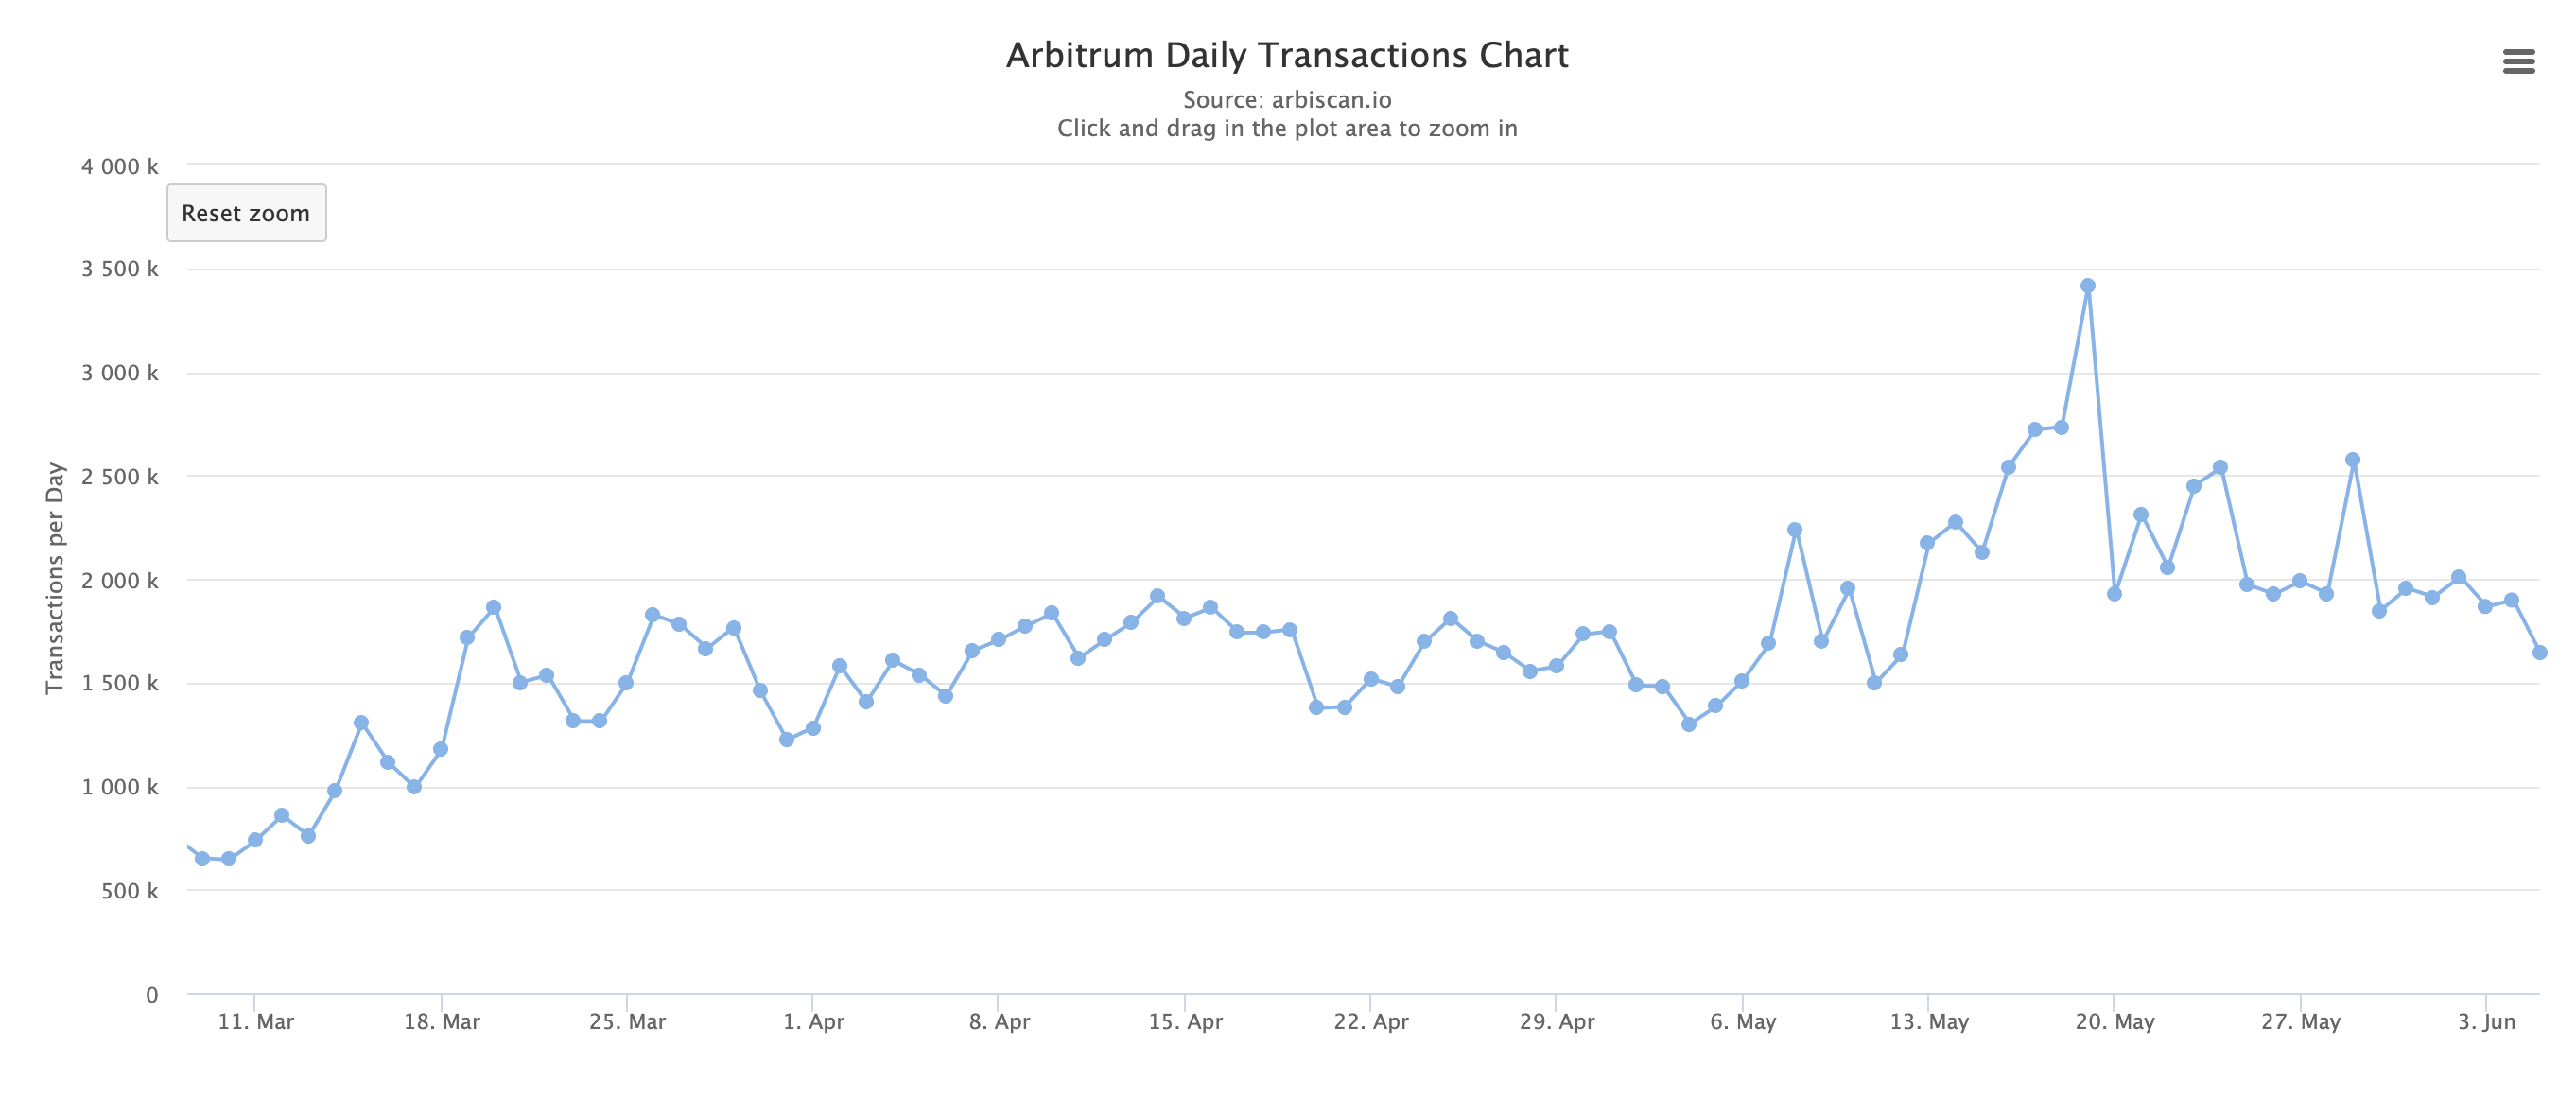
Arbitrum’s Transaction Volume and Unique Addresses
The Arbitrum daily transactions chart shows a steady increase in transactions starting from mid-March, peaking around mid-May, with over 3,500,000 daily transactions. Although there is a slight decline post-peak, the transaction volume remains high, consistently above 1,000,000 per day.
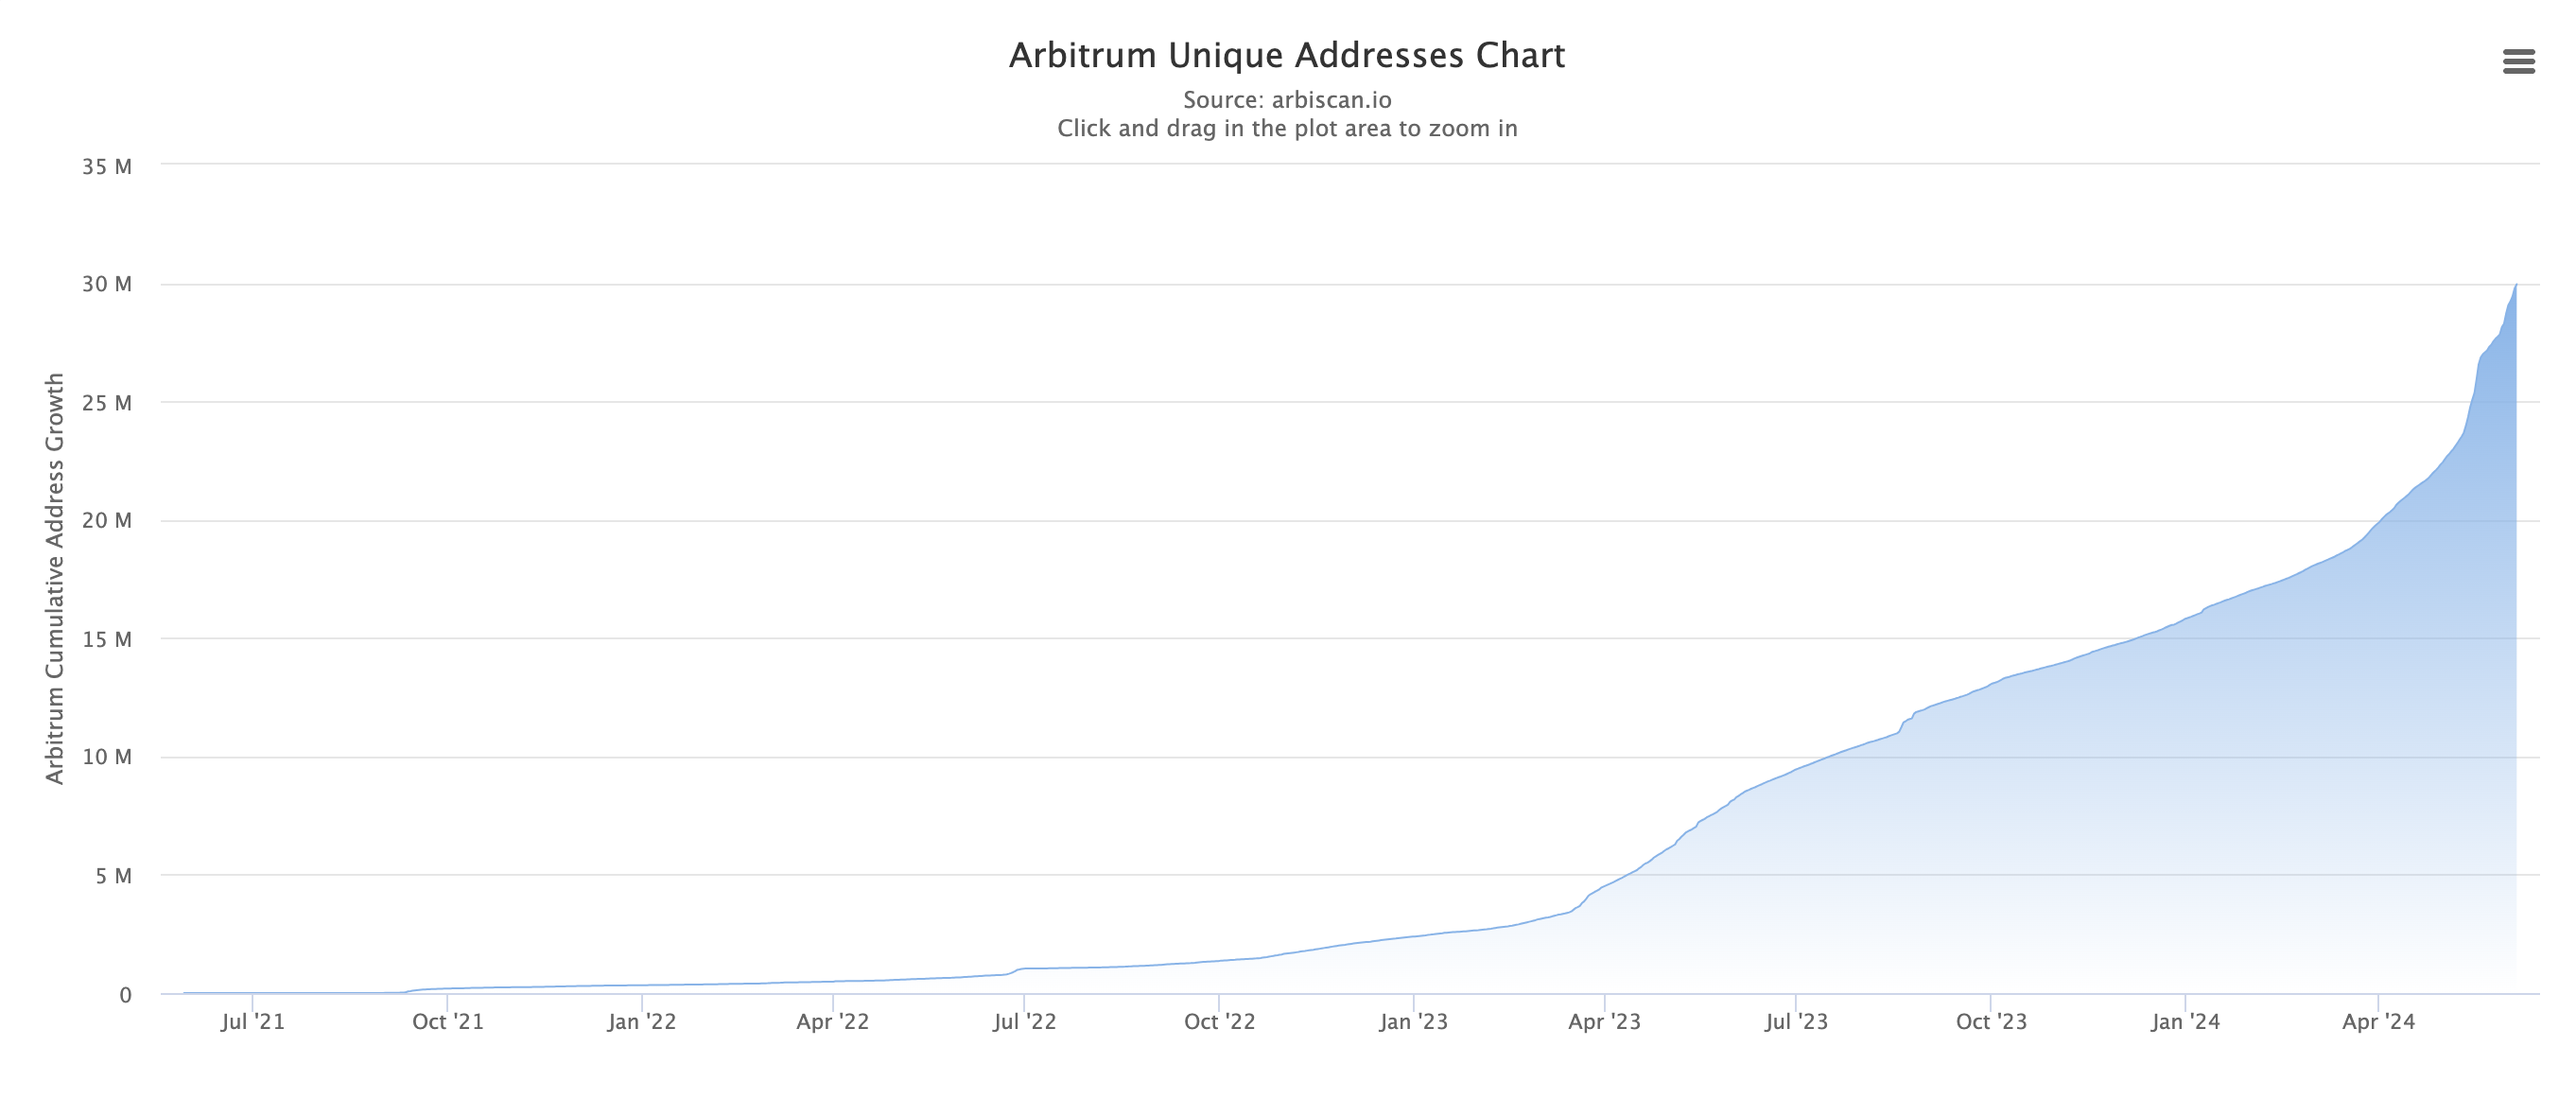
The cumulative unique addresses chart for Arbitrum demonstrates consistent growth since April 2023, with a significant acceleration in the growth rate beginning in early 2024.
By June 2024, the number of unique addresses has exceeded 30 million, indicating a growing user base and increased adoption of the Arbitrum network.
Read More: Arbitrum (ARB) Price Prediction 2024/2025/2035
Strategic Recommendations
Keep a close watch on the baseline (red line) of the daily Ichimoku cloud. This line acts as a critical support level. A break below this level could lead to a drop towards the $0.98 support level. Set alerts for any significant movement below this line to take timely action.
Given the bearish trend indicated by the Ichimoku cloud and the overall price action, prepare for potential downside risks. Consider setting stop-loss orders slightly below the baseline of the daily cloud to mitigate potential losses in case of a further decline.
If the price reaches the $0.98 support level, it could present a buying opportunity. Especially if there are signs of consolidation or reversal. Look for bullish signals, such as a bounce from this level or positive divergence on momentum indicators, before entering long positions.


