


The Aptos (APT) price is trading between crucial support and resistance levels. Whether it breaks out or down could determine the future trend.
The price action and Relative Strength Index (RSI) readings both provide mixed signs. So, both the bullish and bearish possibilities currently remain intact.
Aptos Price Approaches Yearly Low
The APR price has fallen under a descending resistance line since the beginning of February. Therefore, the trend can be considered bearish as long as the line is in place.
Throughout this time, the APT price has traded above the long-term $10.20 horizontal support area.
The area is crucial since it previously provided resistance in October 2022 and had then turned to support.
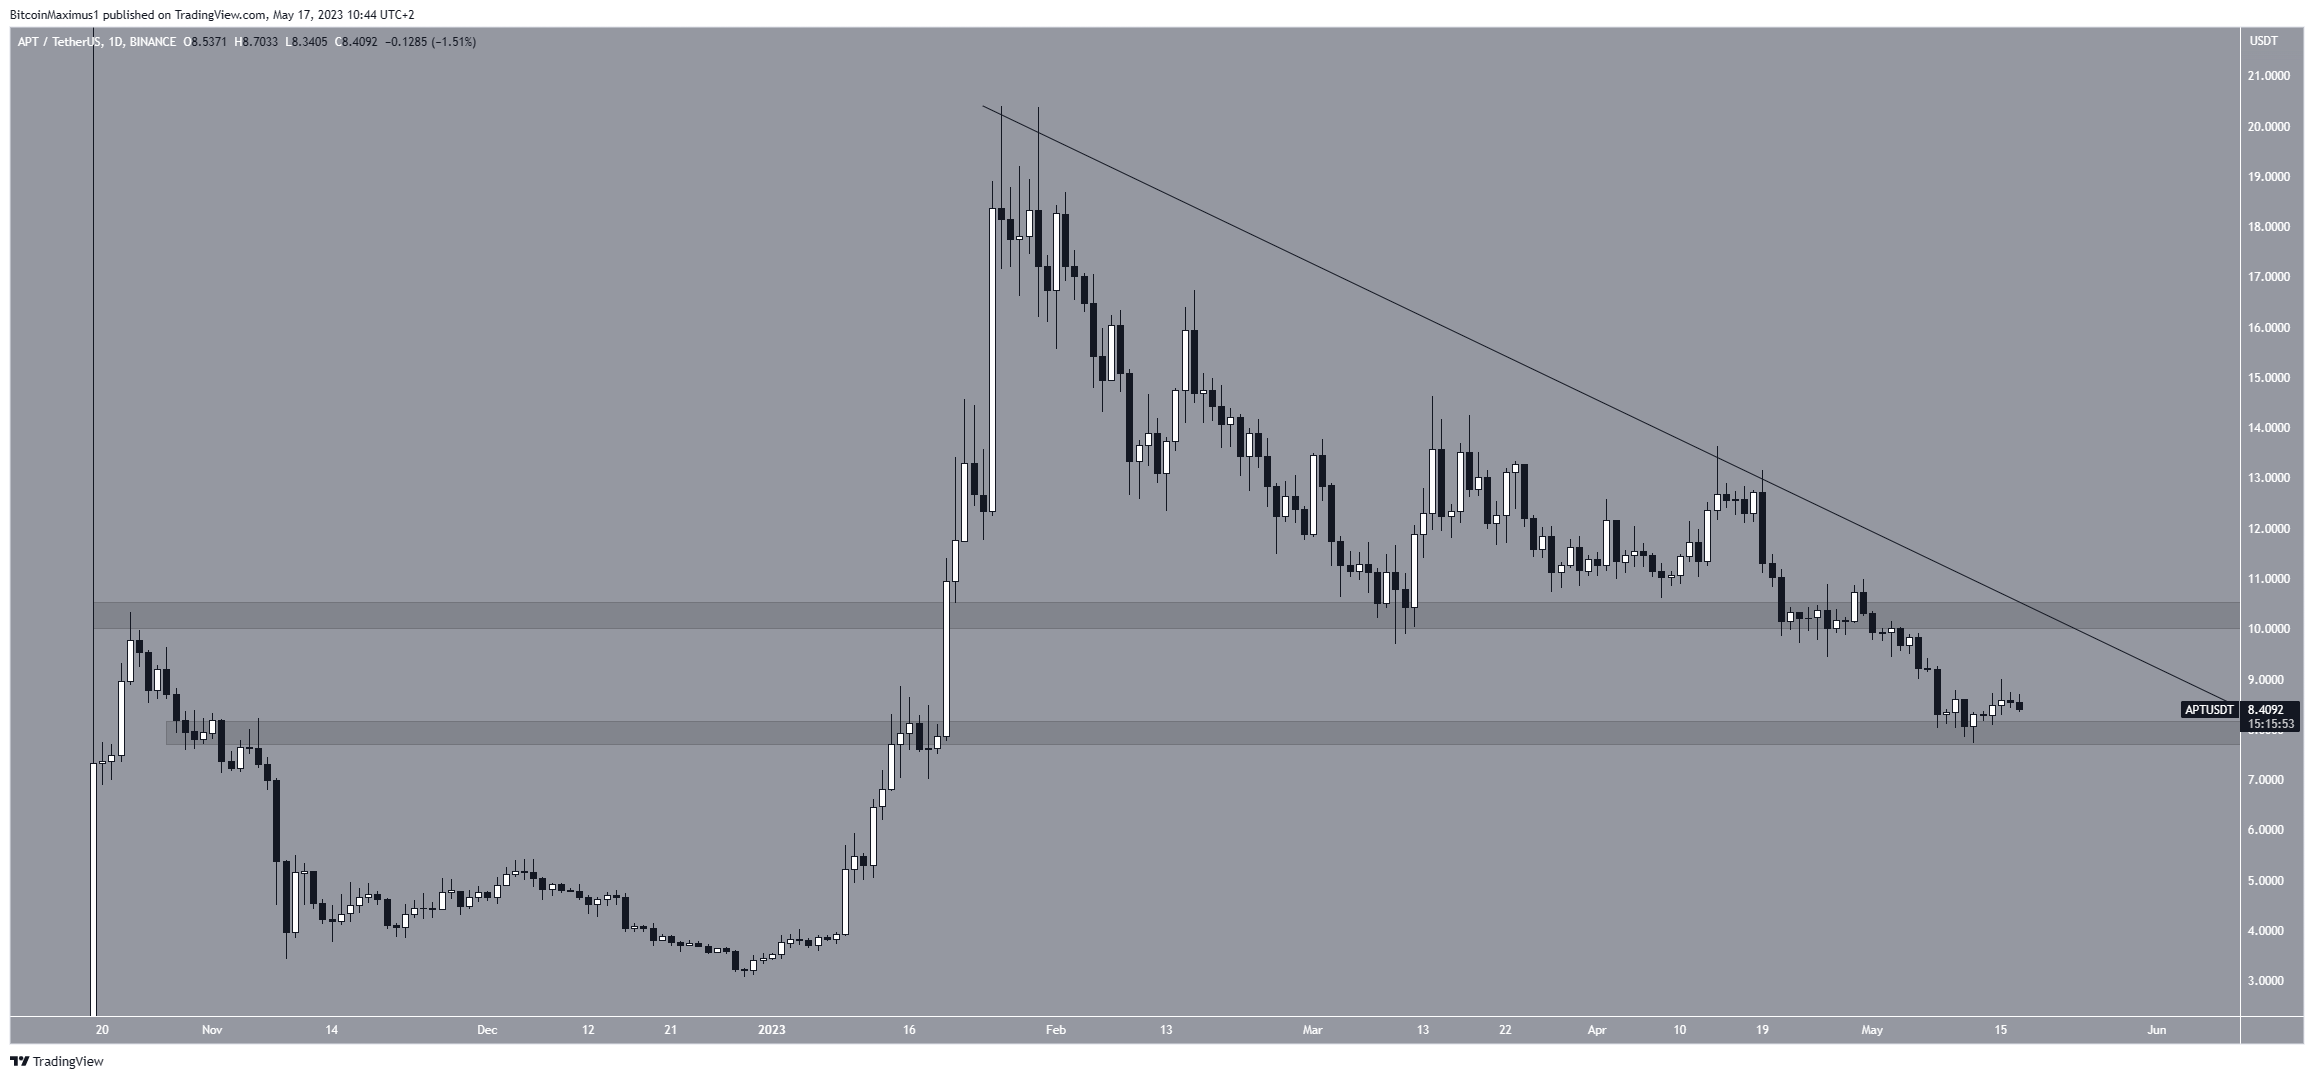
At the beginning of May, the APT price broke down from the area, a sign of a bearish trend.
Then, it reached a low of $7.70 on May 12. The low validated the $8 horizontal area as support. Now, the APT price trades in a range between average prices of $8 and $10.20.
APT Price Prediction for April: Further Gains Ahead
The technical analysis from the 12-hour time frame provides a mixed Aptos price forecast since there are arguments for both the bullish and bearish sides.
On the bullish side, the price bounced at a confluence of support levels at $8.20. Besides the previously outlined horizontal support area, the level also coincides with the support line of a descending parallel channel.
These channels usually contain corrective movements, meaning an eventual breakout from it is the most likely scenario.
However, the price also lost the crucial 0.618 Fib retracement support level. According to the Fibonacci retracement levels principle, following a significant price change in one direction, the price is expected to partially retrace or return to a previous price level before resuming in its original direction.
The 0.618 level is the one where corrections usually come to an end. So, its loss is a sign that suggests the trend is bearish.
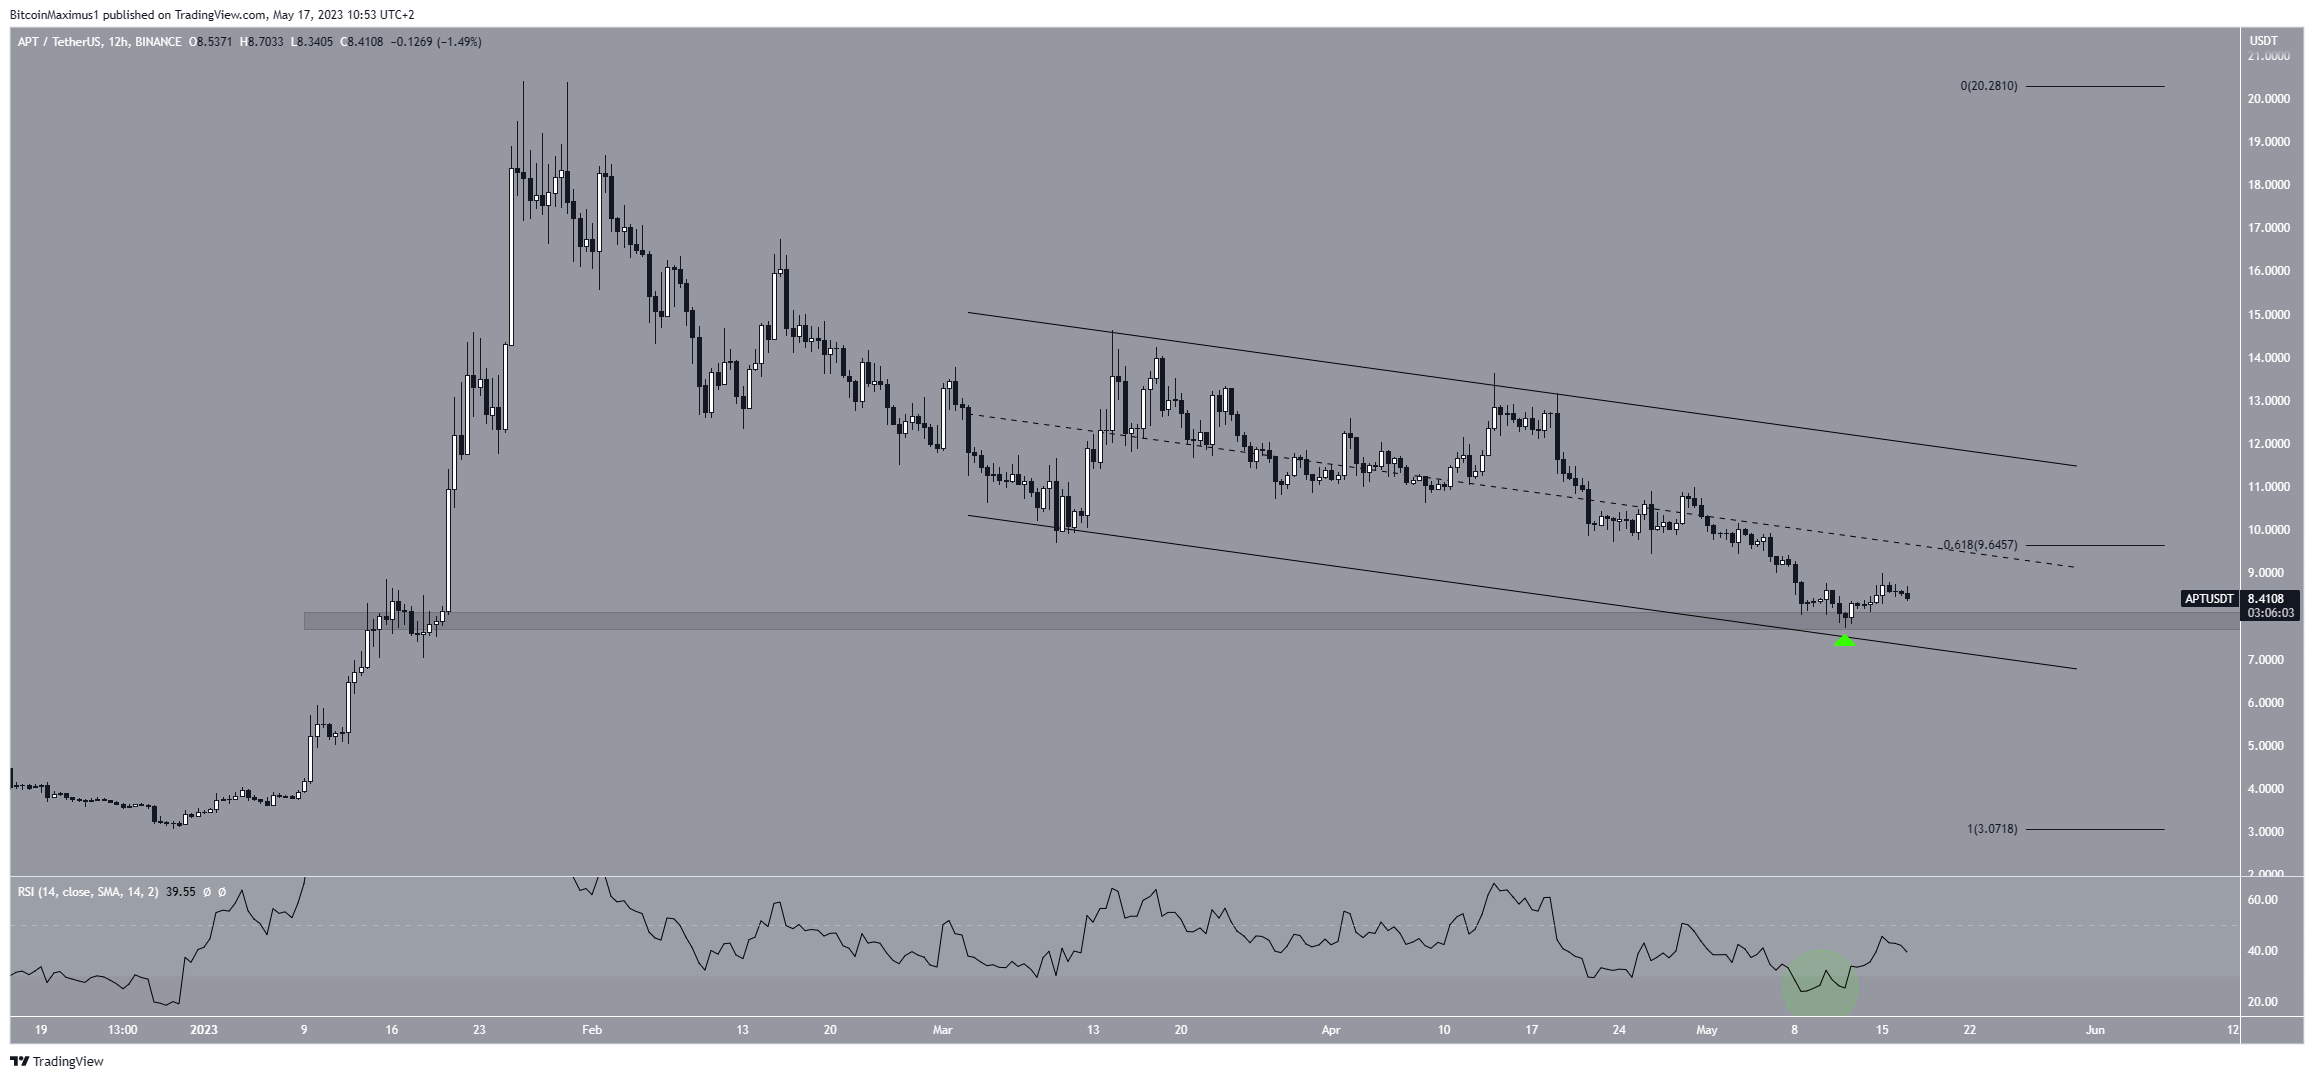
Additionally, the RSI provides a mixed reading. While the indicator moved outside of its oversold territory (green circle) and is increasing, it is still below 50.
To conclude, the APT price forecast will likely be decided by whether the price breaks down from the channel or breaks out from the descending resistance line. Due to mixed readings in the price action and RSI, both are still possible.
For BeInCrypto’s latest crypto market analysis, click here.



