


ApeCoin (APE) has broken down from an ascending support line, invalidating the potential bullish structure that had been developing since June 15.
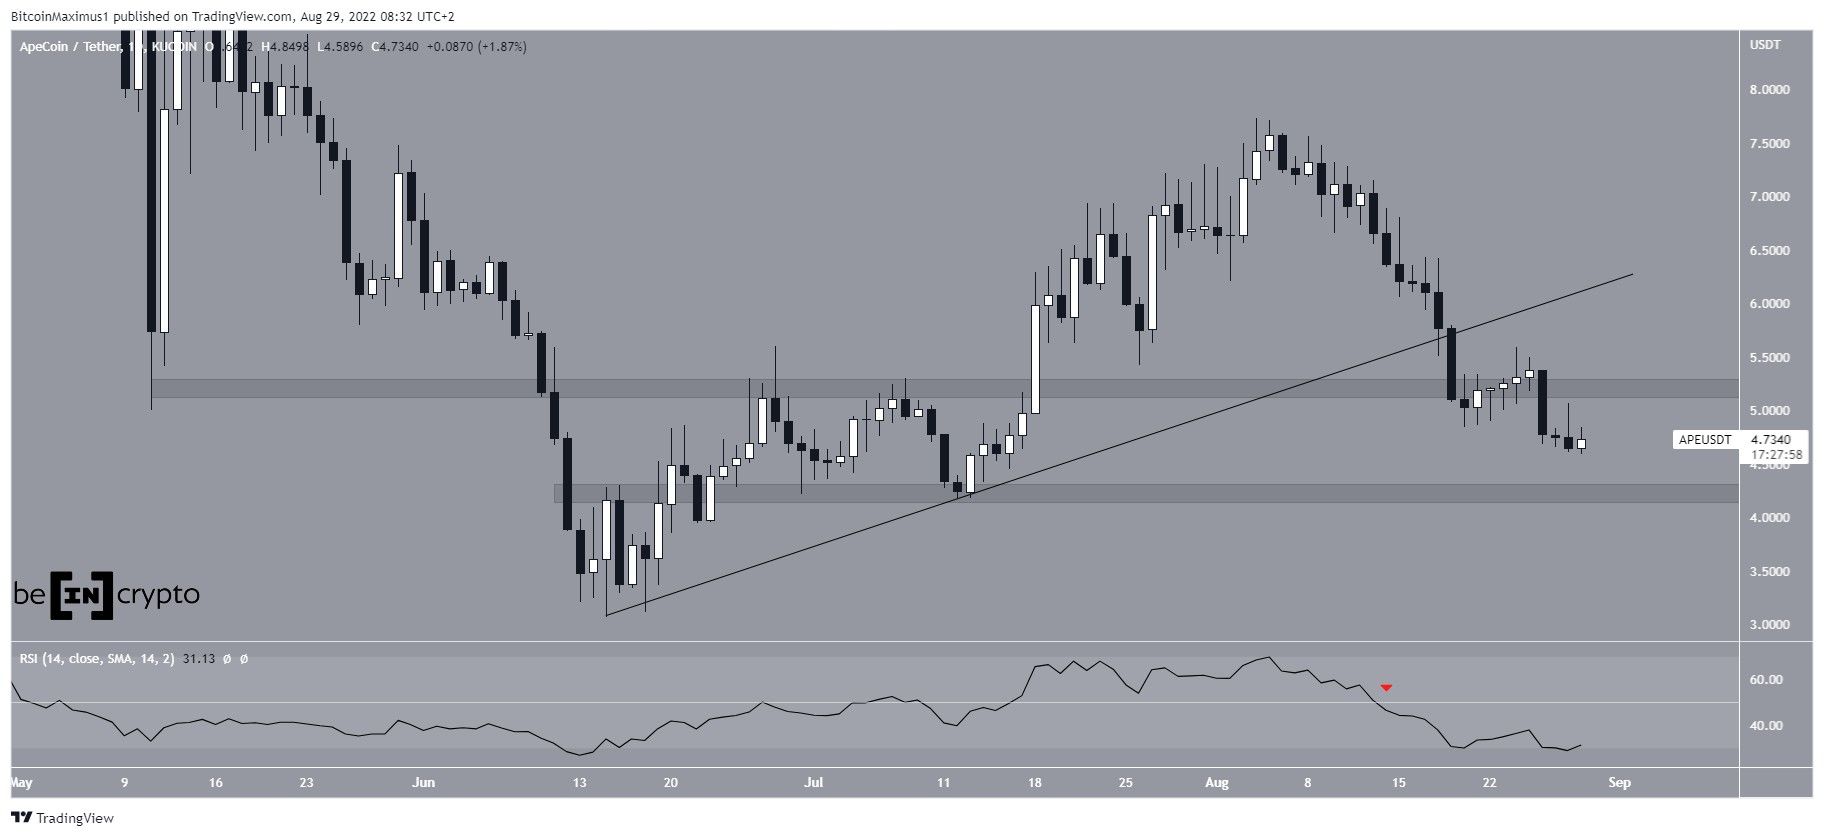
ApeCoin initiated an upward move on June 15, reaching a local high of $7.70 on Aug. 5. APE had been trading above an ascending support line during this time but broke down from the line on Aug. 19.
Following this, it resumed its descent and subsequently fell through the $5.20 horizontal support area on Aug. 26. As a result, the bullish structure that seemingly began on June 15 is at risk of being invalidated.
RSI breakdown
The daily RSI has broken down from 50 (red icon) and is still decreasing without generating any trace of a bullish divergence.
If the downward trend continues, the closest resistance area would likely be found at $4.20. Conversely, the $5.20 area is now expected to provide resistance.
Short-term APE movement
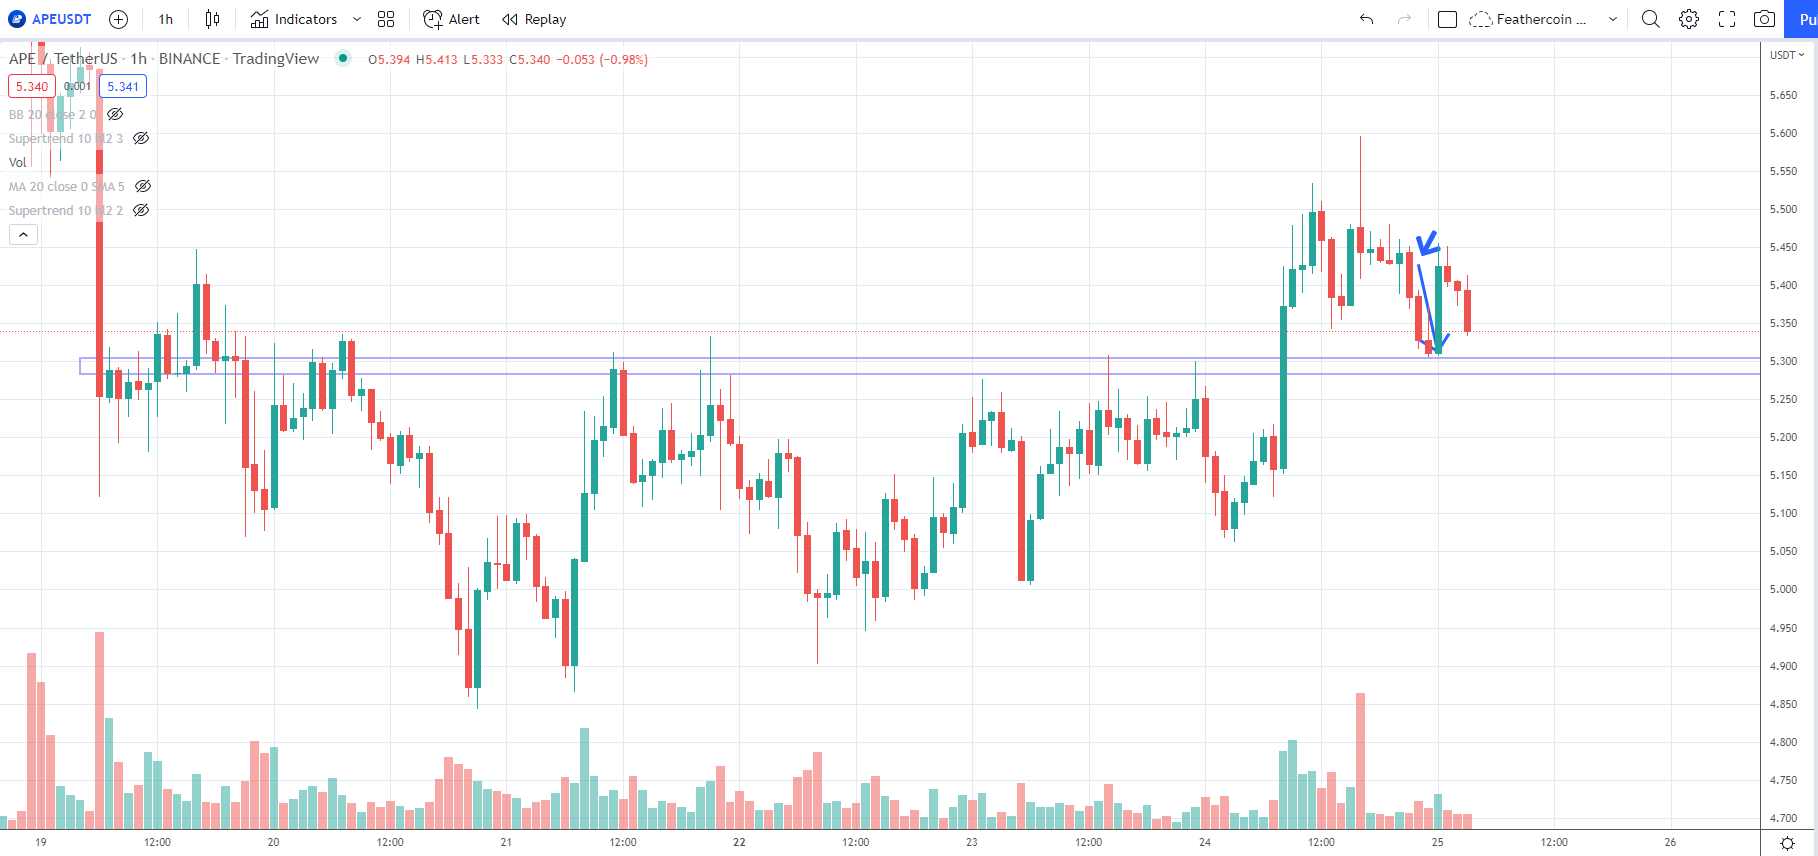
Cryptocurrency trader @IncomeSharks tweeted out an APE chart, noting that the price had fallen back to its $5.20 horizontal support area. As seen in the previous section, ApeCoin has broken down below this level since.
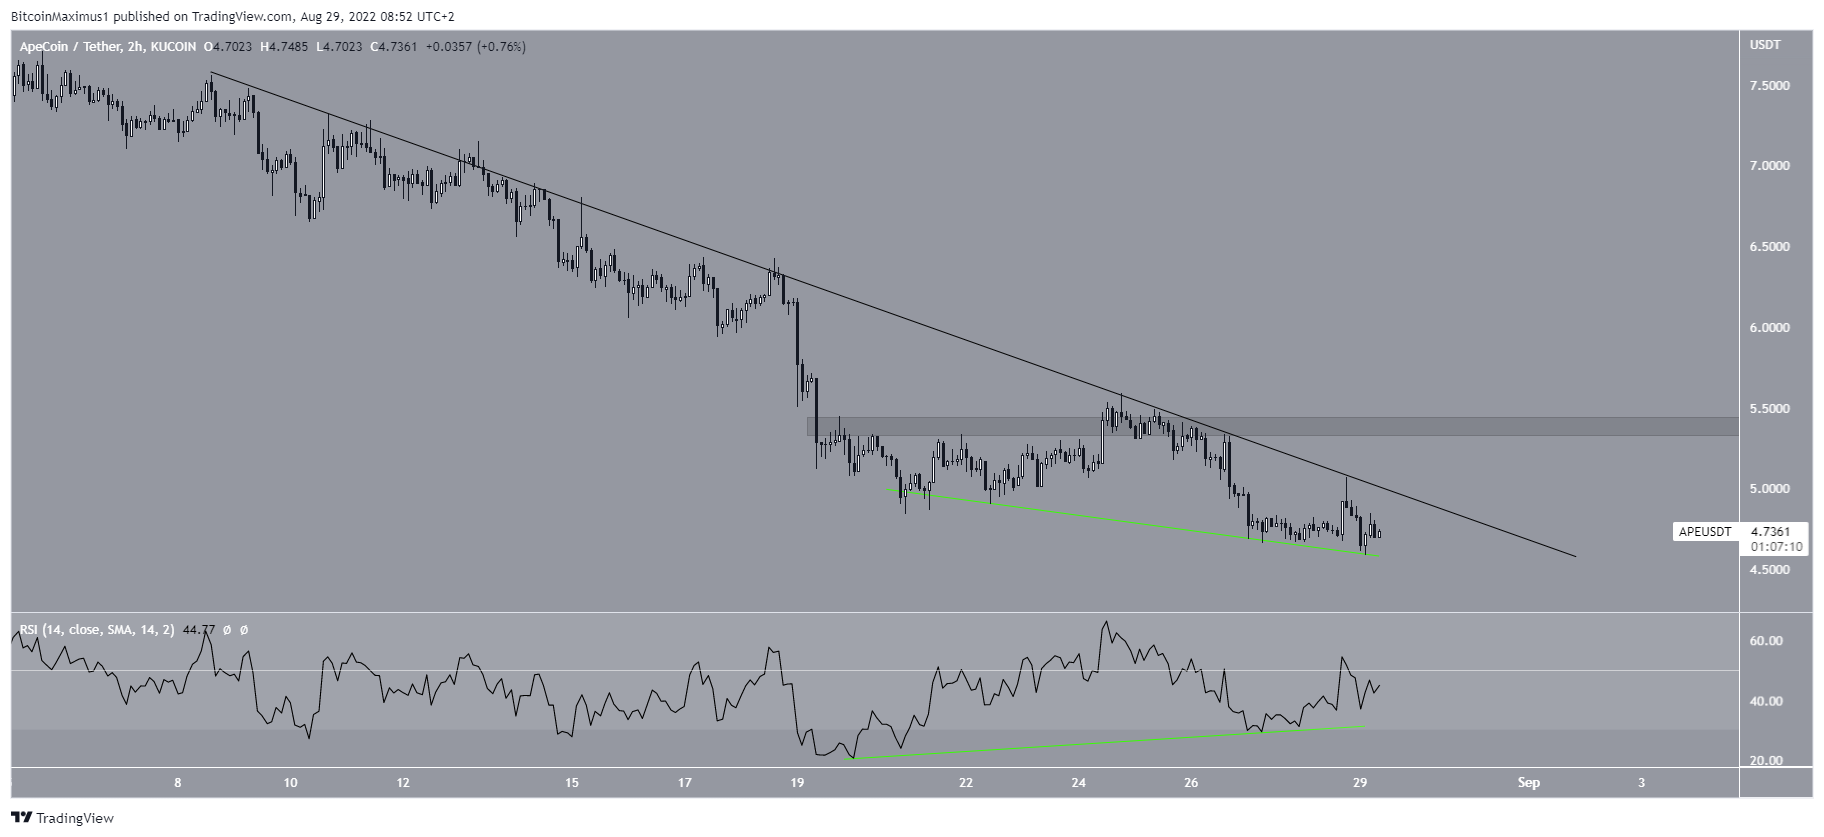
If a breakout above the line occurs, the closest resistance area would be found at $5.40, creating a target resistance zone between $5.20 and $5.40.
The most likely scenario would be a validation of this area as resistance followed by another downward move towards $4.20.
Wave count analysis
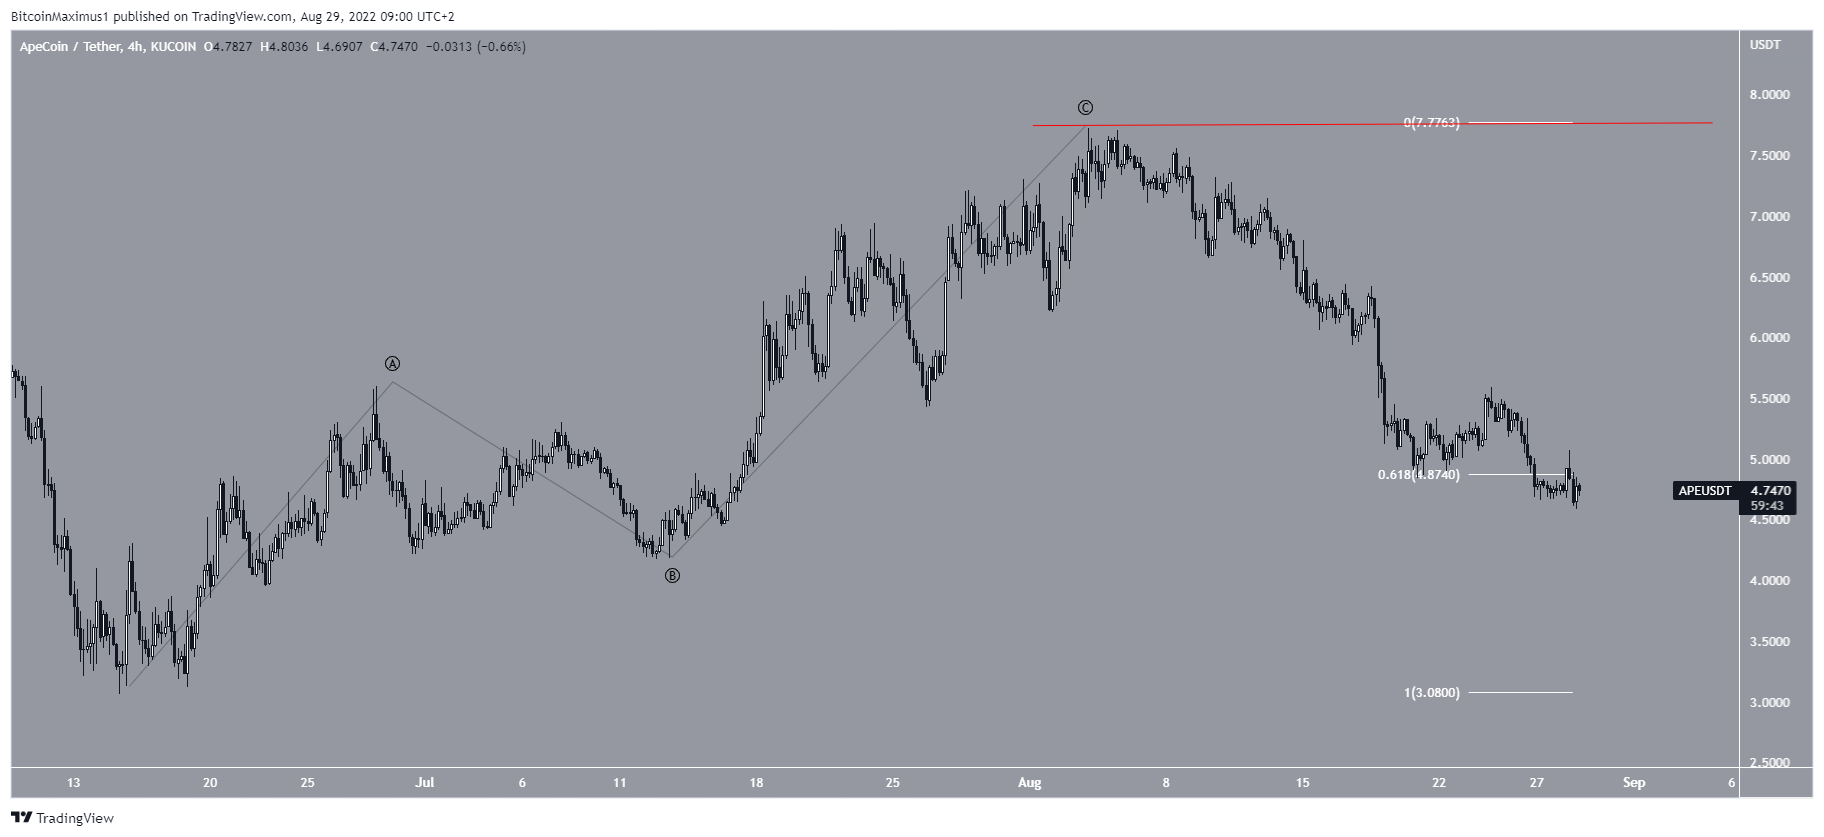
The most likely wave count suggests that APE completed an A-B-C corrective structure beginning on June 15. If so, new lows will likely follow.
Currently, the price seems to be attempting to reclaim the 0.618 fib retracement support level. Doing so may initiate the proposed increase to $5.30.
An increase above the C wave high (red line) at $7.72 would invalidate this particular wave count.
For Be[in]Crypto’s latest Bitcoin (BTC) analysis, click here



