
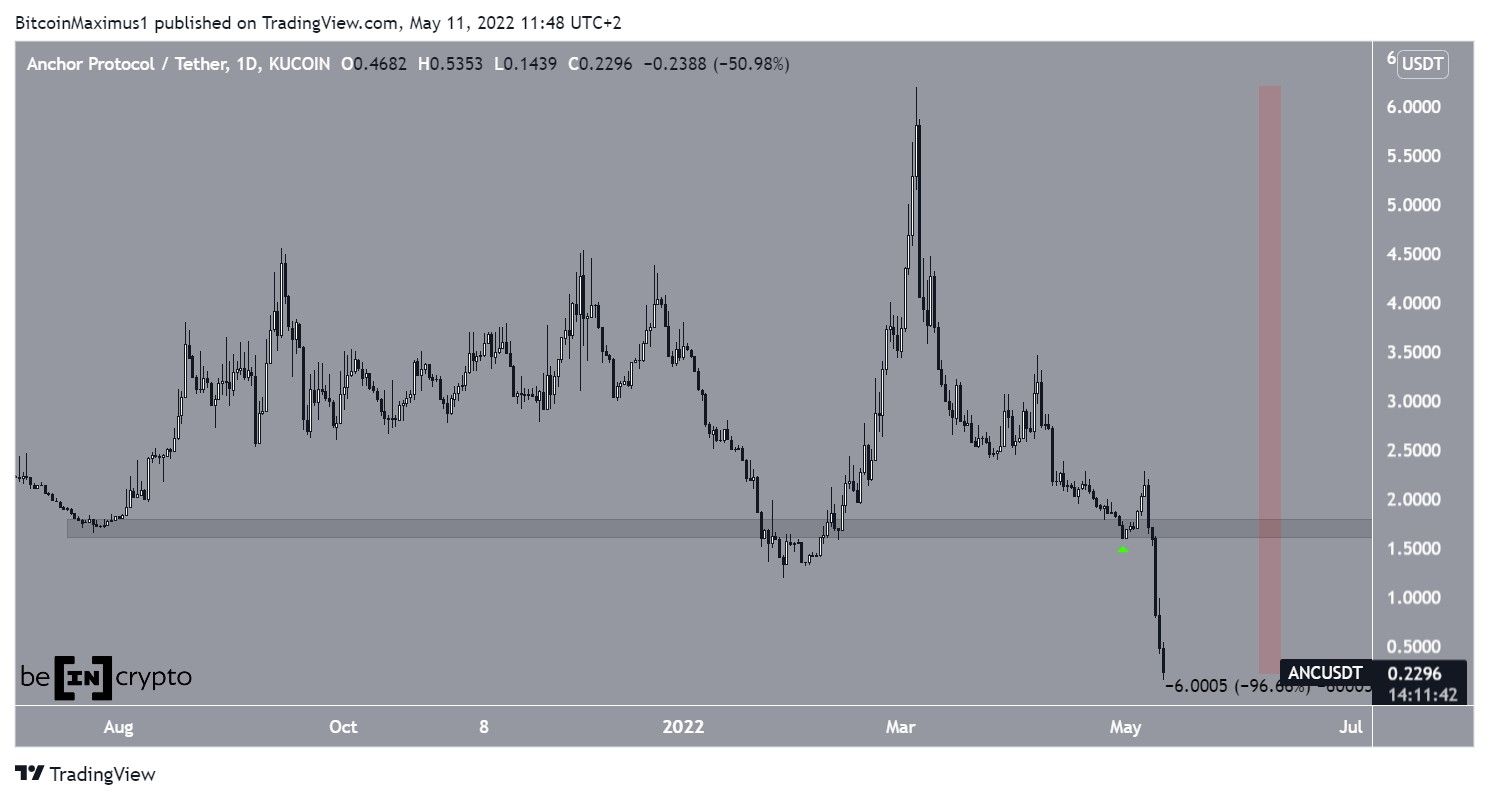
Anchor Protocol (ANC) broke down from a crucial support level on May 5 and reached a new all-time low price on May 11.
ANC has been decreasing at a very fast pace since reaching a high of $6.20 on March 5. On April 30, it initially bounced above the $1.70 horizontal support area (green icon). This is an important area since it had been providing support since Aug 2021.
However, the bounce was short-lived and the price broke down from the area on May 9 and has been falling at an accelerated rate since.
So far, ANC has reached a low of $0.143 on May 11. Measuring from the March high, this is a decrease of 96.66%.
Will ANC bounce?
Cryptocurrency trader @livercoin tweeted a chart, stating that the price could soon drop towards the $1.20 level.
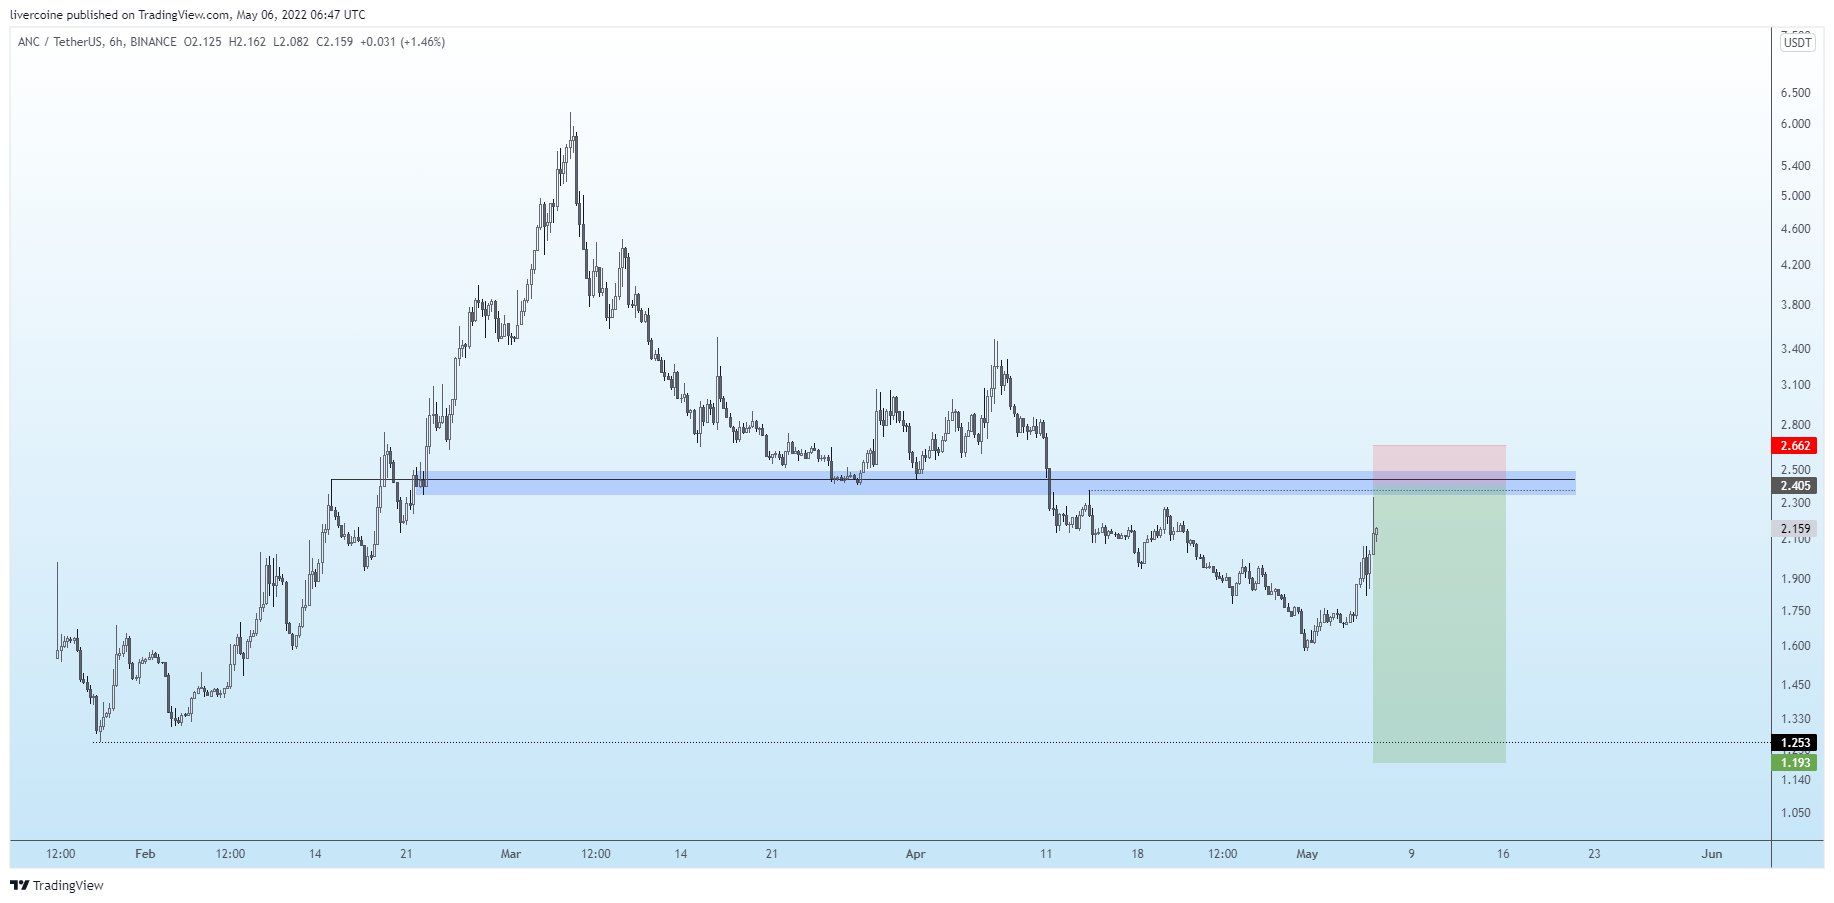
Since the tweet, has dropped well below it and proceeded to reach a new all-time low price of $0.14.
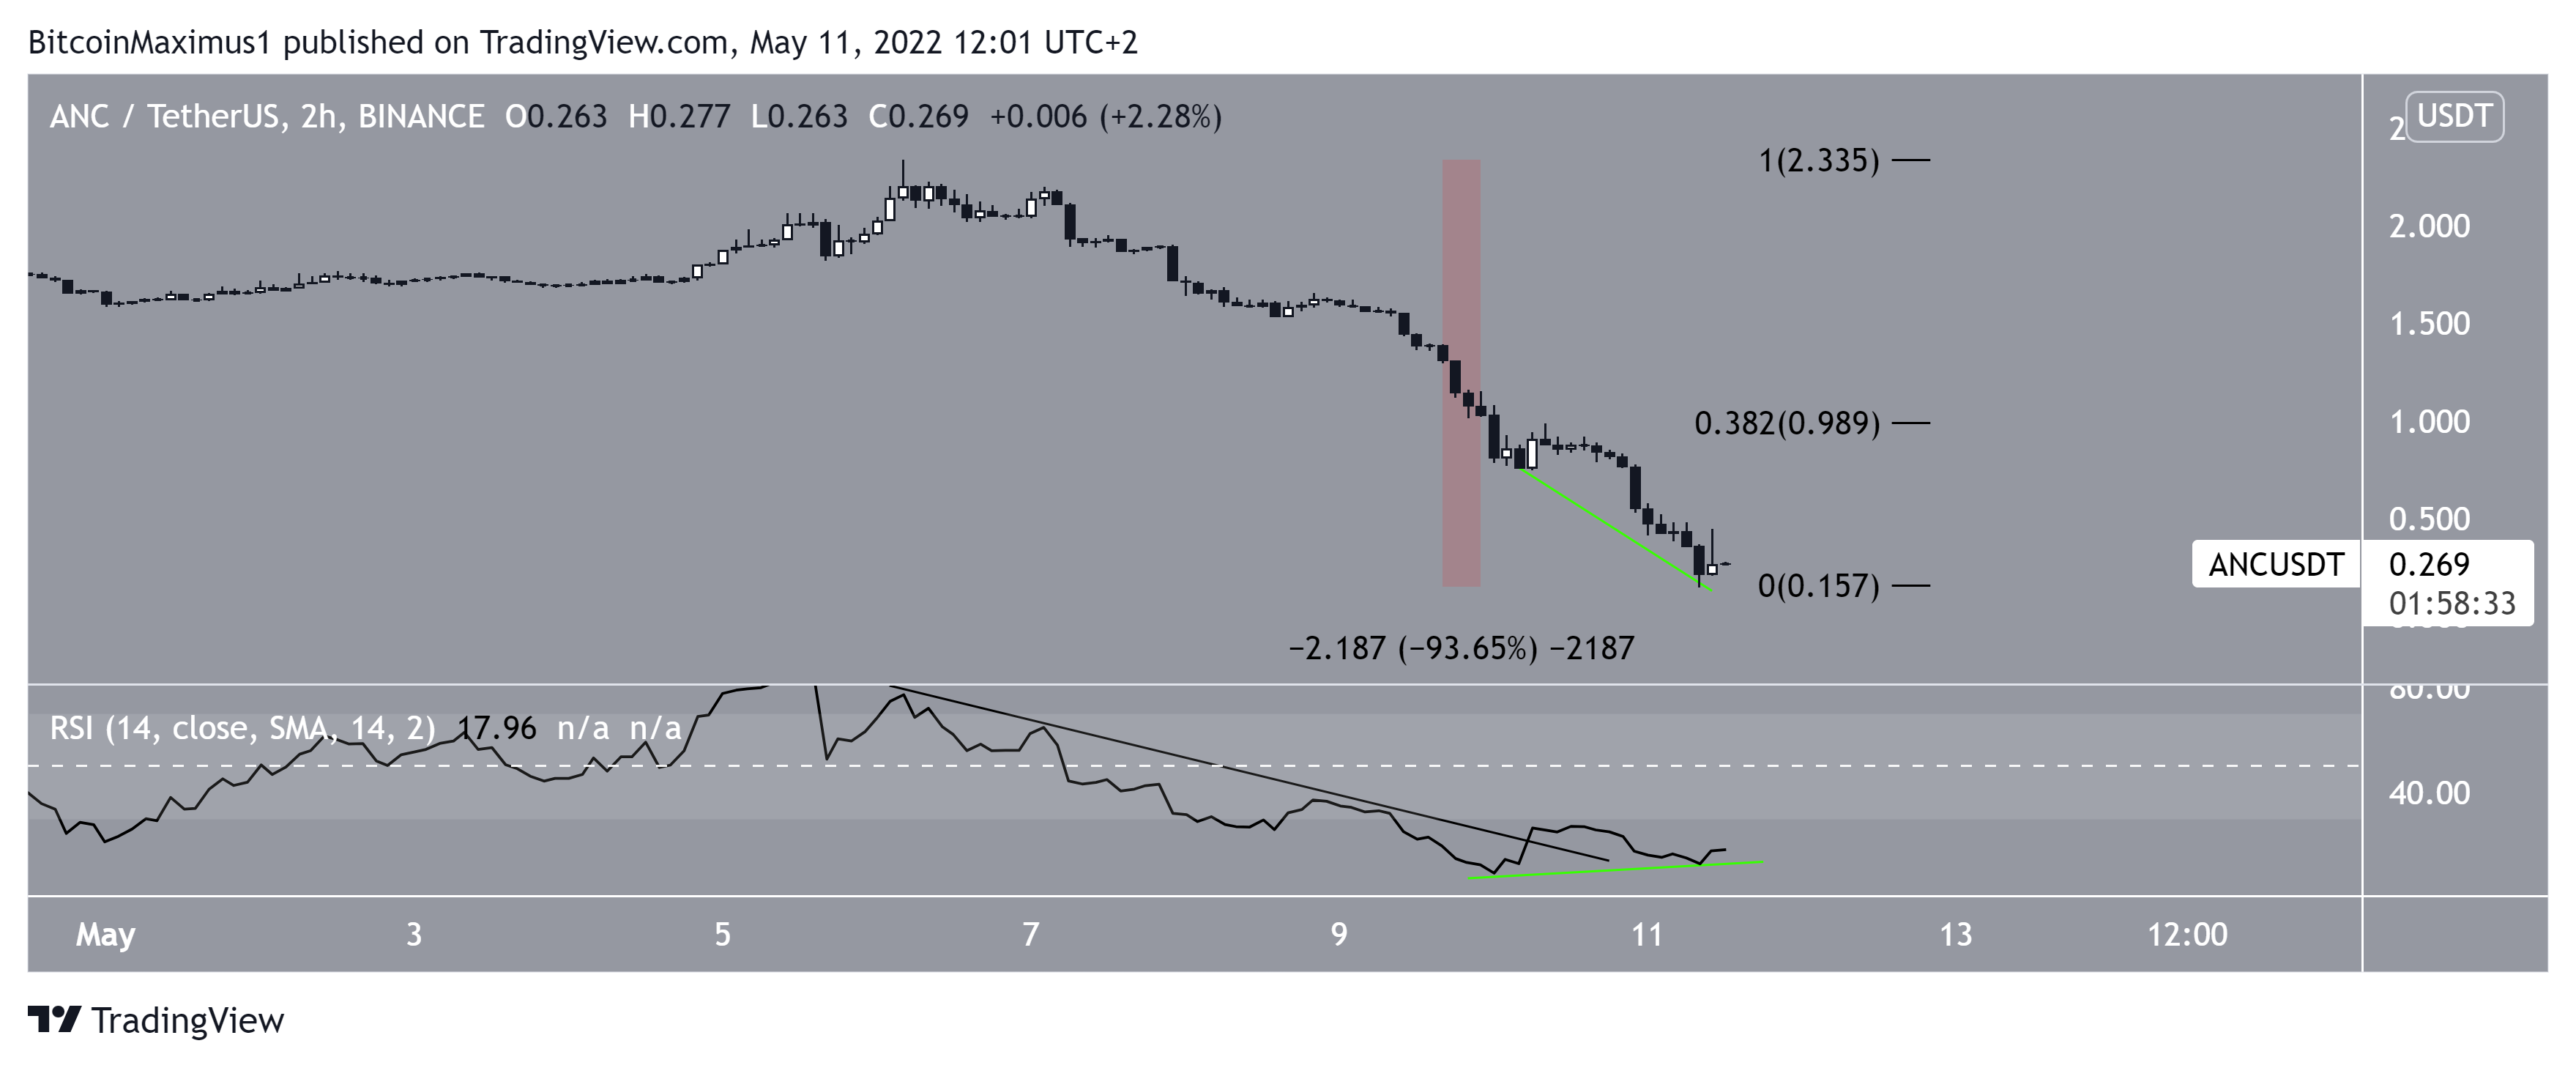
In the period since May 6, ANC has decreased by a full 94% without experiencing any significant retracement.
While the two-hour RSI had been falling for this entire period, it has now broken out from its descending resistance line. This is a sign that the price could follow its lead soon.
Additionally, the RSI has also generated bullish divergence (green lines), another potential sign of an impending bounce.
If one occurs, the closest resistance area would be at $1.
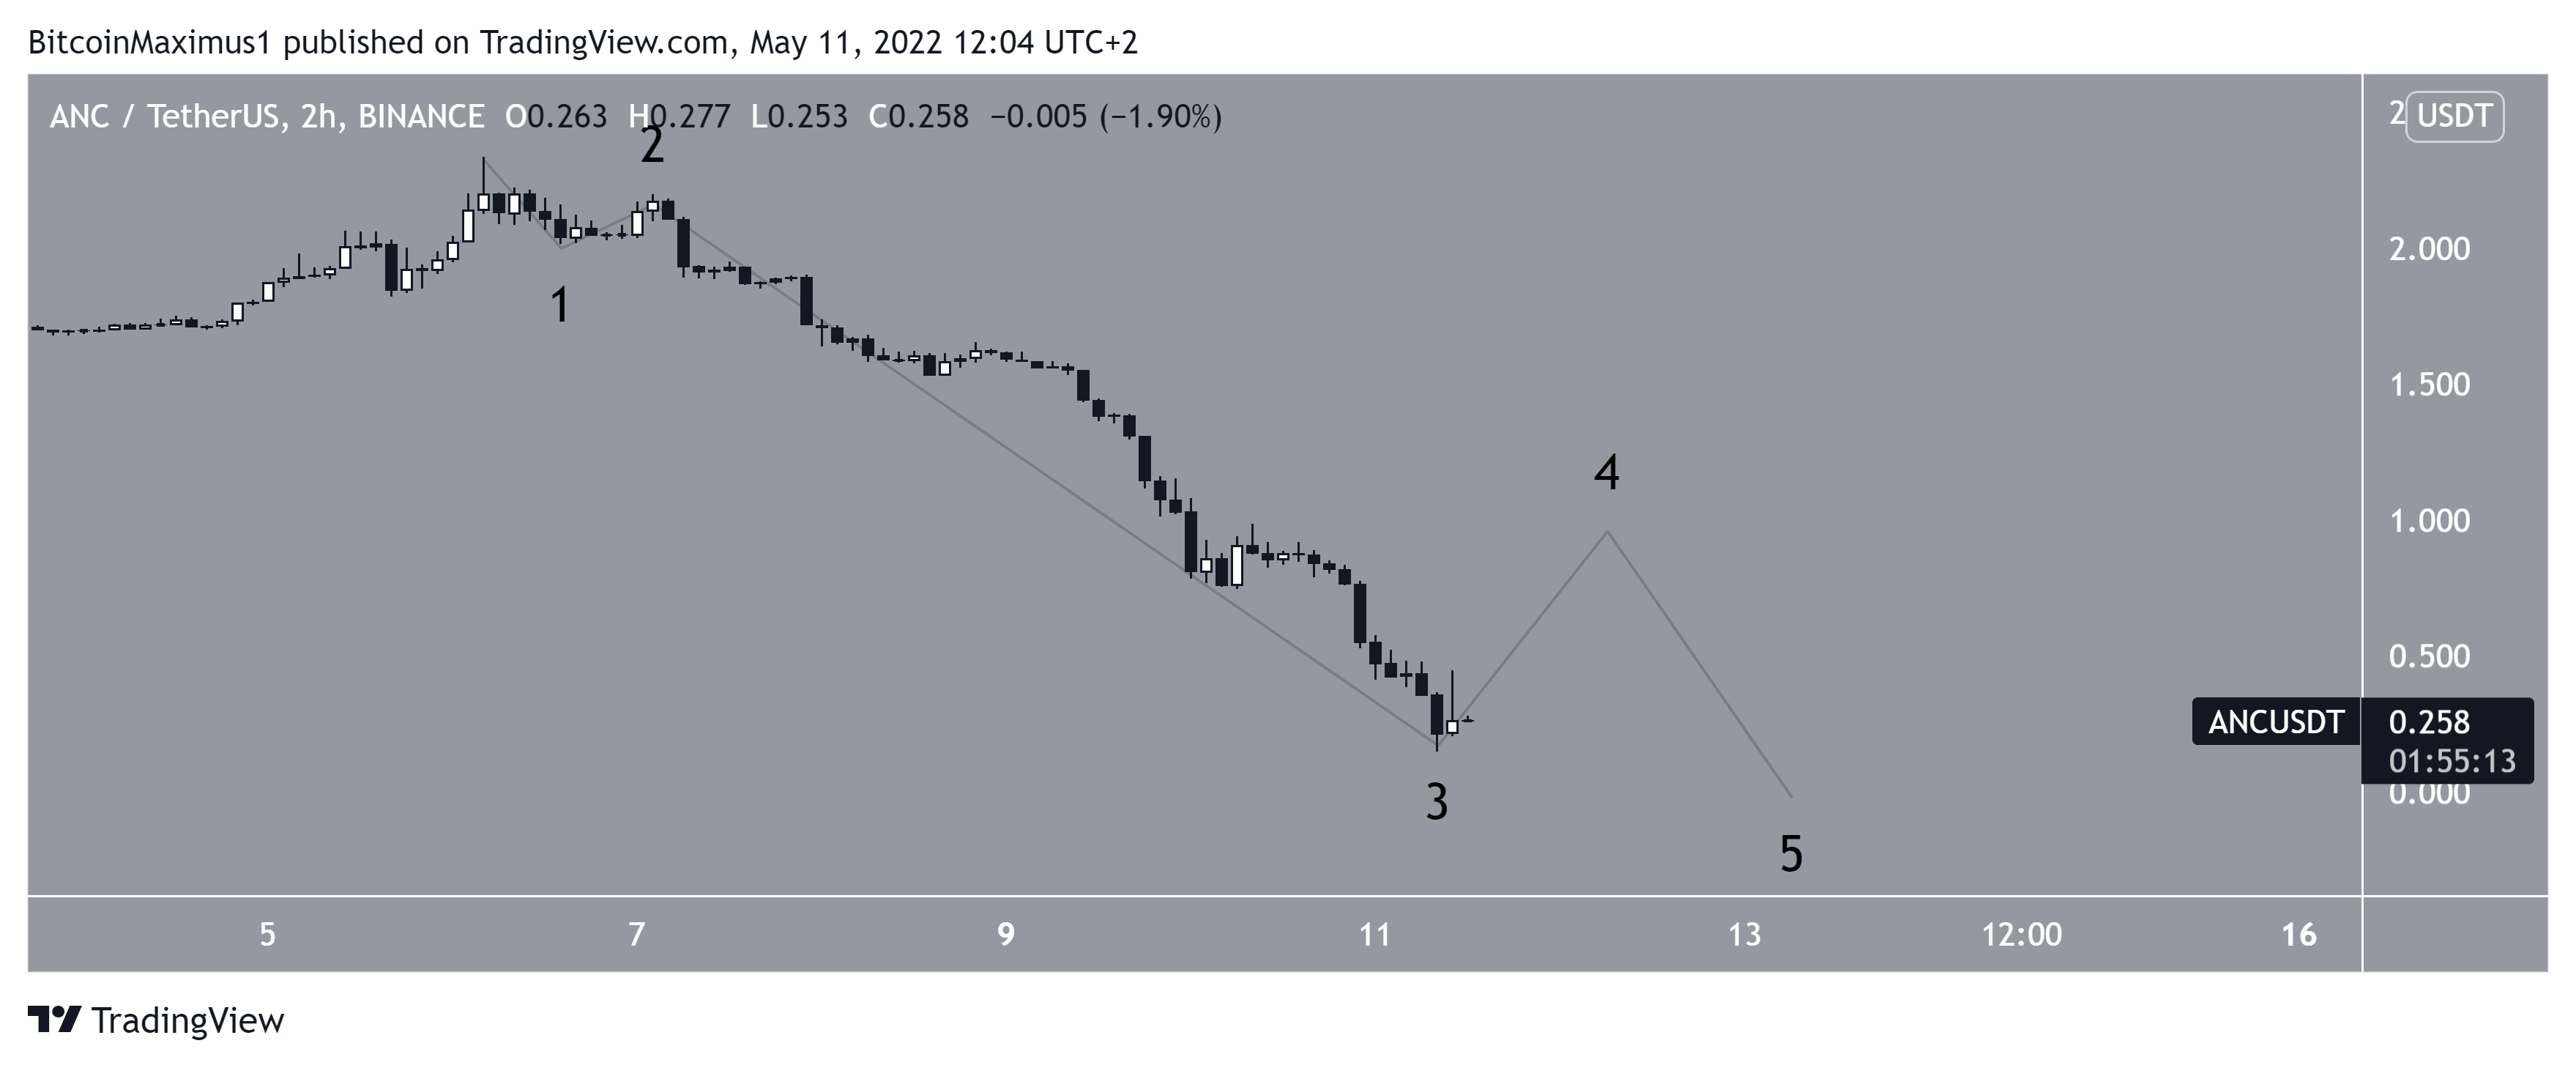
Wave count analysis
The wave count indicates that ANC is mired in a five-wave downward movement. In it, it has just completed a very extended wave three (black).
As a result, a significant bounce could occur.
So, the wave count is in alignment with the short-term readings and suggests that a bounce is likely.
For Be[in]Crypto’s latest Bitcoin (BTC) analysis, click here
