
The Bitcoin dominance rate has broken down below a long-term ascending support line, indicating that its two-year-long bullish trend has ended and the time has finally come for altcoins to increase at a faster rate than BTC.
Bitcoin (BTC) Highlights
- The Bitcoin price is trading inside a short-term range between $9650 and $9150.
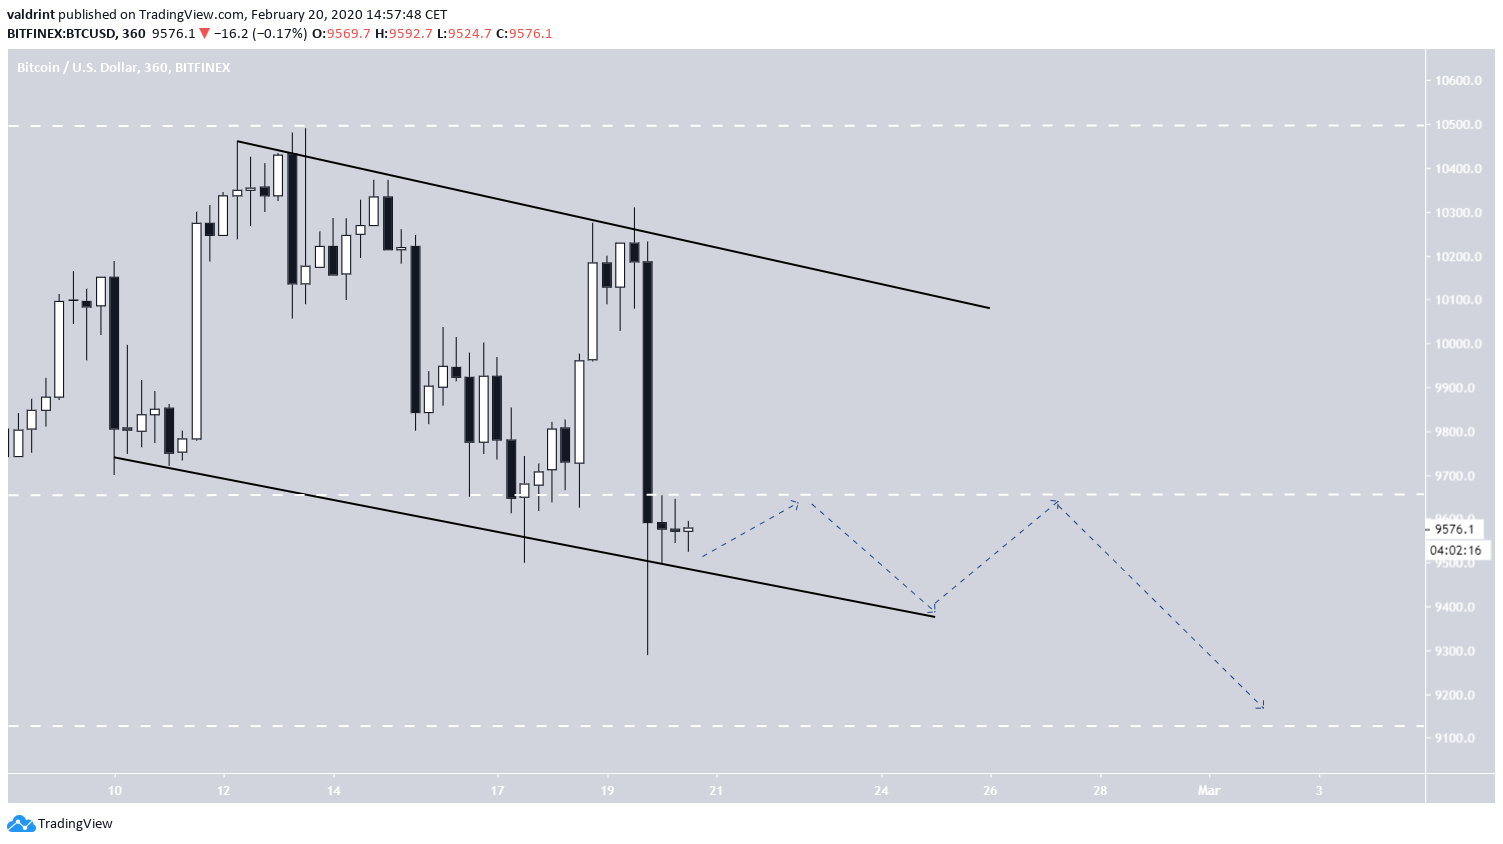
- It is trading inside a descending channel.
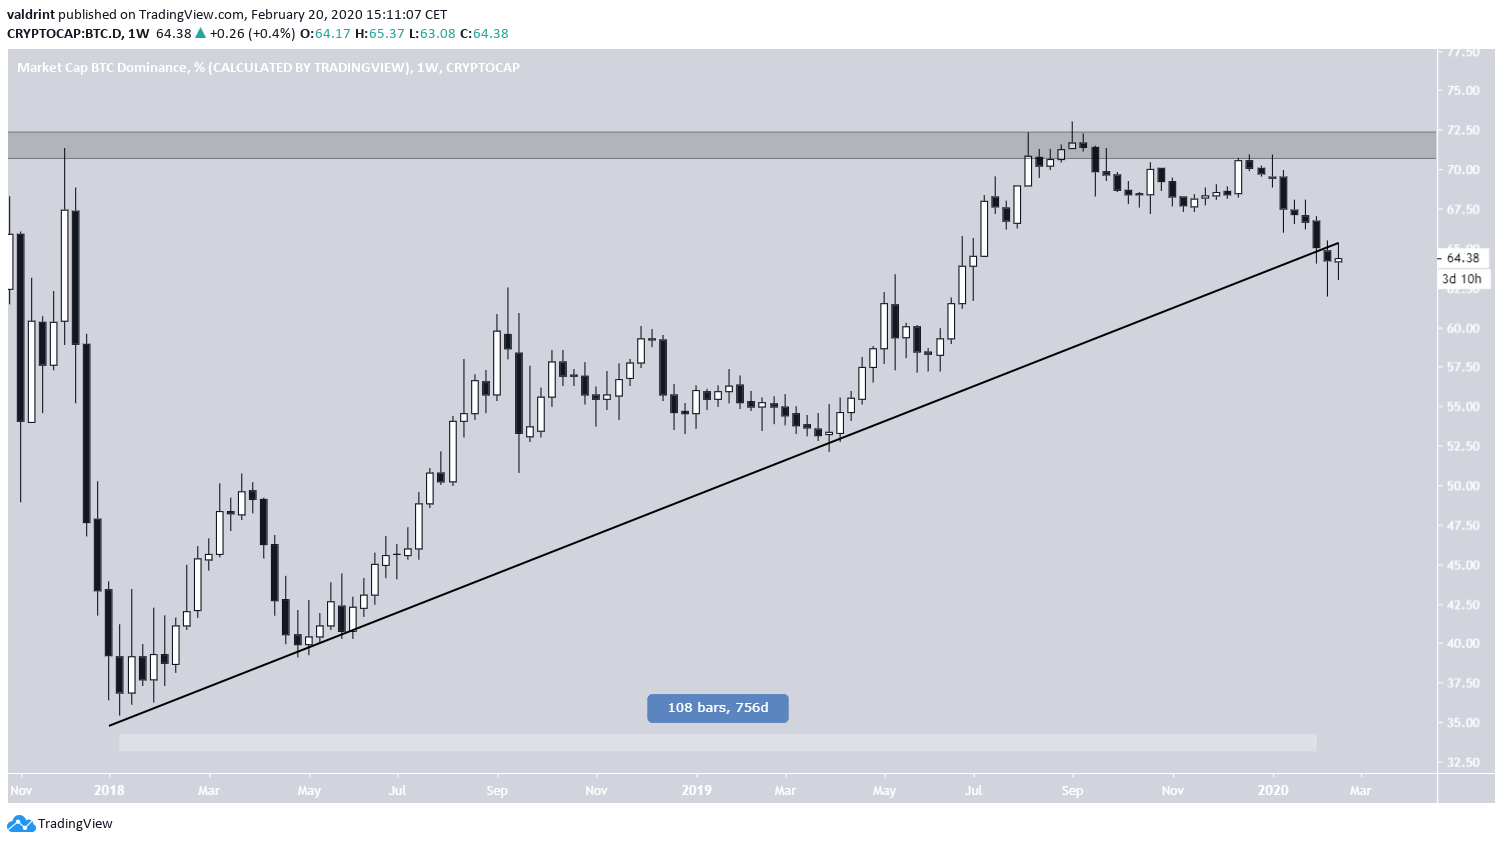
- The Bitcoin dominance rate has broken down below a very long-term ascending support line.
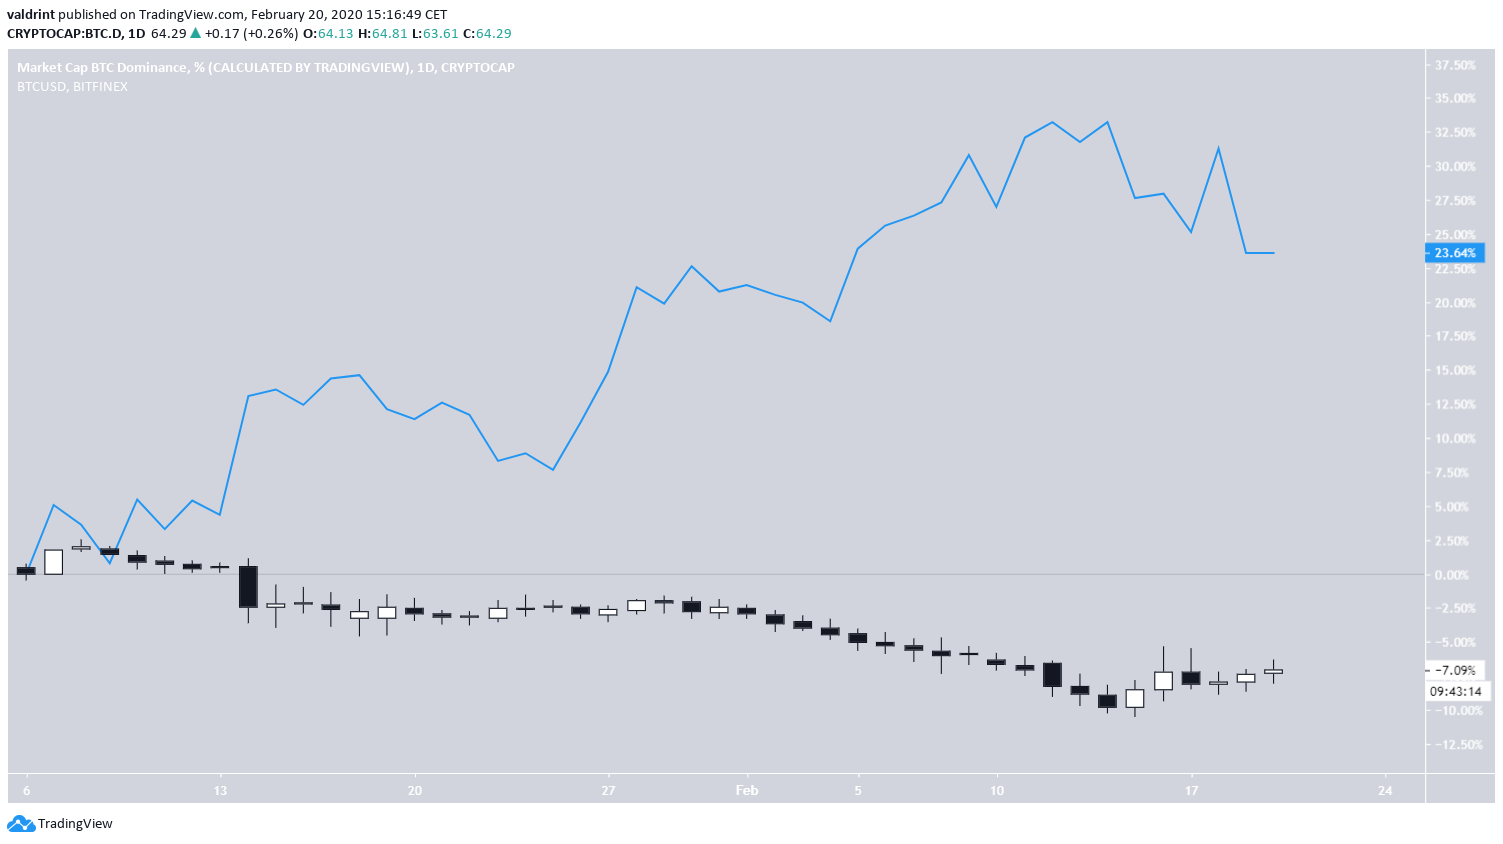
- The Bitcoin price and its dominance rate are having an inverse relationship.
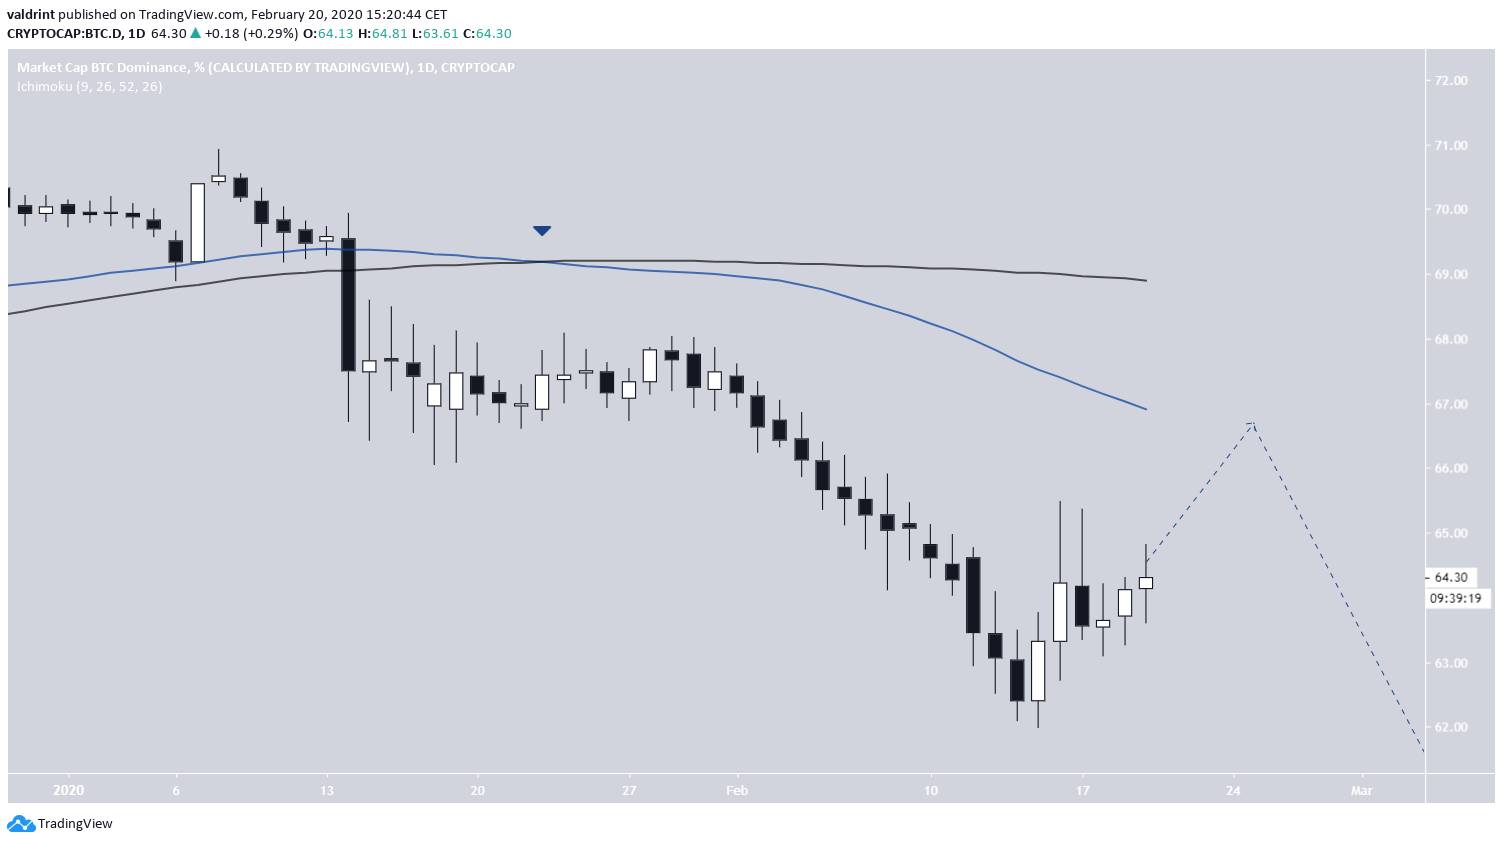
Bitcoin and altcoin trader @TheEuroSniper tweeted a Bitcoin dominance chart that shows a bounce at the ascending support line and the 62% level, giving a target of 68% for the ensuing increase. Since the Bitcoin price decreased significantly on February 19, we thought this would be a good time to take a look at both the Bitcoin price and its dominance rate.
Bounced from zone, targeting RED 67.5 area pic.twitter.com/hSUoxpN2Zv
— €uroSniper (@TheEuroSniper) February 16, 2020
Let’s take a look at both the Bitcoin price and its dominance rate and determine where they are heading to next, beginning with the price.
Trading Range
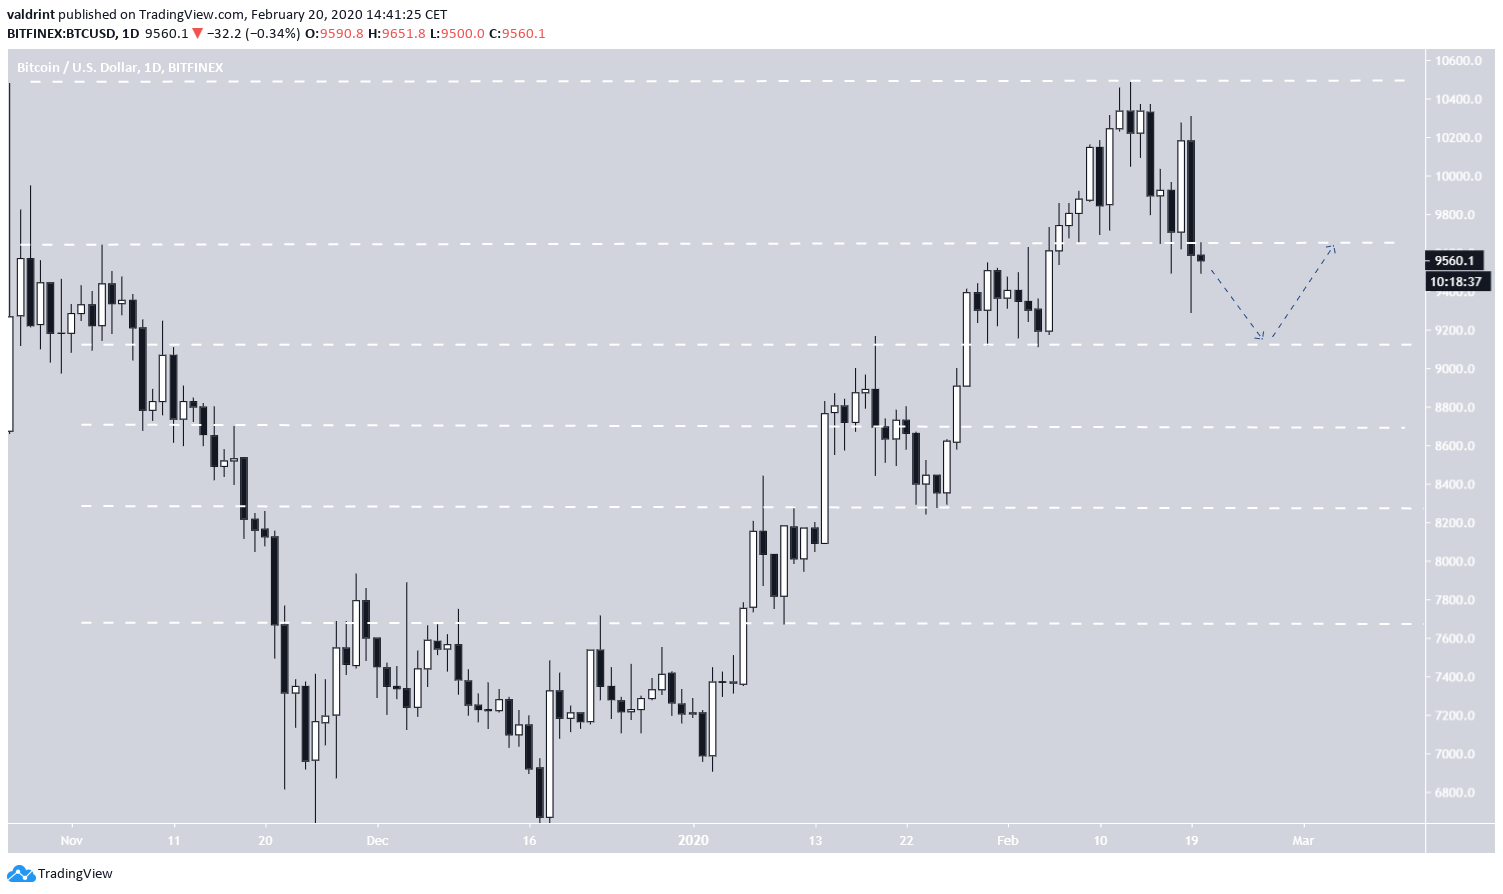
The Bitcoin price has been increasing since the beginning of the year. While the main resistance and support areas are found at $10,500 and $7700, there are several more key levels that we can outline, more specifically being at:
- $9650
- $9150
- $8700
- $8250
As long as the price is trading between two of these levels, it is likely to use them as resistance and support.
The February 19 price decrease caused the price to fall below the $9650 level, from which it is now possibly facing resistance.
In the near future, we are expecting the Bitcoin price to trade between these two areas. A breakdown below the $9150 support would flip this area as resistance and make $8700 the new support, while a breakout above $8650 would do the opposite, making $10,500 the new resistance area.
In the short-term, the price is trading inside a descending channel. If the price continues trading inside this channel, it will gradually decrease until it reaches the $9150 support level.
Now, let’s take a look at the dominance chart and see where it is heading to.
Bitcoin Dominance
The Bitcoin dominance rate had been following an ascending support line for 756 days before finally breaking down last week.
The current price movement looks like a validation of the resistance line before the price heads lower.
The Bitcoin price and its dominance rate have had a negative relationship in 2020, meaning that if the price rises, its dominance rate falls and vice versa. Since the Bitcoin price has been increasing in 2020, this has caused the dominance rate to fall as a result.
Therefore, if the aforementioned Bitcoin price decrease occurs, the dominance rate could increase all the way to 68%, as evidenced in the tweet.
This would also serve to validate the 50-day moving average (MA), which as previously made a bearish cross with the 200-day MA, otherwise known as a death cross.
However, we are expecting the dominance rate to decrease afterward, which could mean that the price will increase as a result.
To conclude, the Bitcoin price is trading inside a descending channel, aiming to reach the support area at $9150. The dominance rate has possibly ended a two-year upward trend and will head to new lows, after a possible short-term increase.
