


Polygon’s (MATIC) price has risen 10% following Bitcoin’s surge yesterday, leading to the discovery of a key resistance level.
Can MATIC recover from its 40% drawdown since its March 2024 local peak?
MATIC Price and Ichimoku Cloud Insights
Polygon price is nearing entry into the daily Ichimoku cloud, a typically bullish signal. The Ichimoku cloud analysis suggests potential upside movement, as price action within the cloud often indicates a trend reversal or continuation.
An upside penetration of the daily Ichimoku cloud signifies strong bullish momentum. If the price breaks the 0.618 Fibonacci level, it could imply further upside levels that intensify the bullish momentum, with a price target set at $0.99.
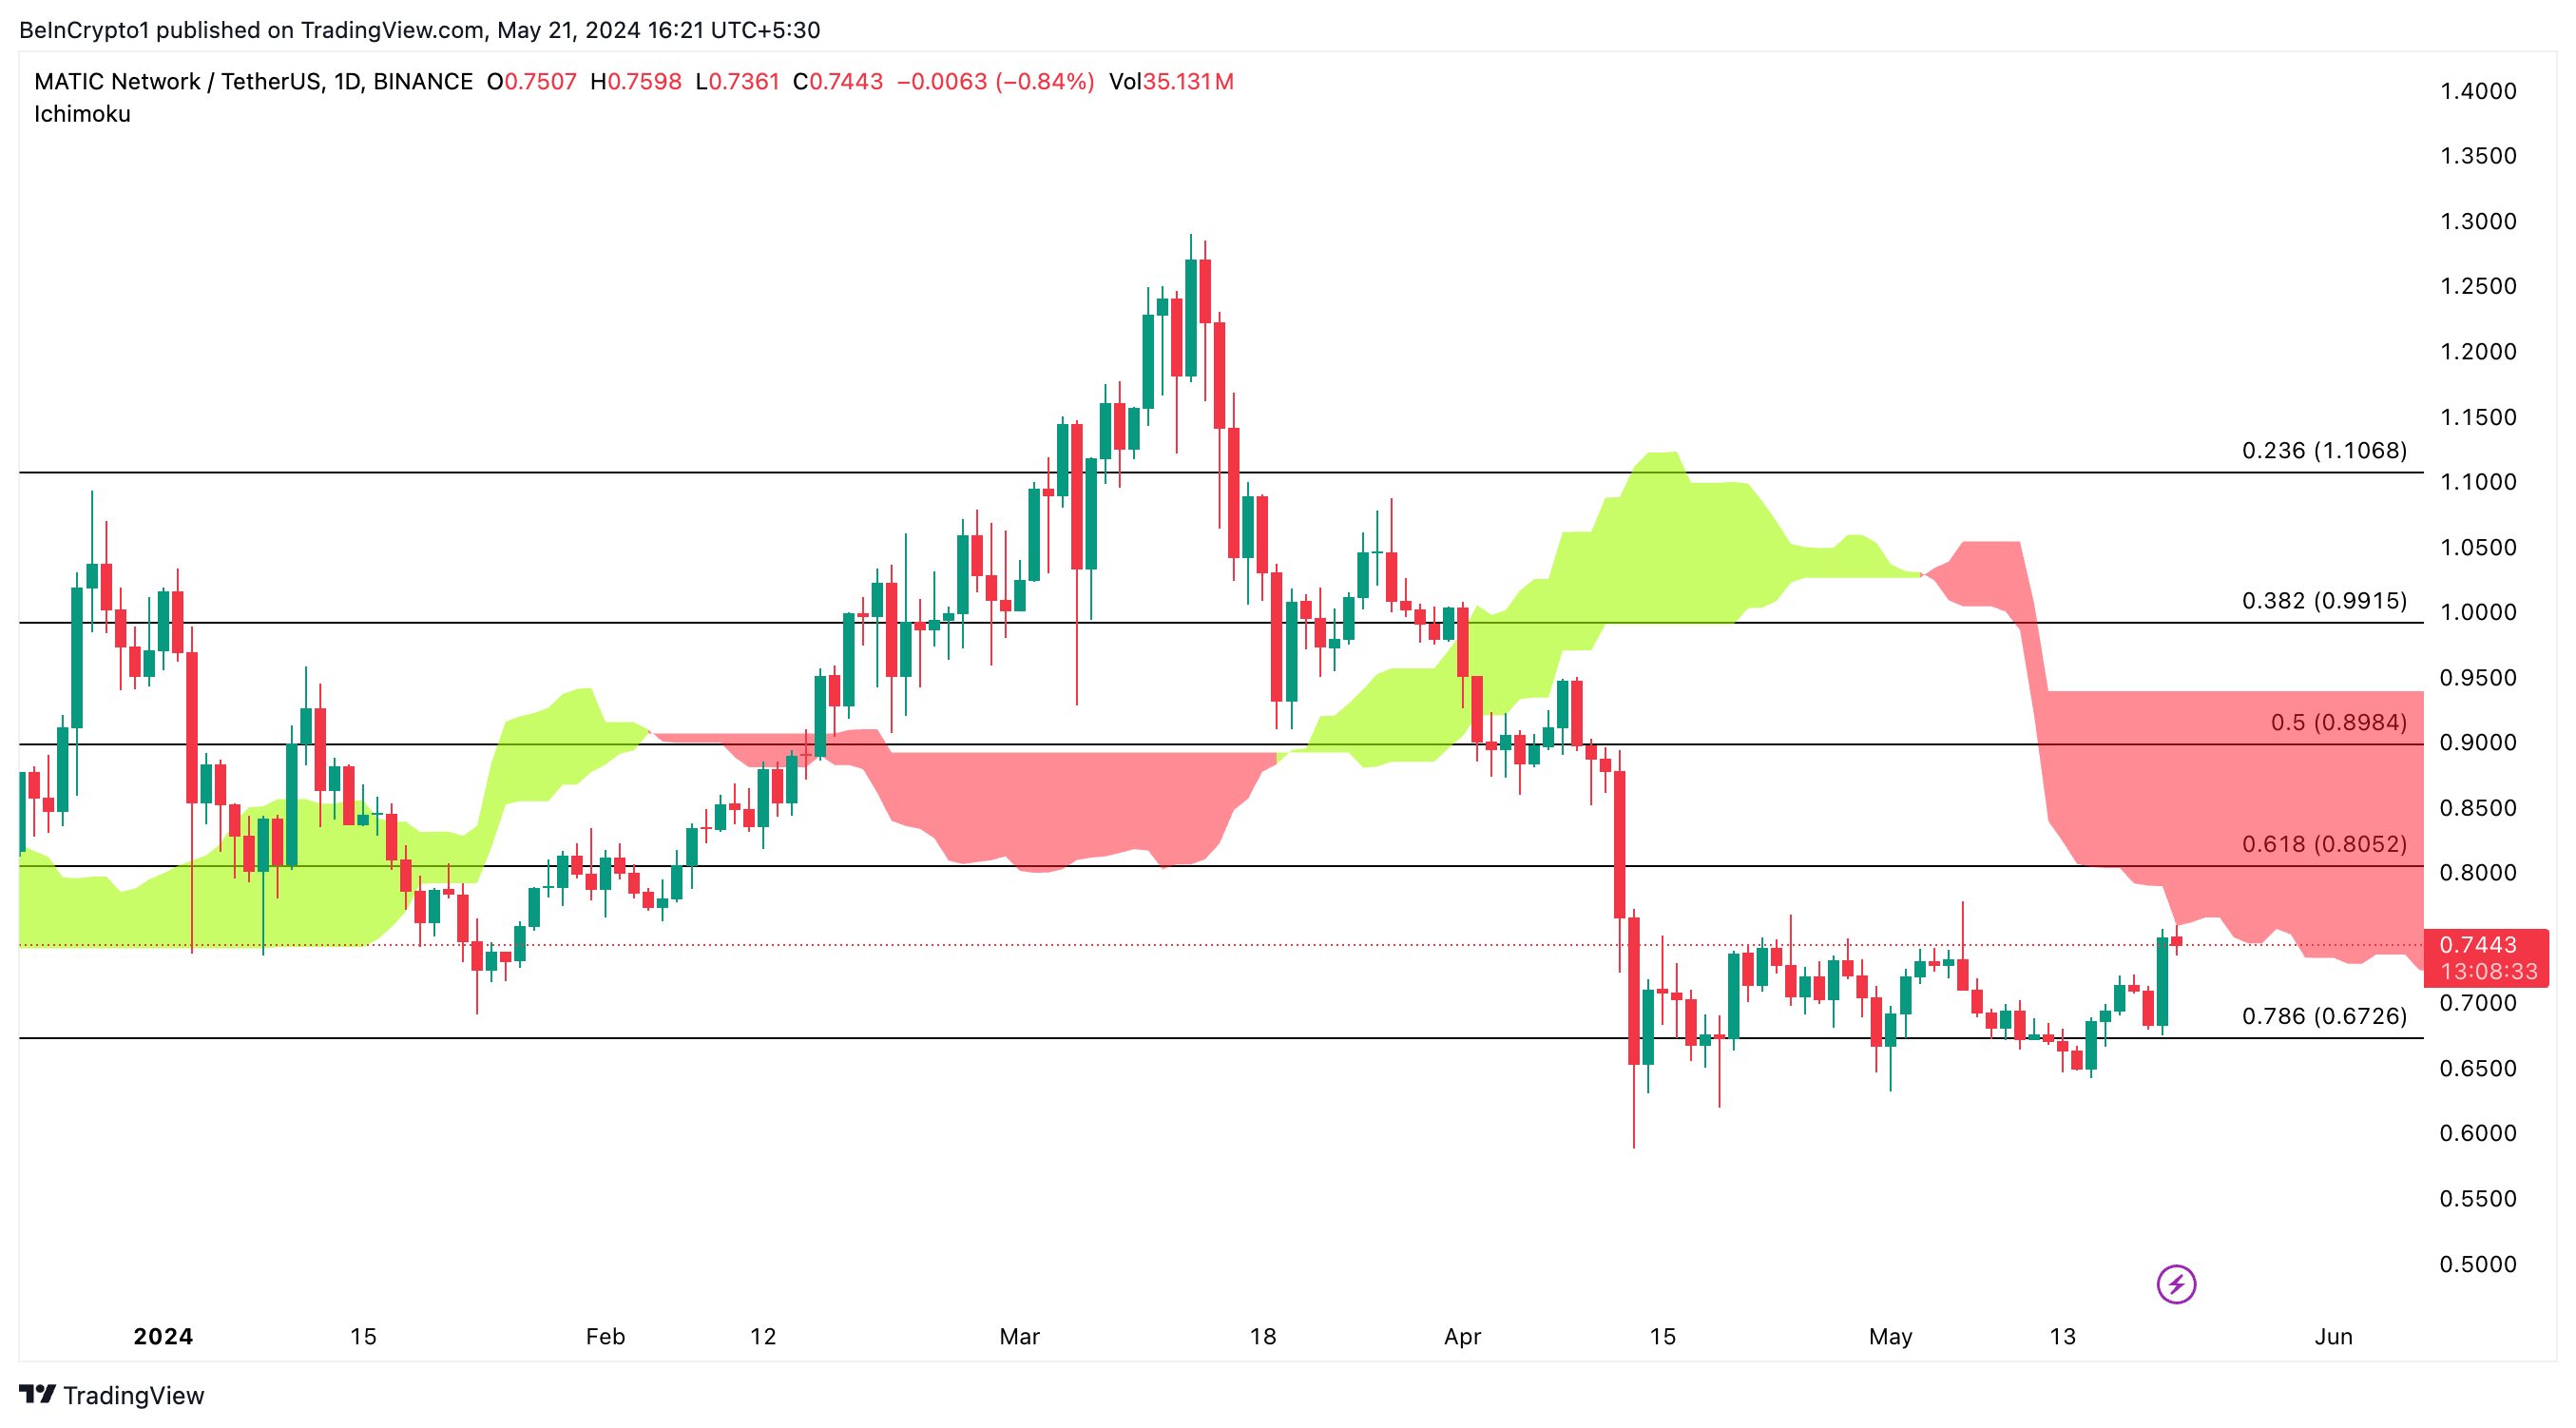
Key Fibonacci Levels include the $0.67 level, which serves as strong support; the 0.618 level at $0.80, marking potential resistance; the 0.5 level at $0.89 as key resistance; the 0.382 level at $0.99, indicating further resistance if upward movement continues; a significant resistance level in a bullish scenario.
Increasing Addresses with Non-Zero Balance:
The number of MATIC addresses with a non-zero balance steadily increases, indicating robust network growth and adoption.
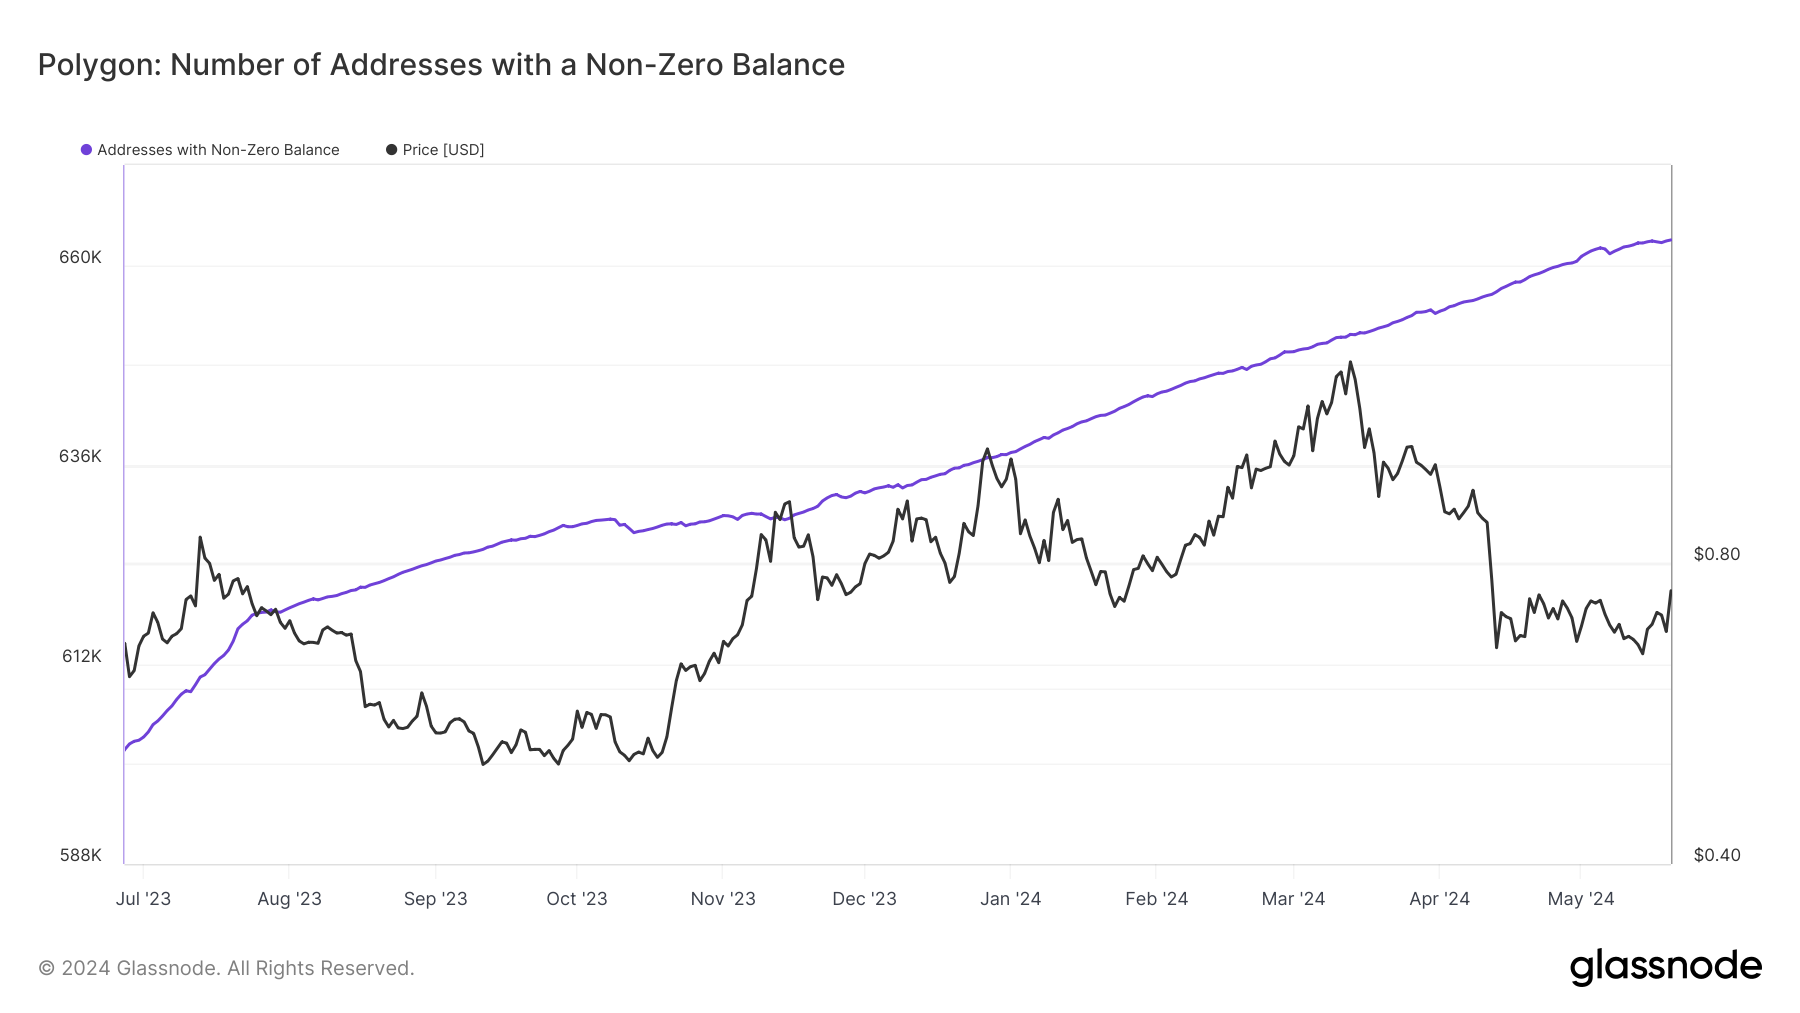
This trend signifies a healthy and expanding user base for MATIC.
Growth in Unique Addresses:
The Polygon network continues to see a rise in unique addresses, reflecting sustained interest and user participation.
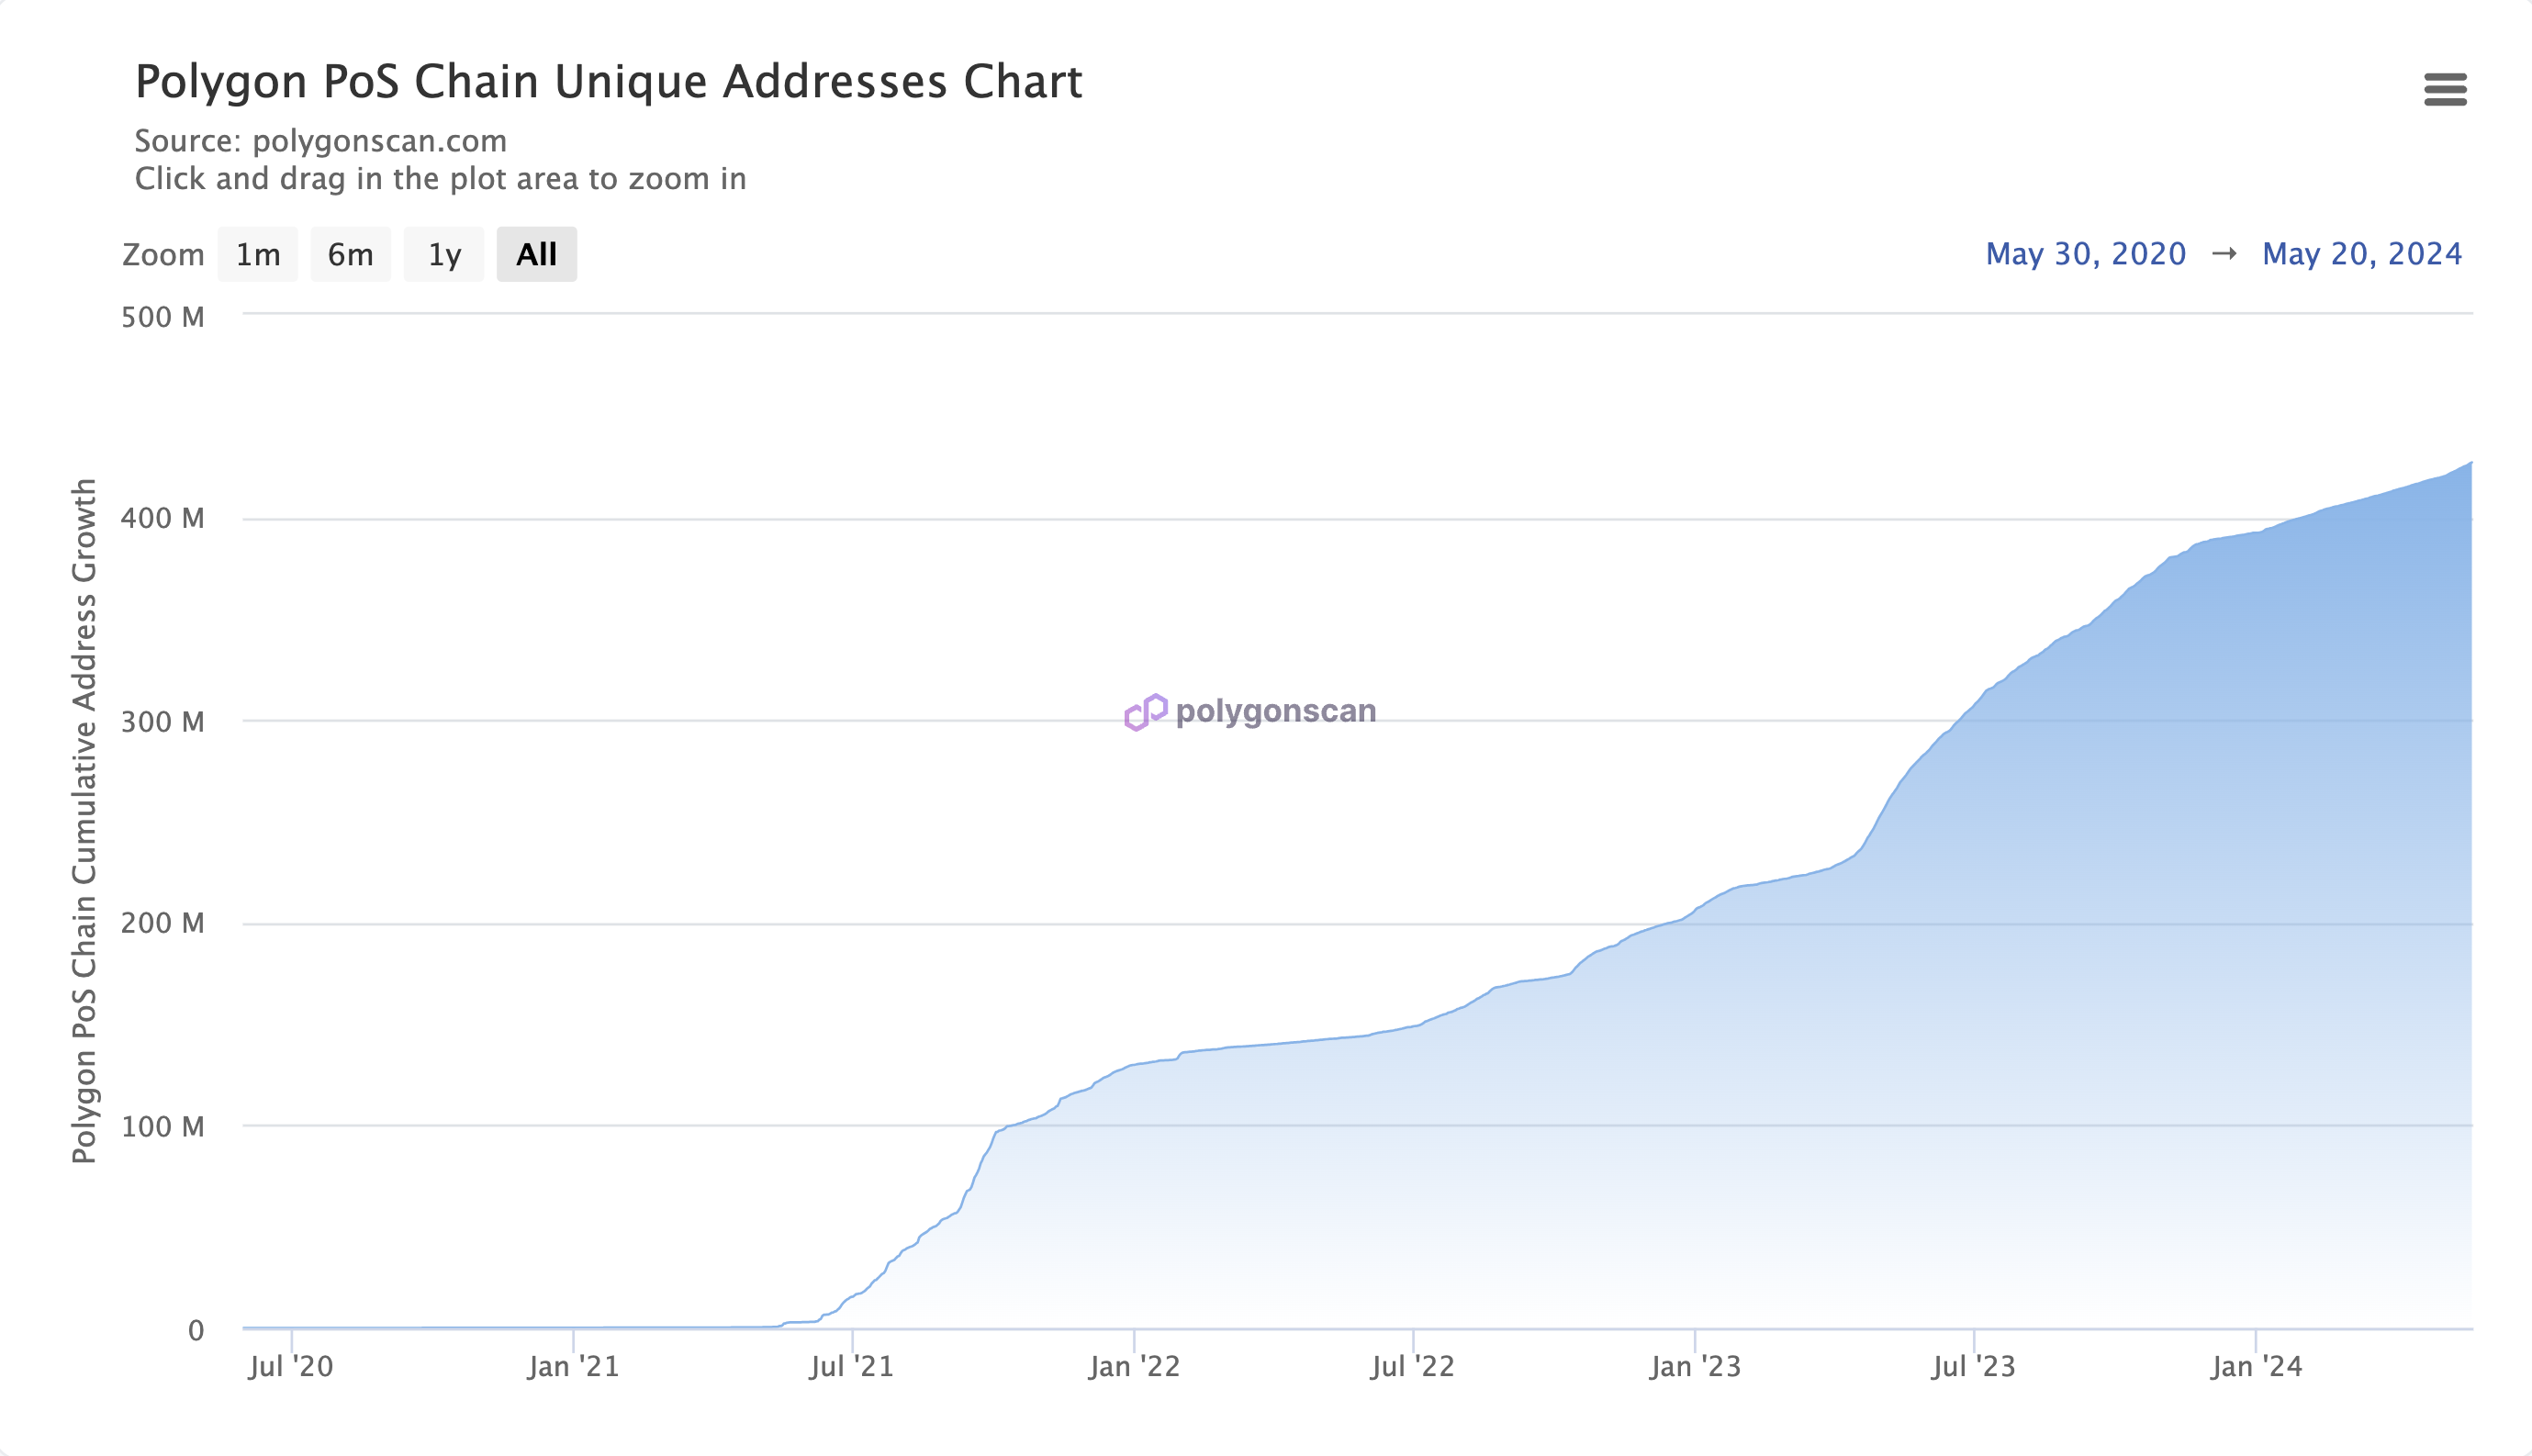
This growth is a positive indicator of MATIC’s long-term potential.
Consistent Daily Transactions:
The daily transaction chart shows significant activity on the Polygon network, with notable spikes indicating periods of high usage.
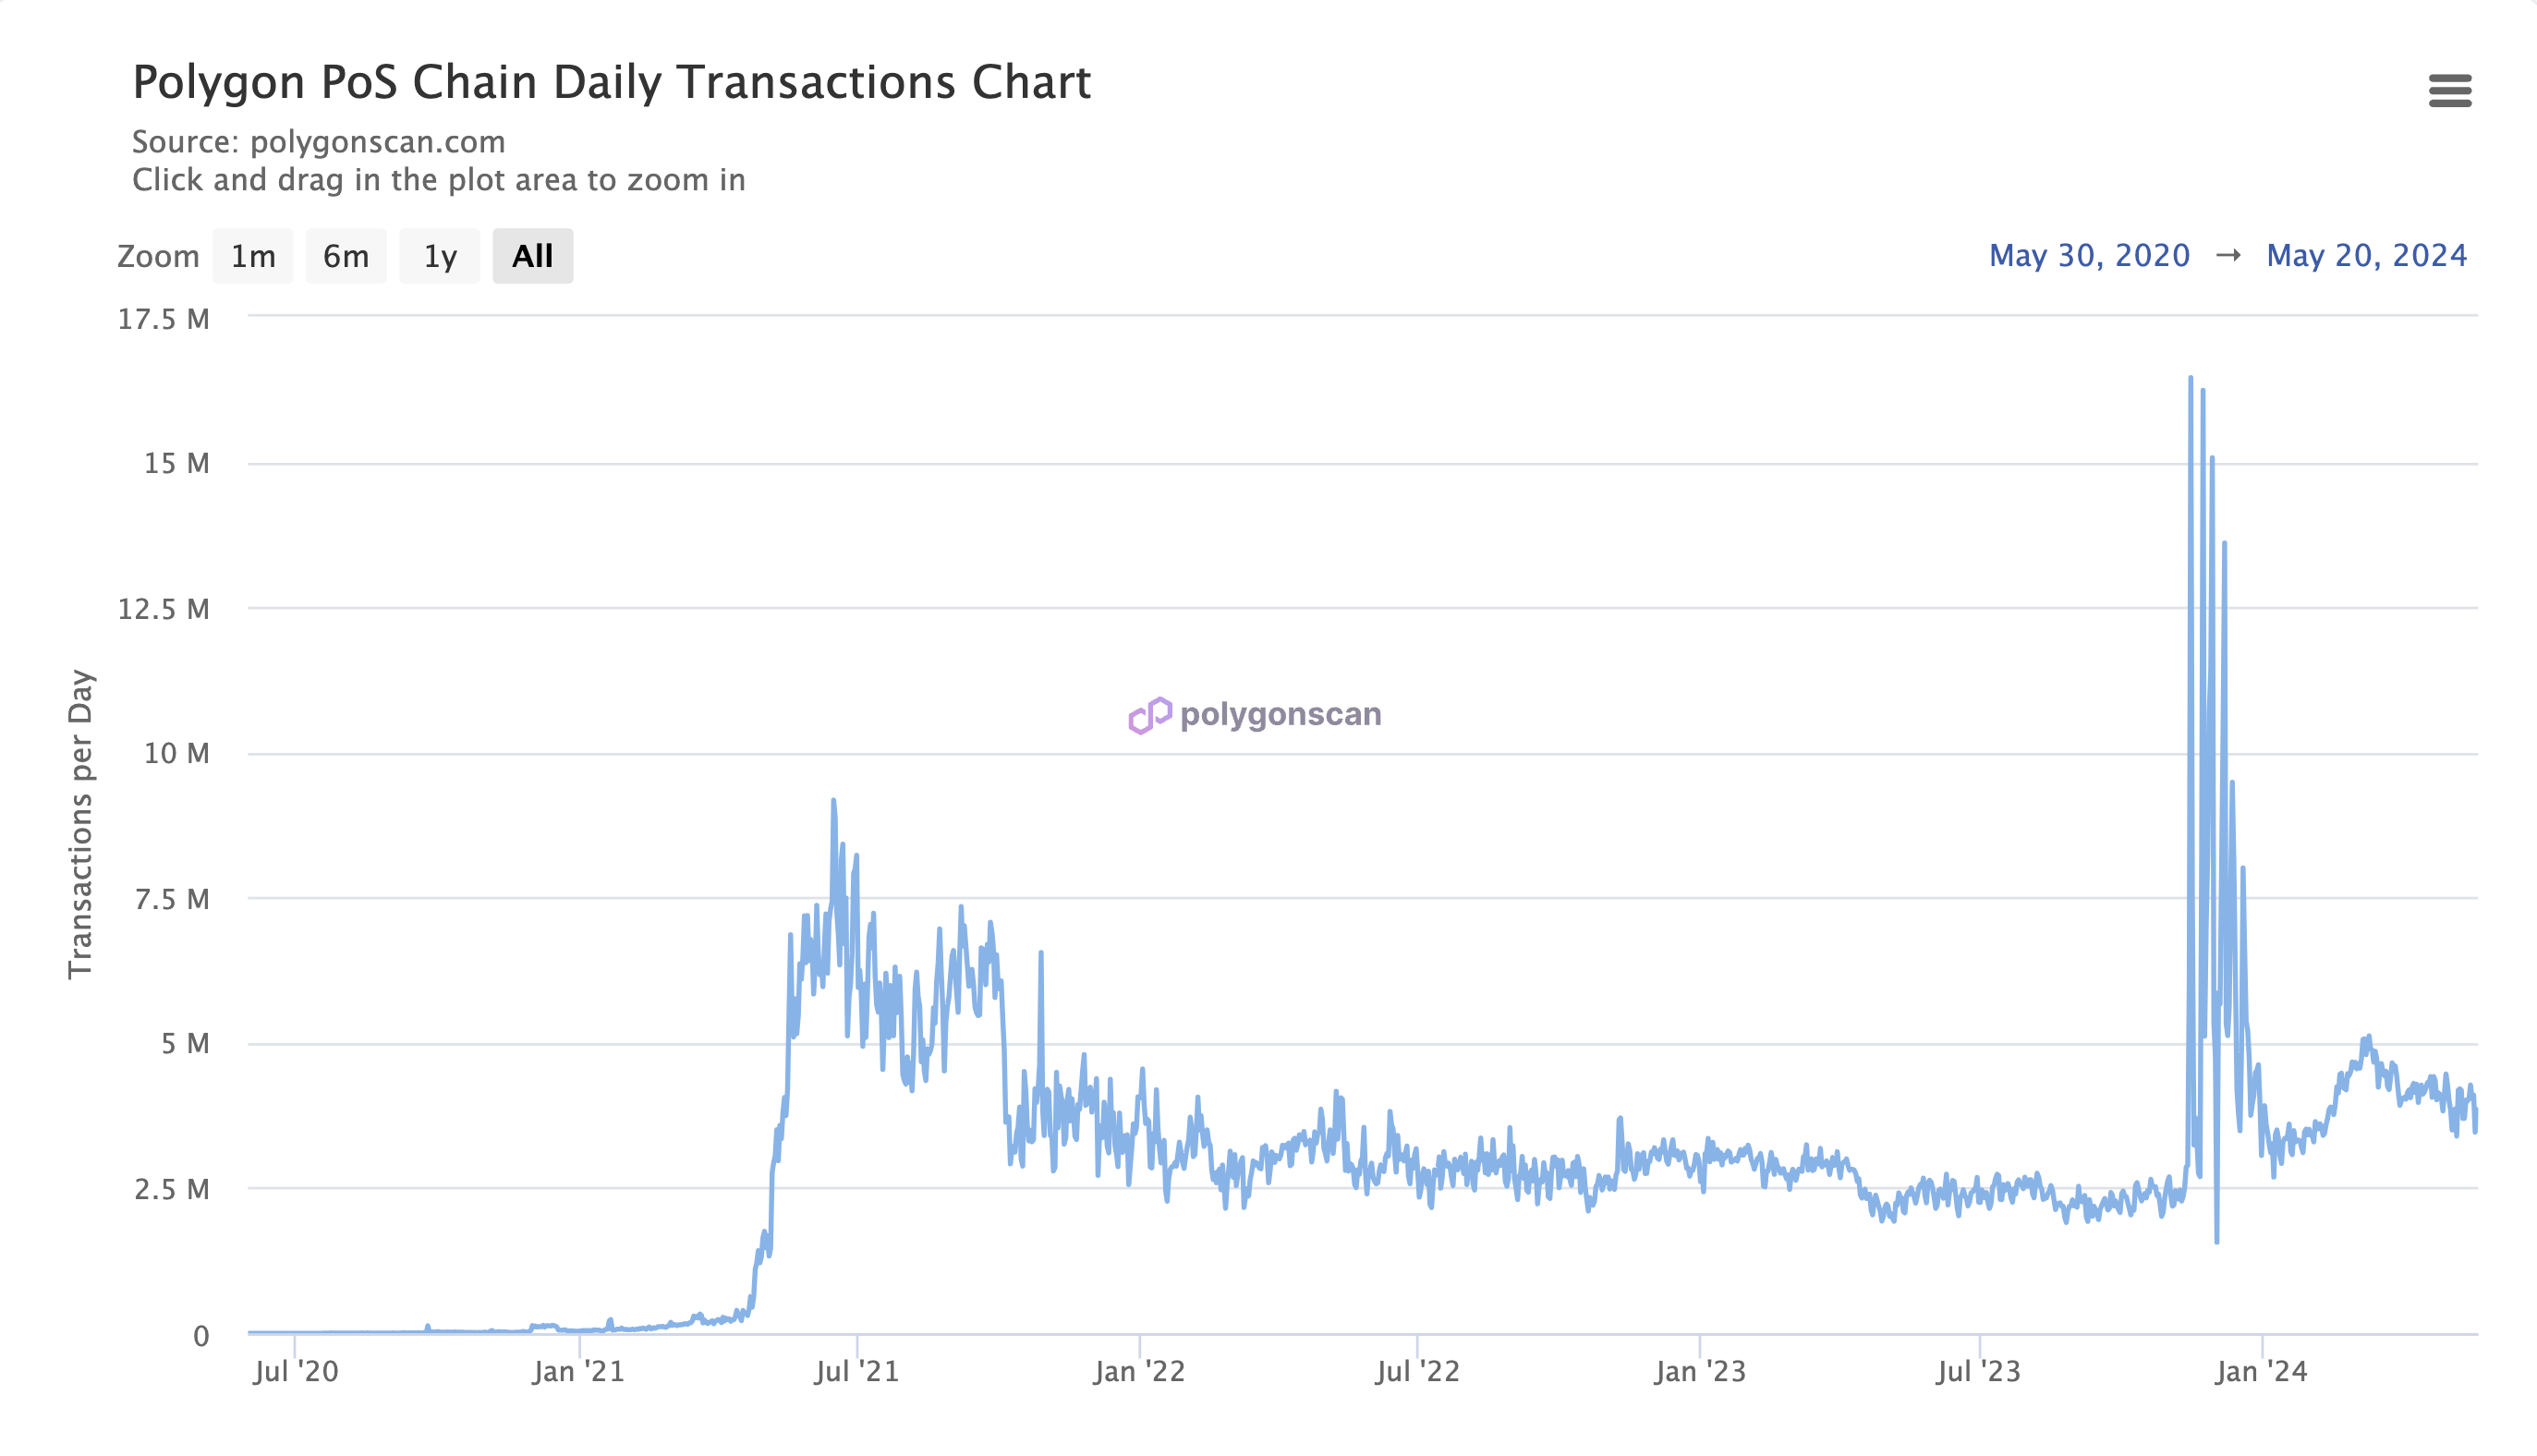
Sustained transaction volume supports the case for MATIC’s price appreciation, as it reflects an active and engaged network.
Strategic Recommendations and Price Projections
Bullish to Neutral Outlook for MATIC:
Target Level at $0.8052: If MATIC enters the daily Ichimoku cloud, the initial target is $0.8052, a significant resistance level.
Potential for Major Price Appreciation: Breaking above $0.8052 could trigger further price increases, targeting $0.8984, $0.9915, and beyond.
Downside Risk: If MATIC tests and fails to hold the lower boundary of the Ichimoku cloud, it could lead to a bearish exit, negating the bullish outlook and leading to further declines.


