


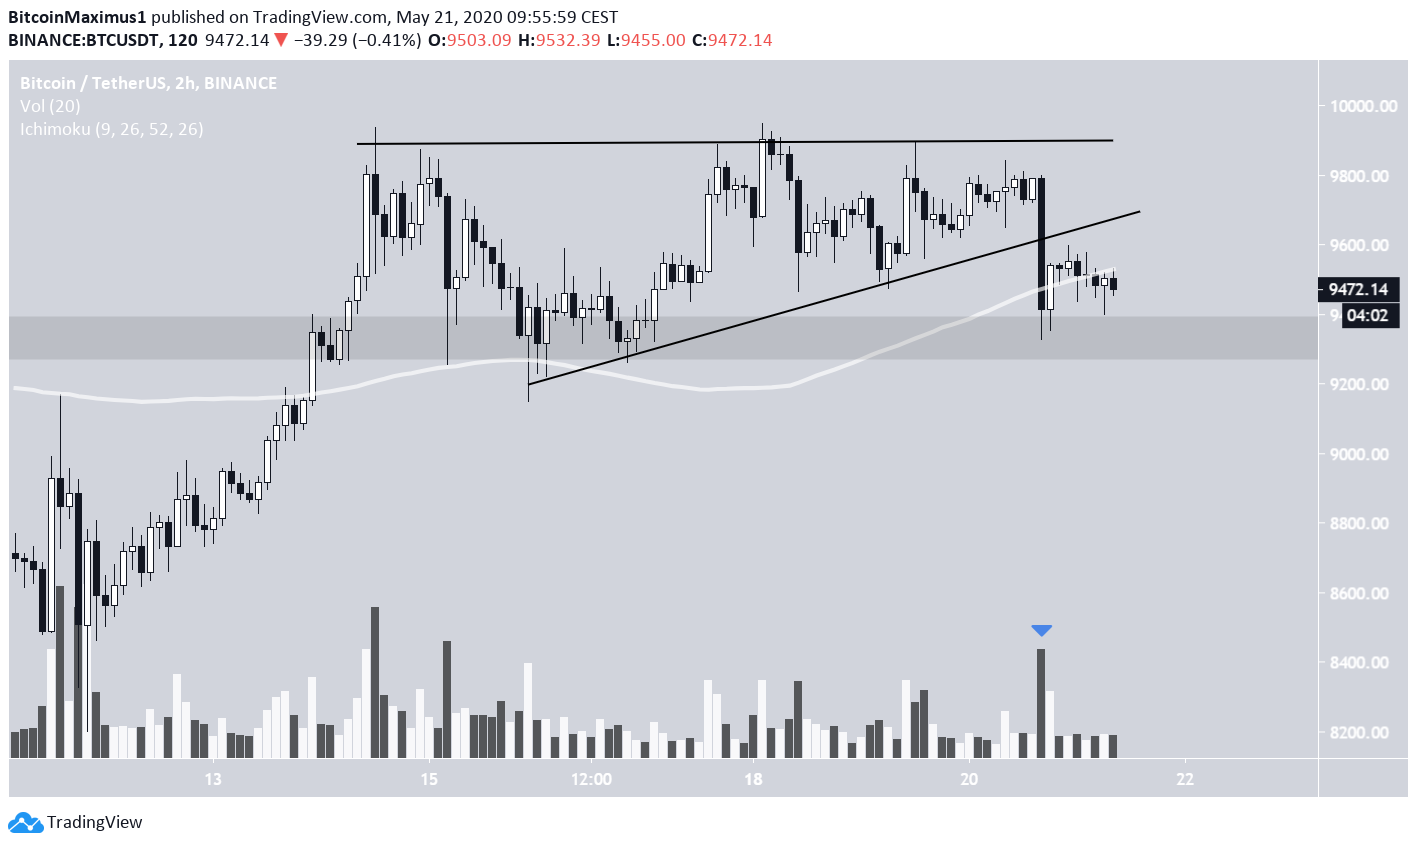
On May 20, the Bitcoin price broke down from an ascending triangle it had been trading in over the past week.
The ensuing upward movement failed at the first resistance level, suggesting that the price is not yet done correcting.
Bitcoin Breakdown
On May 20, the Bitcoin price broke down from an ascending triangle it had been trading inside since May 20. The breakdown occurred with considerable volume, increasing its legitimacy.
Since breaking down, the Bitcoin price found support at the $9,350 area and has been gradually retracing since. However, the price has lost the support of the 200-hour moving average (MA) — a bearish development.
Based on this time-frame, the price is retracing after the sharp drop, and any price increase should be considered as such.
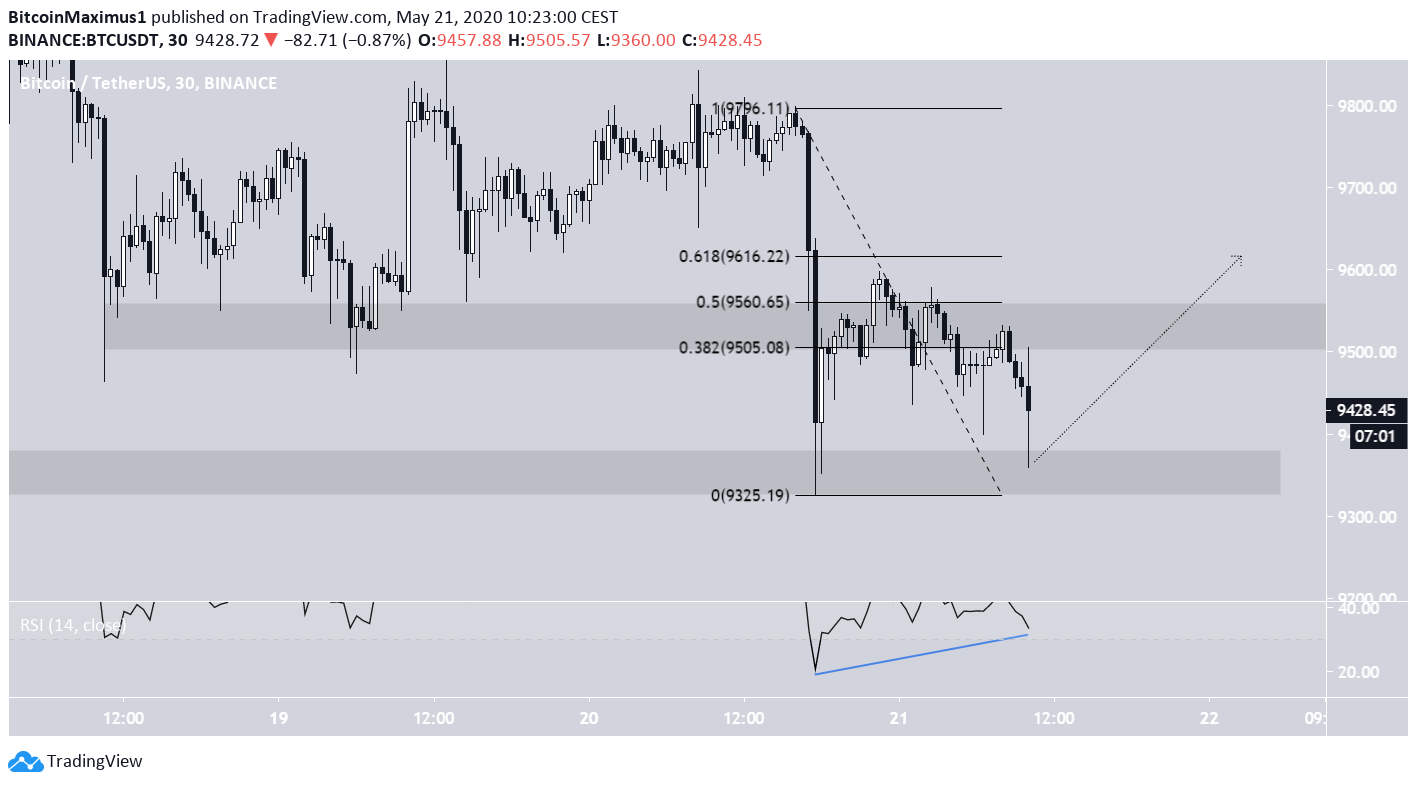
In the shorter-term, we can see that the retracement failed between the 0.5-0.618 Fibonacci levels near $9,600, which is a common level for retracements to end.
After decreasing, the price seems to be in the process of generating a double-bottom near the original support level of $9,350. This double-bottom is combined with a bullish divergence in the RSI, increasing the possibility that the pattern will be successful and the price will move upward towards the 0.5-0.618 Fib levels once more.
Double-Top
Moving back to a longer-term chart, we can see that prior to breaking down, BTC created what looks like an ‘Adam and Eve’ double-top, which is considered a bearish reversal pattern. Furthermore, the pattern was combined with a bearish divergence in the RSI.
If the price breaks down, the closest support level would be found at $8,600. Interestingly, projecting the height of the pattern to the breakdown level gives us the same target.
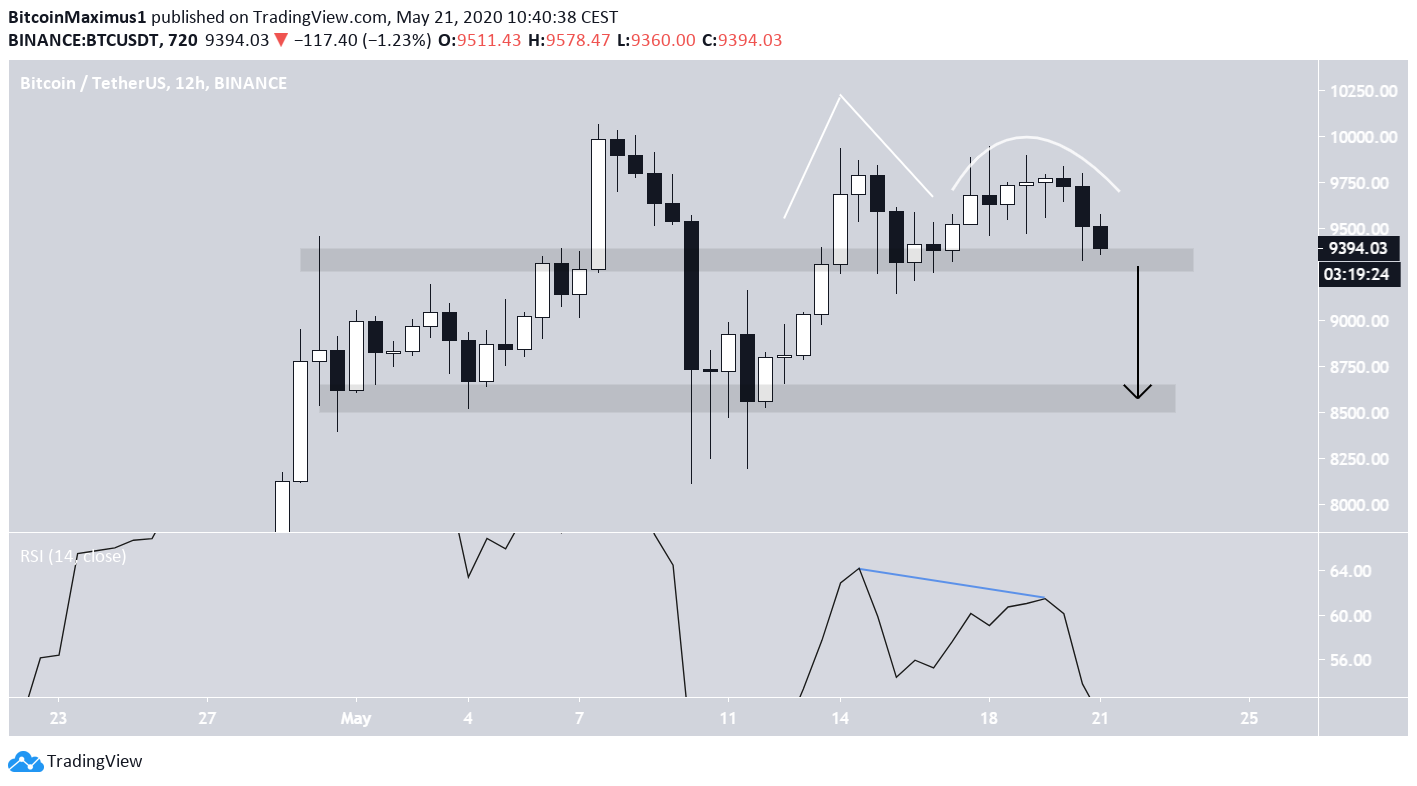
To conclude, the Bitcoin price has completed a bearish reversal pattern and is in the process of breaking down. If it does, the closest support level would be found near $8,600.
For those interested in BeInCrypto’s previous Bitcoin analysis, click here.


