The Bitcoin price reached a bottom on March 13, while oil did so on April 22. Since then, both assets have been moving upwards at a similar pace.
While we have previously looked at the correlation between Bitcoin and the S&P 500, we have not done the same for oil. The oil chart was put forth by full-time futures trader @Adammancini4, who stated that the price has been creating a bullish reversal pattern and could soon move higher at an accelerated pace.
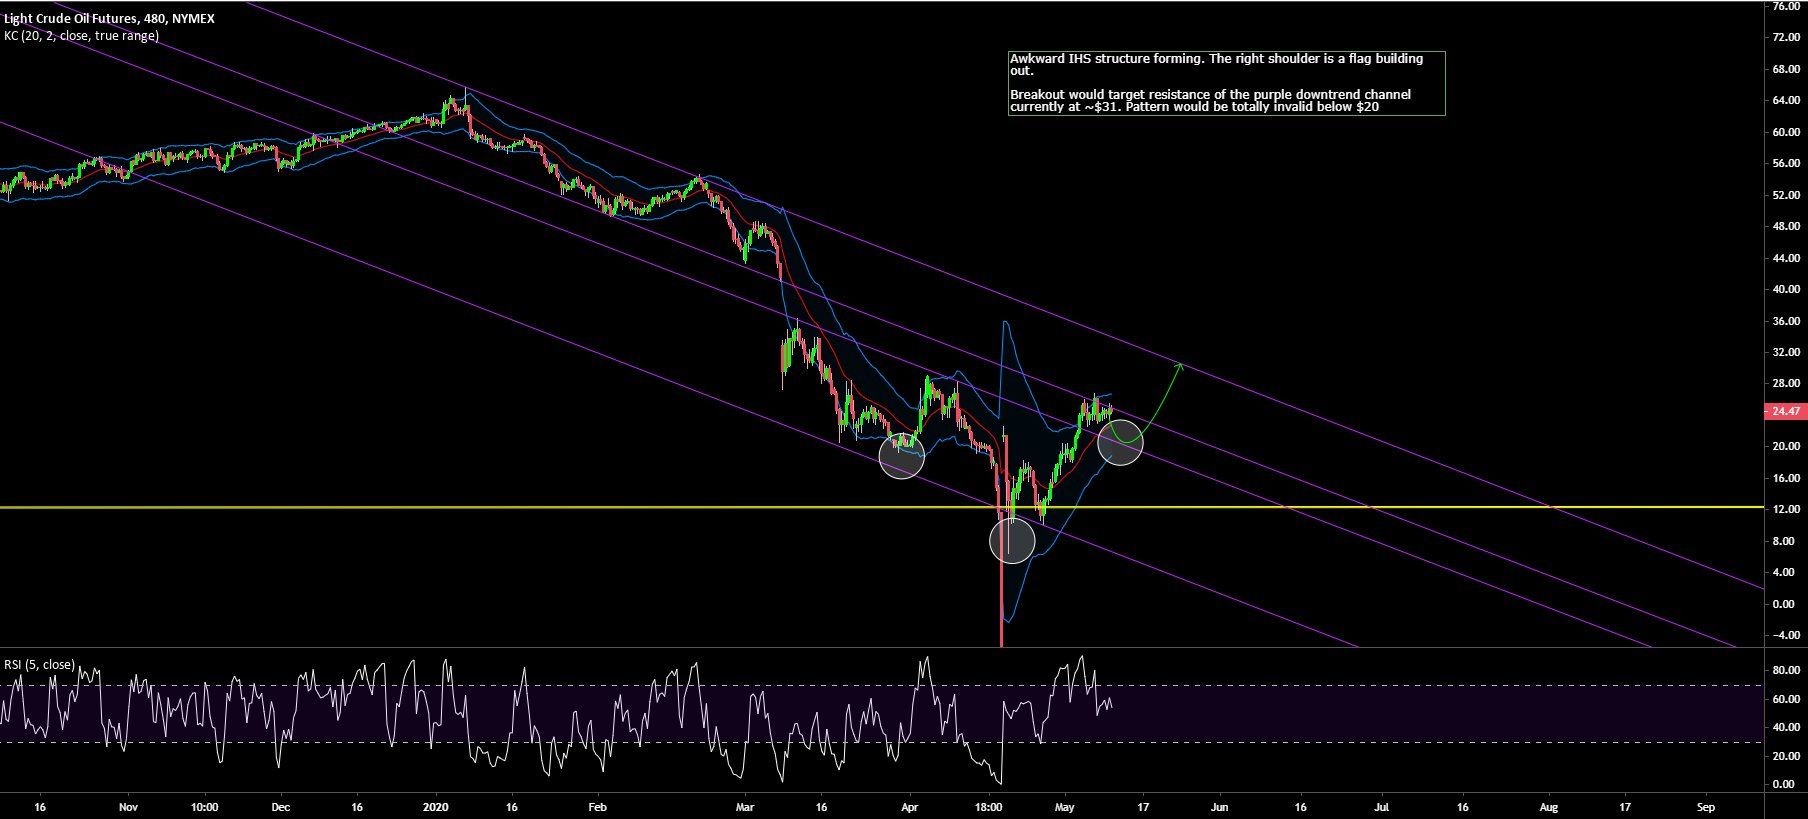
He also praised the strength of the recent recovery, stating:
It’s been an incredible recovery for $OIL with June contracts up 295% in 3 weeks — a recovery few predicted, which is exactly how the market likes it. More may be ahead — it’s in the process of forming a 2-month inverse head & shoulders base which opens a push back up to $30.
In this article, we will take a closer look at the oil and BTC charts in order to determine if any correlation exists between the two assets.
Side-By-Side Comparison
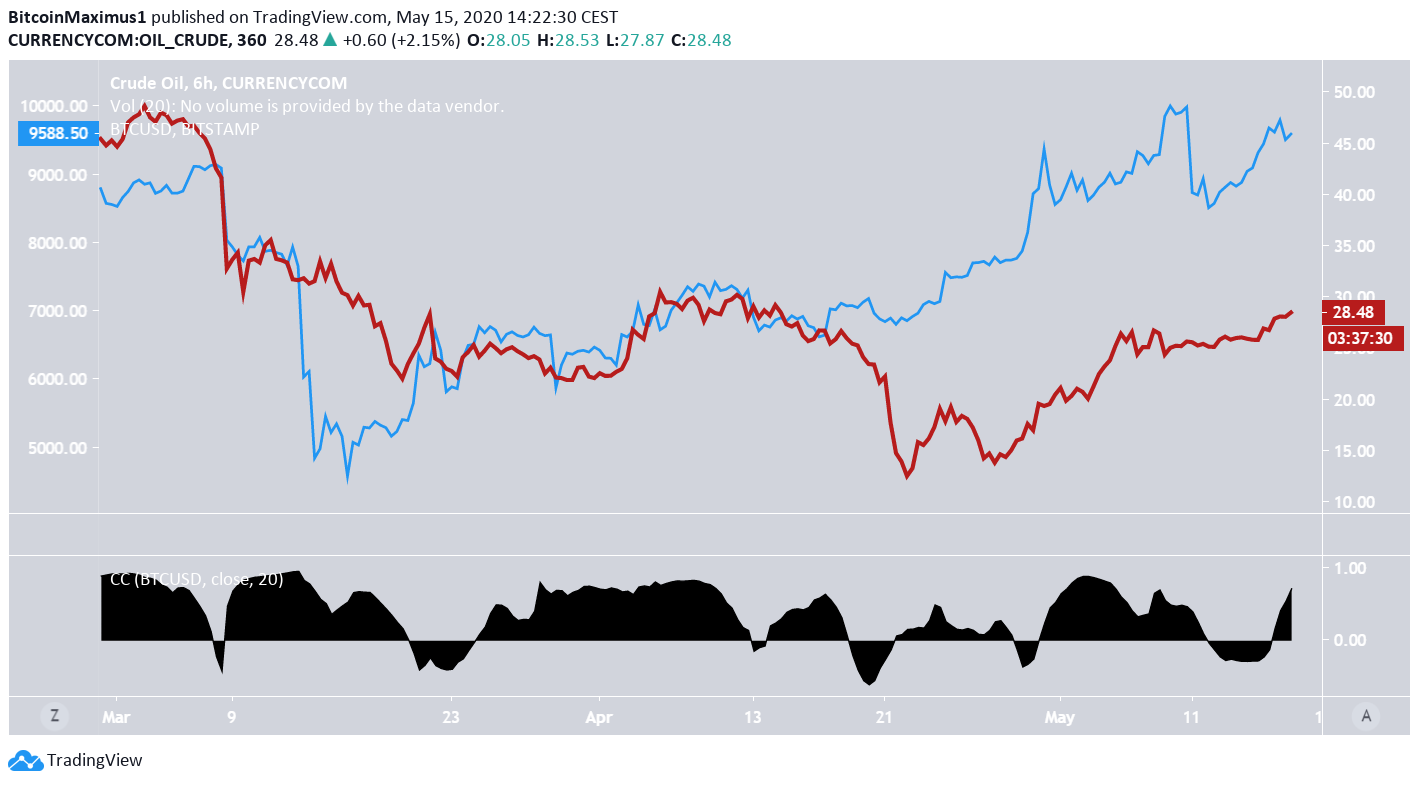
The price of oil (red) and Bitcoin (blue) are shown in the chart below.
Since the beginning of March, the prices of both assets have been positively correlated. However, while BTC reached a low on March 13 and has been increasing since, oil did the same on April 22.
Furthermore, as shown by the correlation coefficient indicator, the correlation has not always been perfect and in some cases has even been negative. This has been especially prevalent during each respective bottom. However, since oil reached a bottom on April 22, both assets have been increasing at a similar rate.
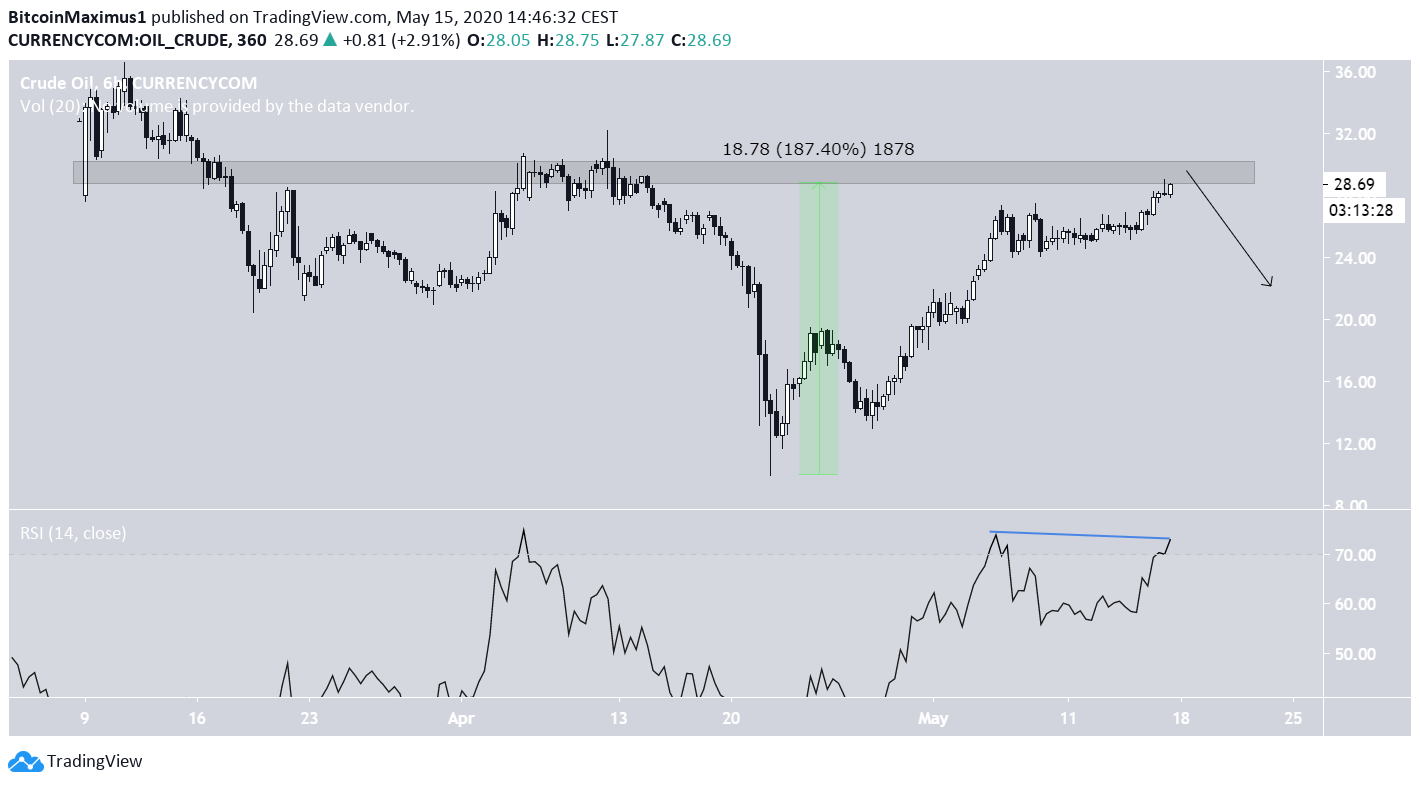
Oil’s Short-Term Movement
In the short-term, the oil price has bee increasing rapidly since March 23, having already done so by 190%.
However, it has almost reached an important resistance level, which is found at $30. Furthermore, the RSI has been generating bearish divergence, a sign that the price will likely decrease before possibly making another attempt at breaking out above this resistance.
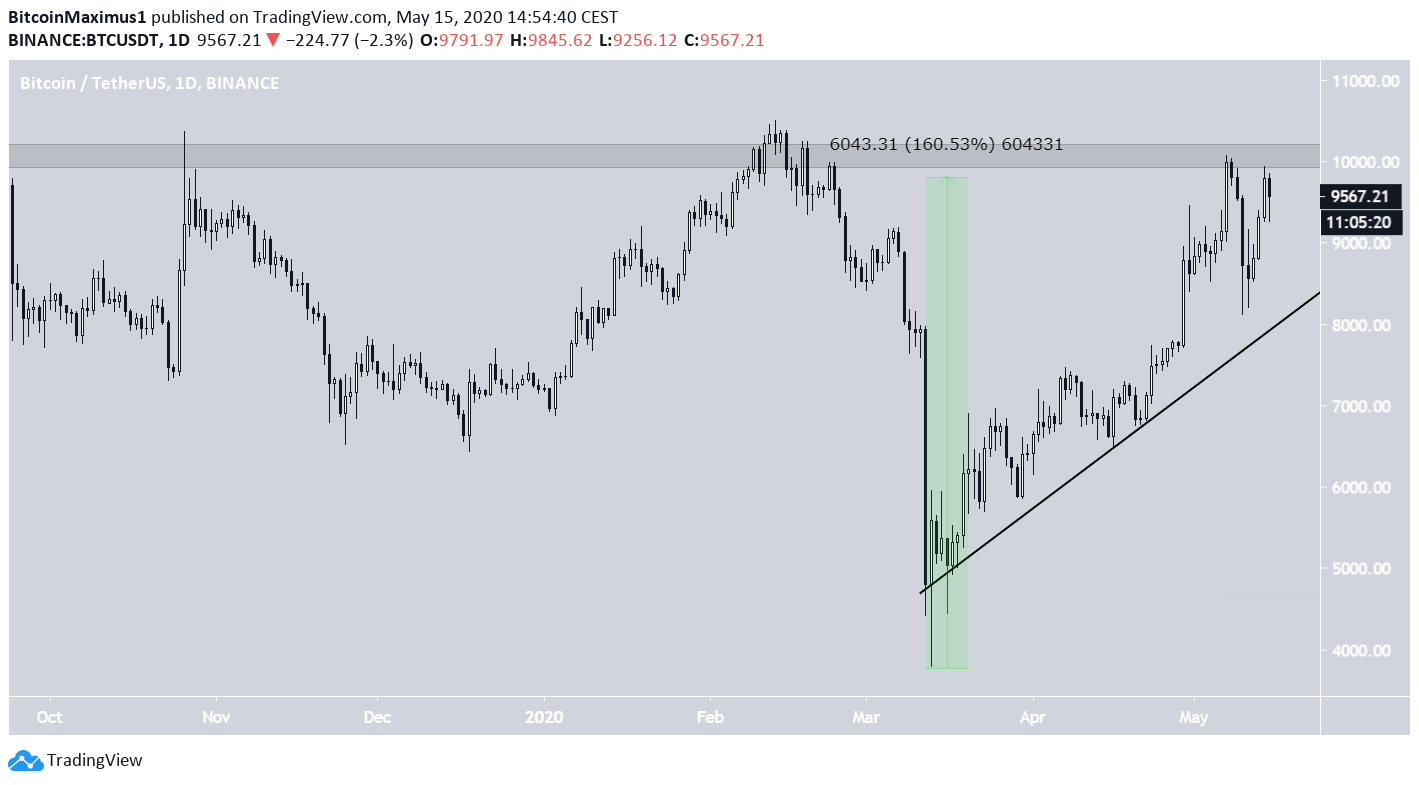
Bitcoin’s Short-Term Movement
Similar to oil, the Bitcoin price has been increasing since it reached a bottom on March 13, following an ascending support line. Until now, the price has increased by 160%.
In addition, the price has reached a major support area at $10,000 and decreased afterwards. While the price has not generated bearish divergence, similar to how oil has done, it has already created a lower high, a sign that the price will move downwards and possible reach the ascending support line once more.