
The crypto market has experienced a considerable increase over the past two weeks. The ongoing increase has in turn made the crypto market predictions considerably more bullish, creating hope for an upcoming altcoin season.
A list of 15 altcoins that have bullish-looking charts were given by well-known trader @MacnBTC. From them, Litentry (LIT), Litecoin (LTC), Basic Attention Token (BAT), SushiSwap (SUSHI), and Theta Token (THETA) seem primed to lead the potential altcoin season.
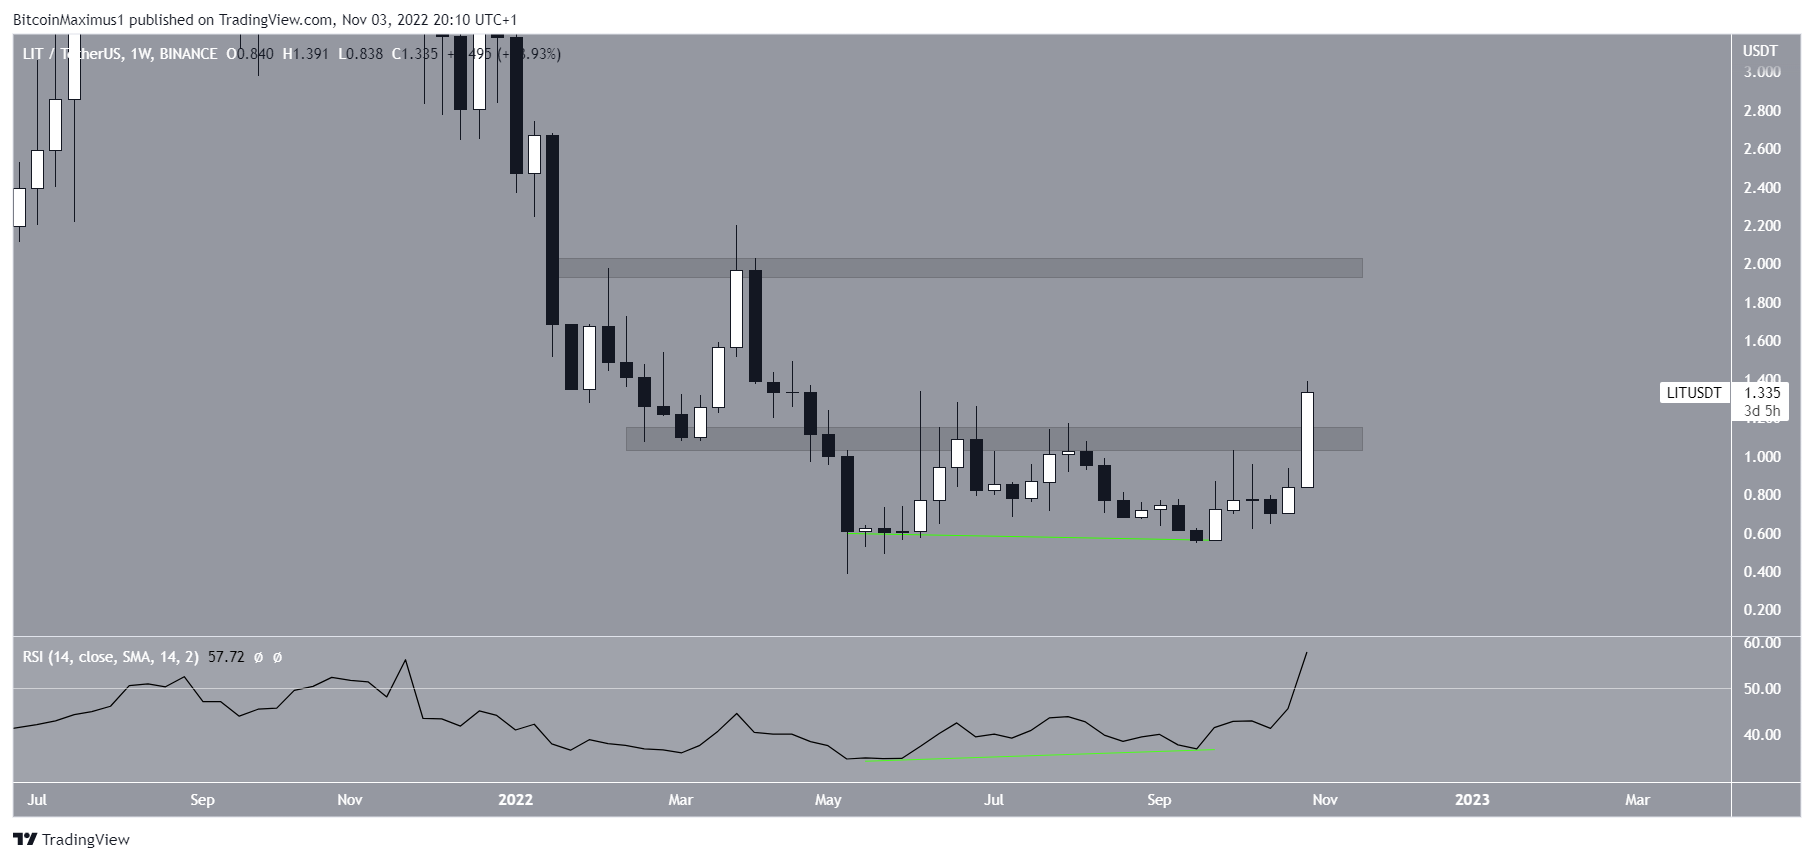
LIT Price Breaks Out After Bullish Pattern
Between May and Sept. the LIT price created a double-bottom pattern, which usually has bullish implications.
Additionally, the pattern was combined with a bullish divergence in the weekly RSI.
On Nov. 3, the LIT price broke out from the long-term $1.10 horizontal resistance area. The breakout was also combined with an RSI increase above 50. As a result, the increase will likely continue towards at least the next closest resistance at $2.
Conversely, failure to close above the $1.10 resistance area would invalidate this bullish prediction.
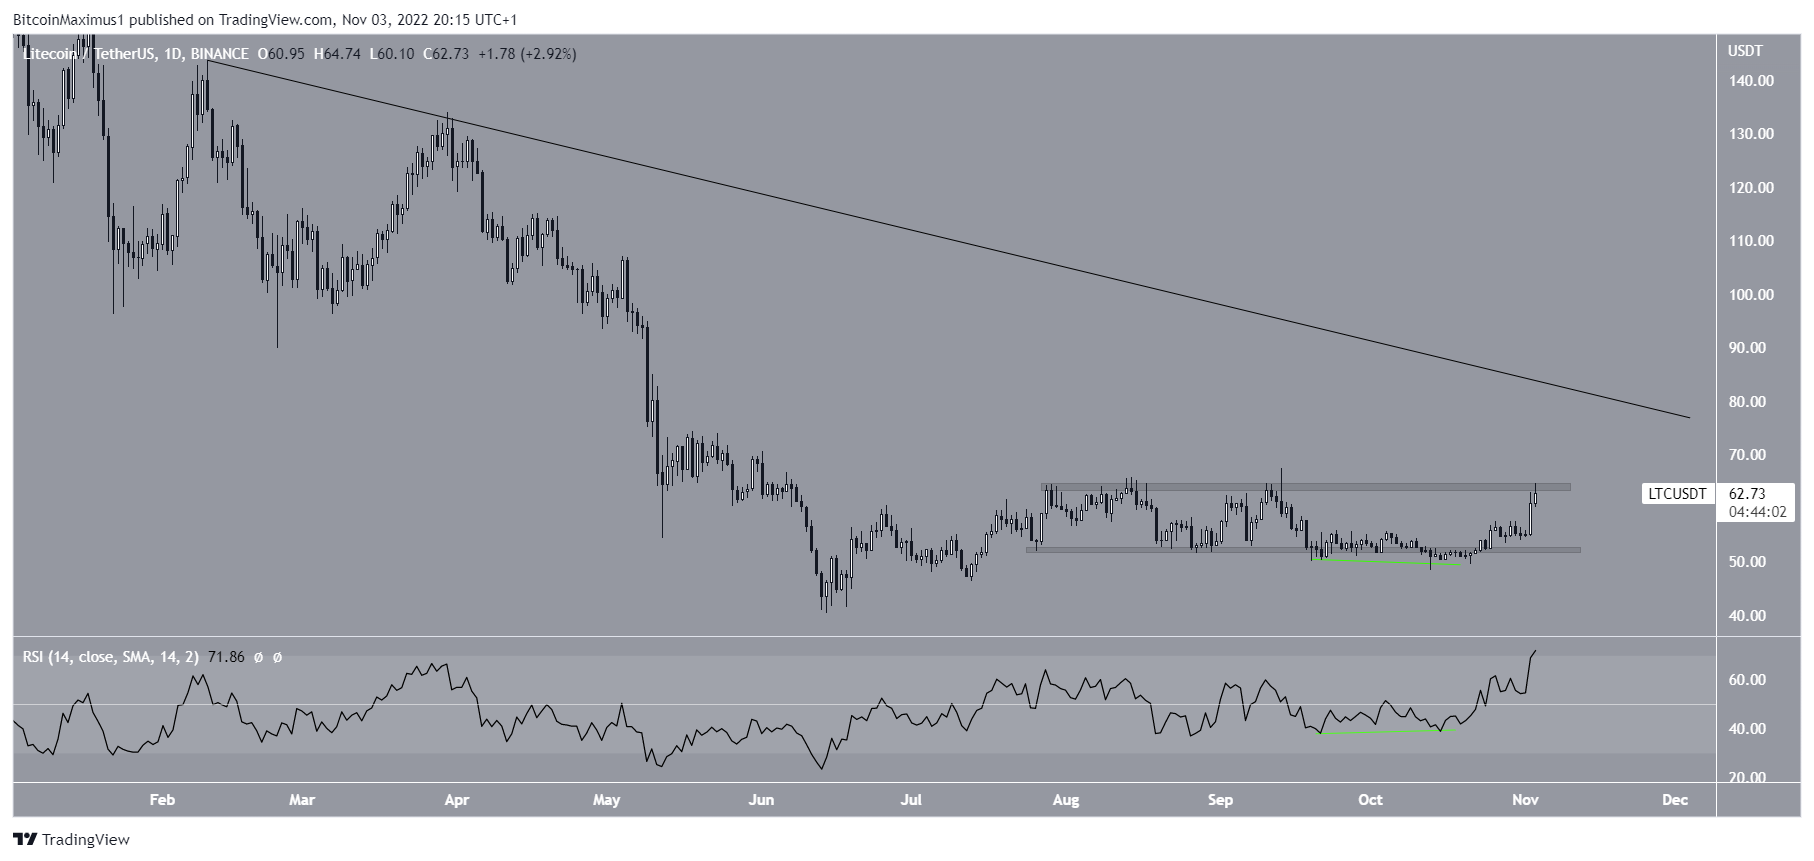
LTC Price Reaches Range High
LTC has been increasing since Oct. 13, when it deviated below its range low of $52. After reclaiming the range low, the rate of increase accelerated greatly.
Currently, the LTC price is attempting to break out above the $64 resistance area, which has been in place since the beginning of Aug. If it is successful in doing so, the next resistance would be at $80, created by a long-term descending resistance line.
The ongoing upward movement is also supported by the RSI, which has increased above 50 after generating a bullish divergence (green line).
Failure to reach a daily close above the $64 area would invalidate this bullish crypto market prediction.
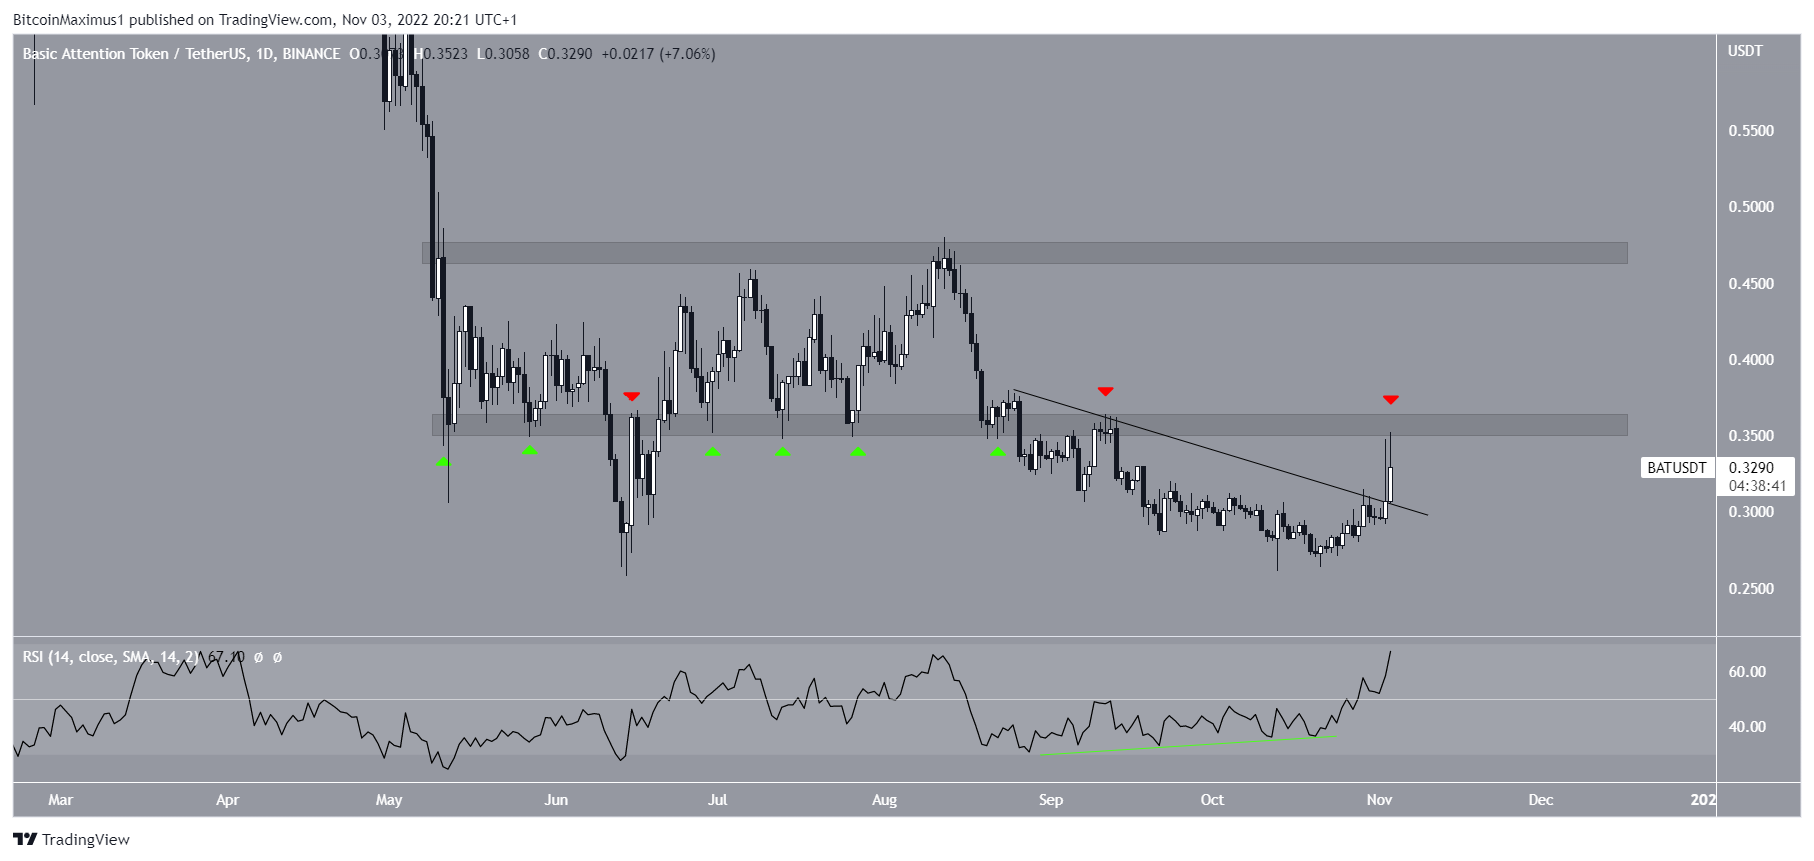
BAT Price Breaks Out From Resistance Line
The BAT price broke out from a short-term descending resistance line on Nov. 2 and reached a high of $0.352 the next day. The breakout was supported by the RSI, which moved above 50 after generating a bullish divergence (green line).
The BAT price is now facing strong resistance at $0.355. The area is crucial since it has intermittently acted as both support (green icons) and resistance (red icons) since May. If the BAT price is successful in moving above it, it would be expected to increase toward $0.470.
Failure to reach a close above the $0.355 area would invalidate this bullish potential price action.
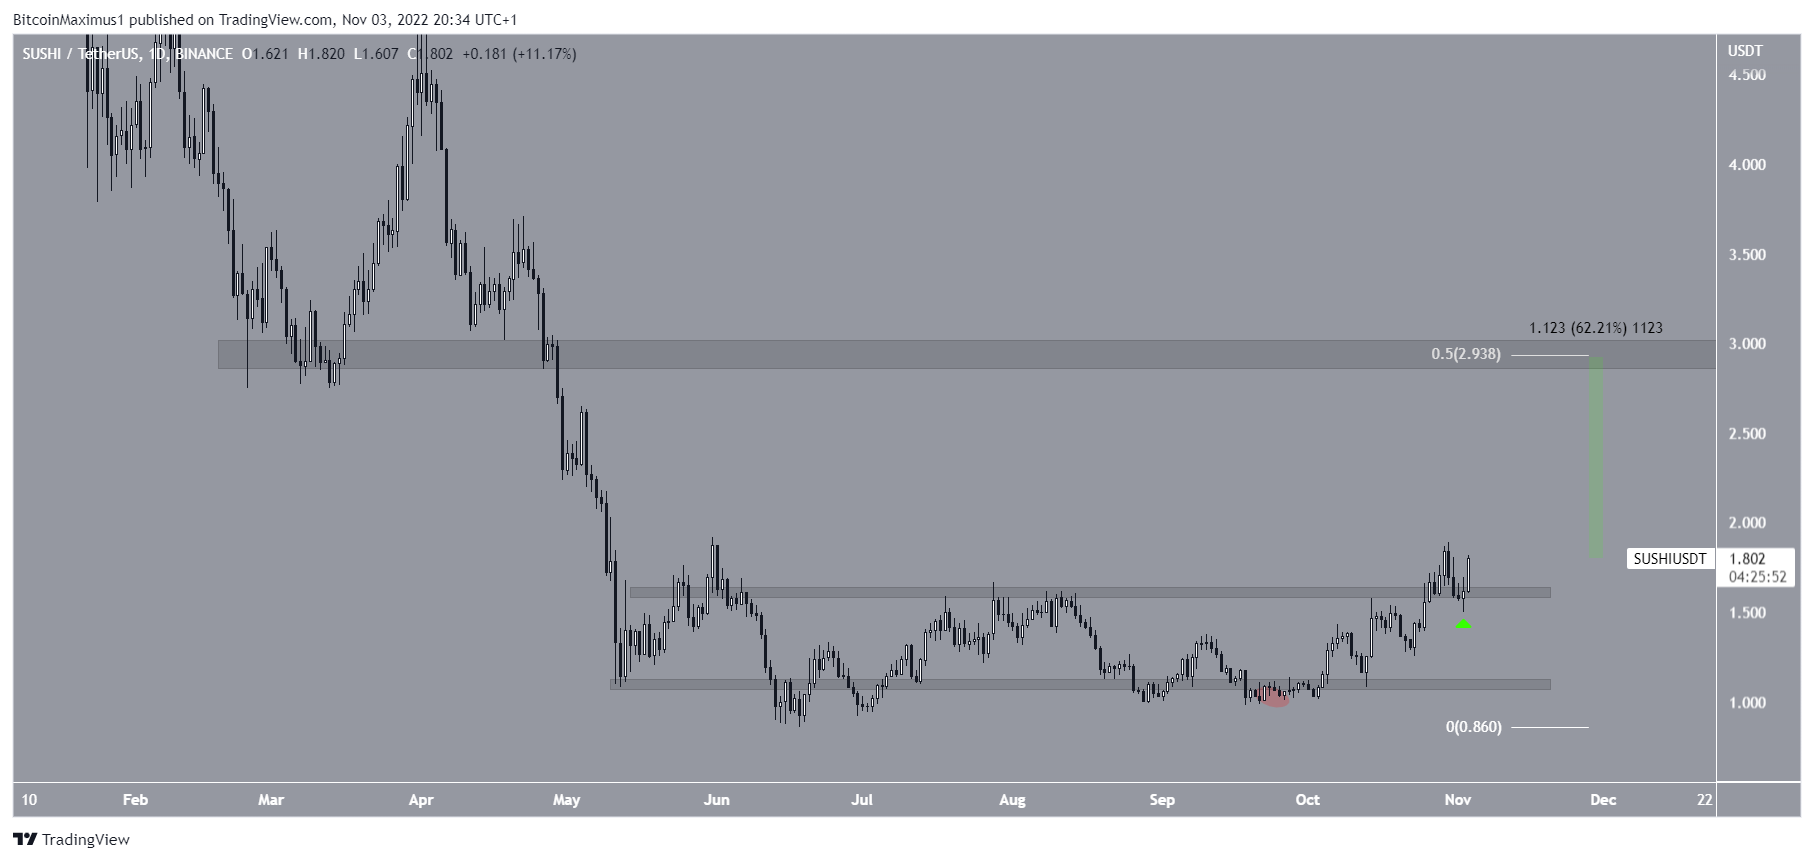
Can SUSHI Lead Altcoin Season?
SUSHI has been increasing since deviating below the $1.10 support area in Sept. 25 (red circle). The upward movement led to a high of $1.89 on Oct. 30, which caused a breakout from the $1.62 resistance area.
After bouncing at the $1.62 area and validating it as support (green icon), SUSHI has increased substantially over the past 24 hours.
There is a notable lack of resistance above the current price. Therefore, the SUSHI price could move upward toward the next resistance at $2.94. This would amount to an upward movement of 62%.
On the other hand, a daily close below the $1.62 area would suggest that the breakout could not be sustained and a re-test of $1.10 is on the cards.
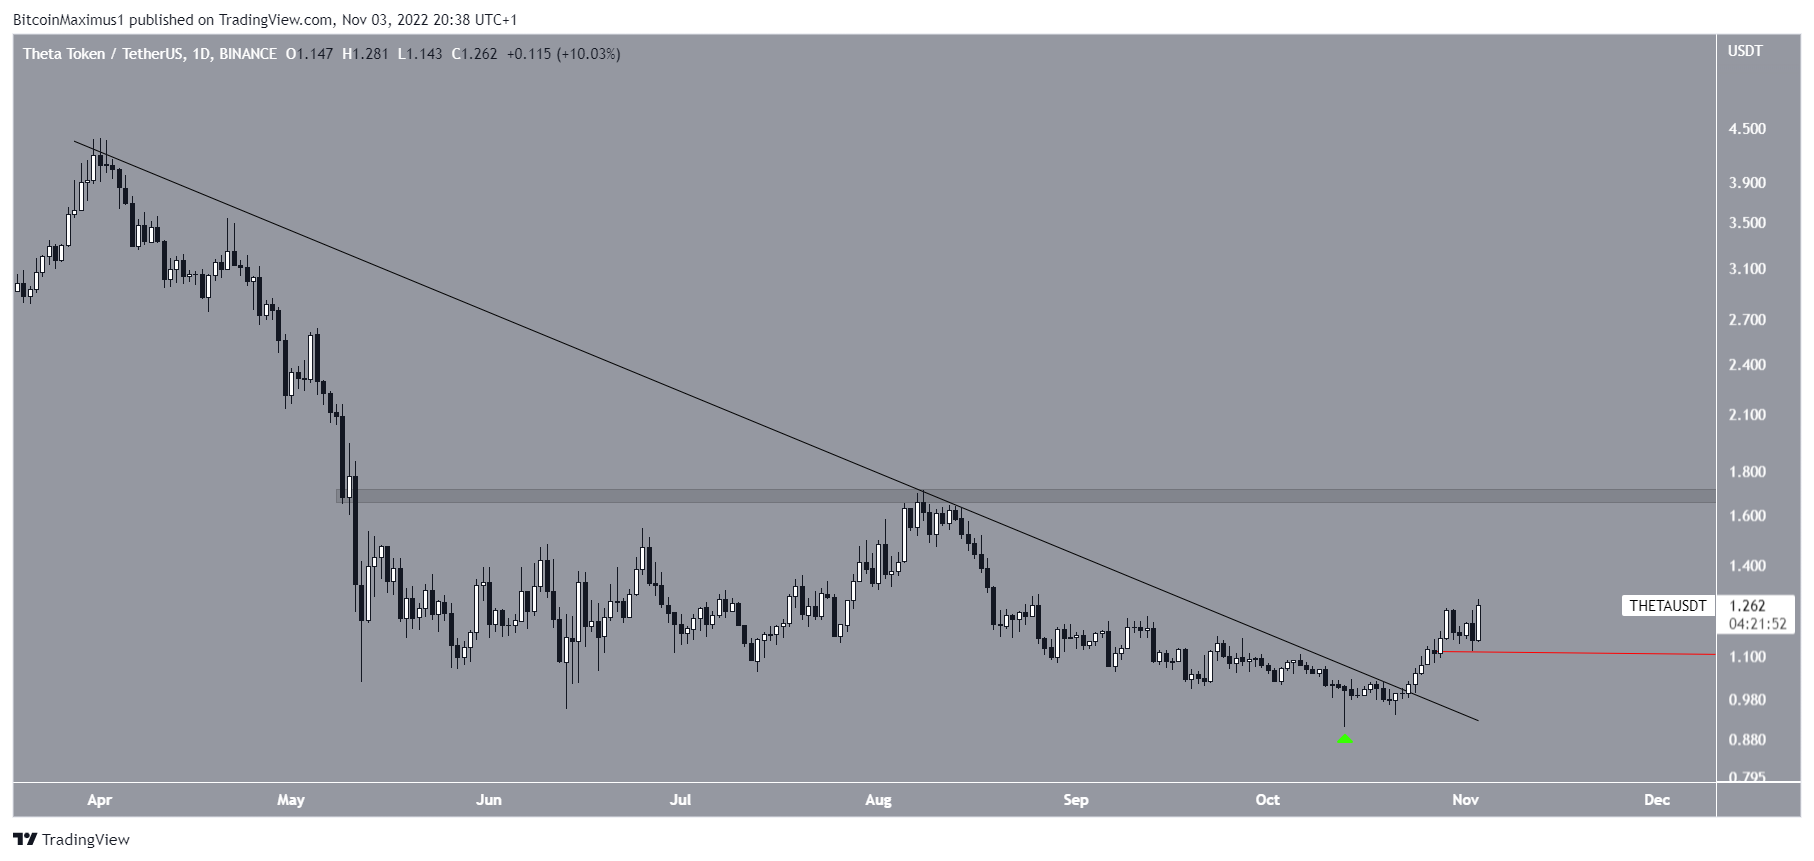
THETA Price Could Increase to $1.70
The THETA price had been decreasing underneath a descending resistance line since April. This downward movement led to a low of $0.91 on Oct. 13.
After creating a long lower wick (green icon), the THETA price broke out from the line on Oct. 23. So far, it has reached a high of $1.28.
Due to the lack of overhead resistance, it seems likely that the upward movement will continue towards at least $1.70.
On the other hand, a decrease below yesterday’s low of $1.11 (red line) would invalidate this bullish hypothesis.
For the latest BeInCrypto Bitcoin (BTC) and crypto market analysis, click here
Disclaimer: BeInCrypto strives to provide accurate and up-to-date information, but it will not be responsible for any missing facts or inaccurate information. You comply and understand that you should use any of this information at your own risk. Cryptocurrencies are highly volatile financial assets, so research and make your own financial decisions
