


Alpha Venture DAO (ALPHA) has been increasing since June 15 in an upward movement that was preceded by bullish divergence in the RSI.
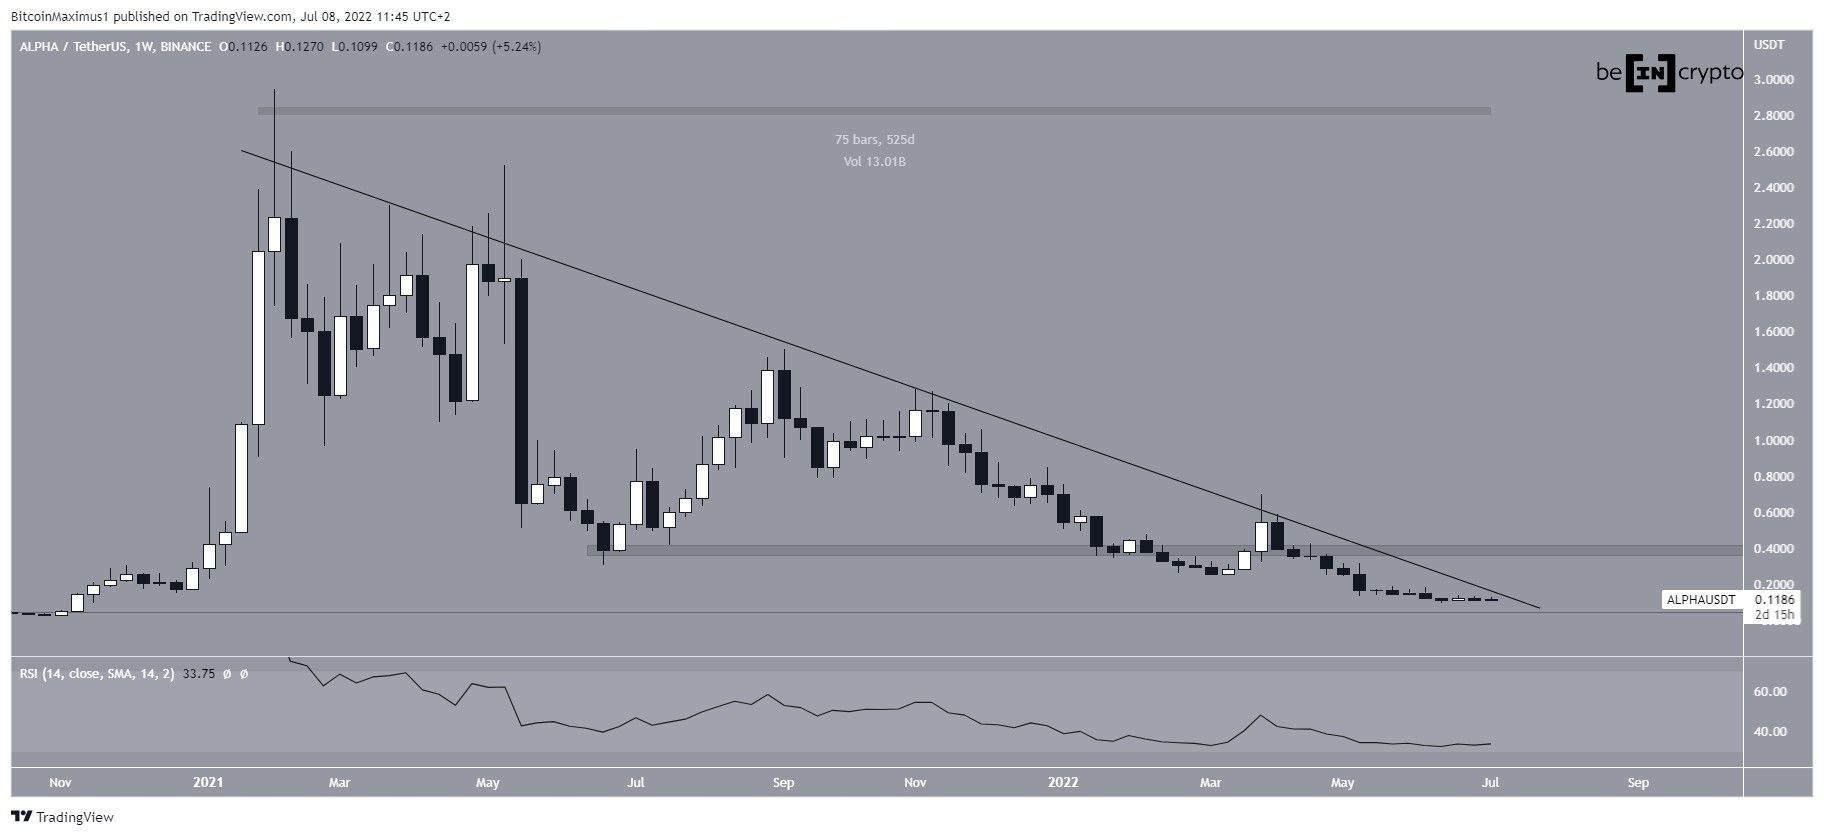
ALPHA has been decreasing underneath a descending resistance line since reaching an all-time high of $2.94 on Feb 5 2021. The downward movement has so far led to a low of $0.093 on June 18. Until now, the line has been in place for 525 days.
While the RSI is at a new all-time low, it is not yet oversold. Furthermore, it has not generated any sort of bullish divergence. As a result, there are no signs of a potential bullish divergence in place.
The main horizontal support and resistance levels are at $0.04 and $0.42, respectively.
ALPHA generates bullish divergence
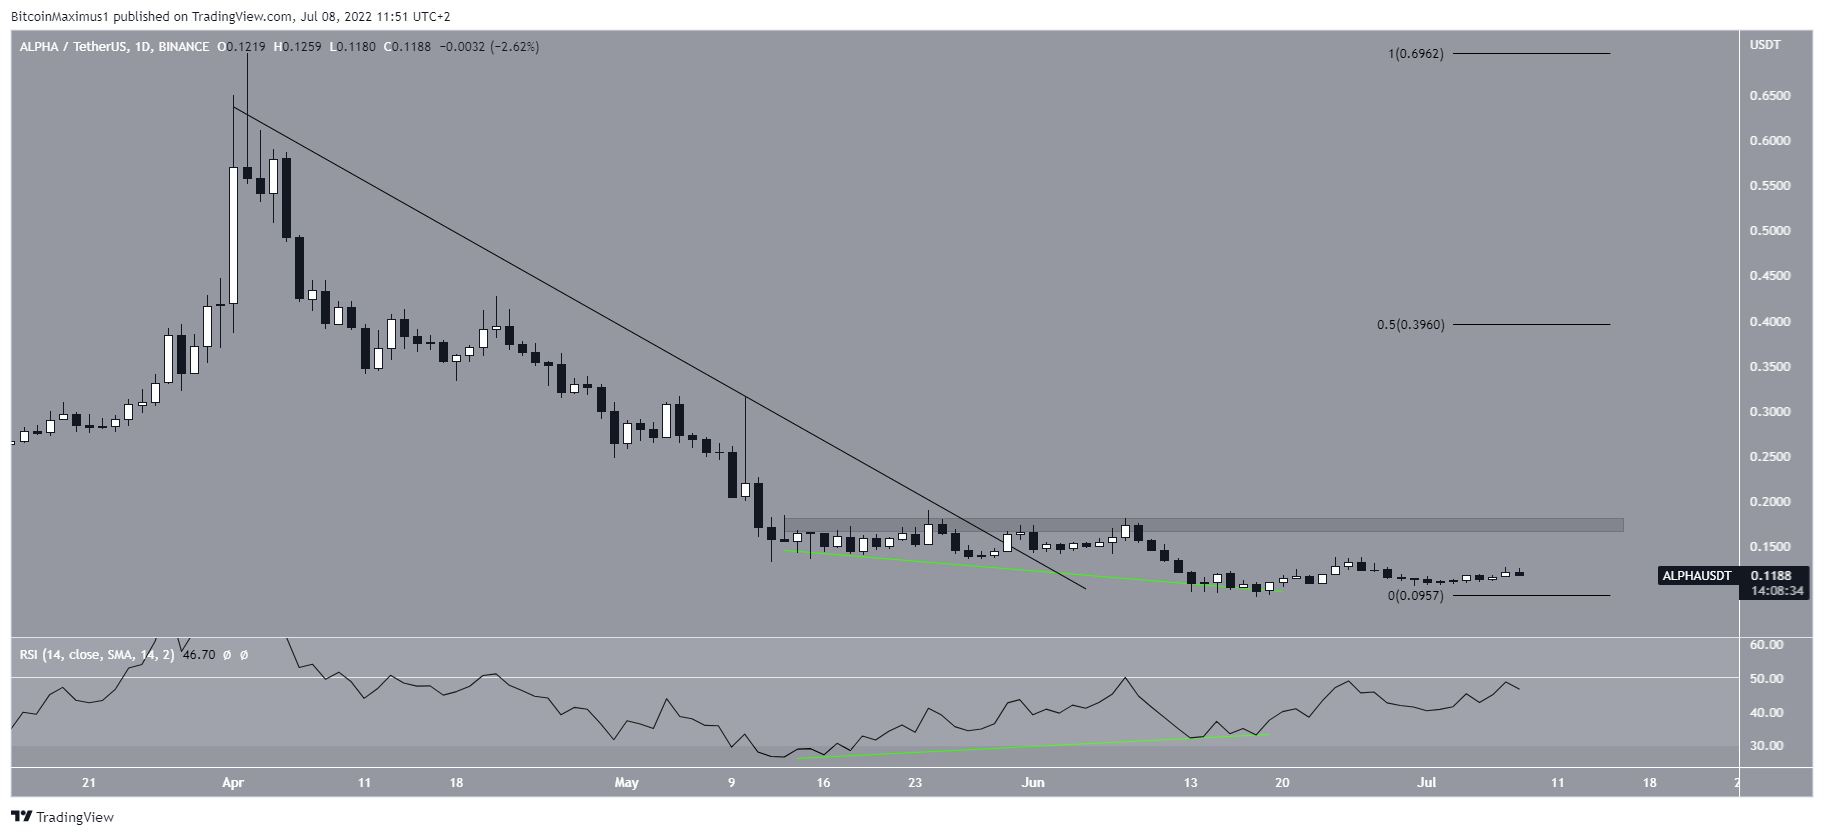
The daily chart provides a more bullish outlook. The main reason for this is that the RSI has been generating bullish divergence since May 14. If the divergence is the catalyst for an upward movement, the closest resistance area would be at $0.175.
The RSI is currently right below the 50 line, making its third breakout attempt. Since movements above this line are considered signs of a bearish trend, a RSI breakout above 50 would be expected to precede a price breakout.
If ALPHA manages to clear the $0.175 resistance area, the next closest resistance would be at $0.395, created by the 0.5 Fib retracement resistance level.
Therefore, due to the lack of overhead resistance, the potential for a considerable upward movement is high once the price manages to move above $0.175.
Wave count analysis
Cryptocurrency trader @Thetradinghubb tweeted a chart of ALPHA, stating that the price could increase to $0.15.
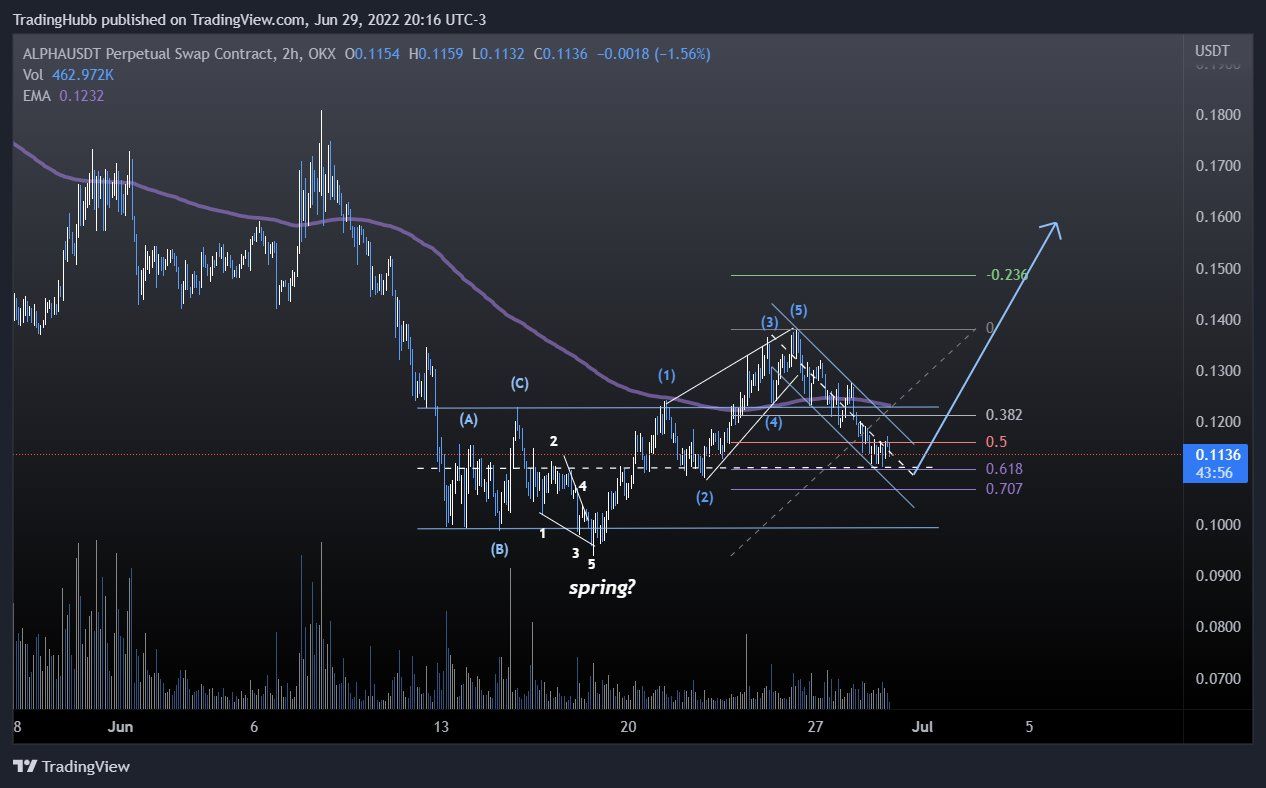
Since the tweet, the price broke out and seemingly initiated an upward movement. However, it failed to sustain it and is back inside the previous ascending parallel channel. This indicates that the entire movement could be corrective.
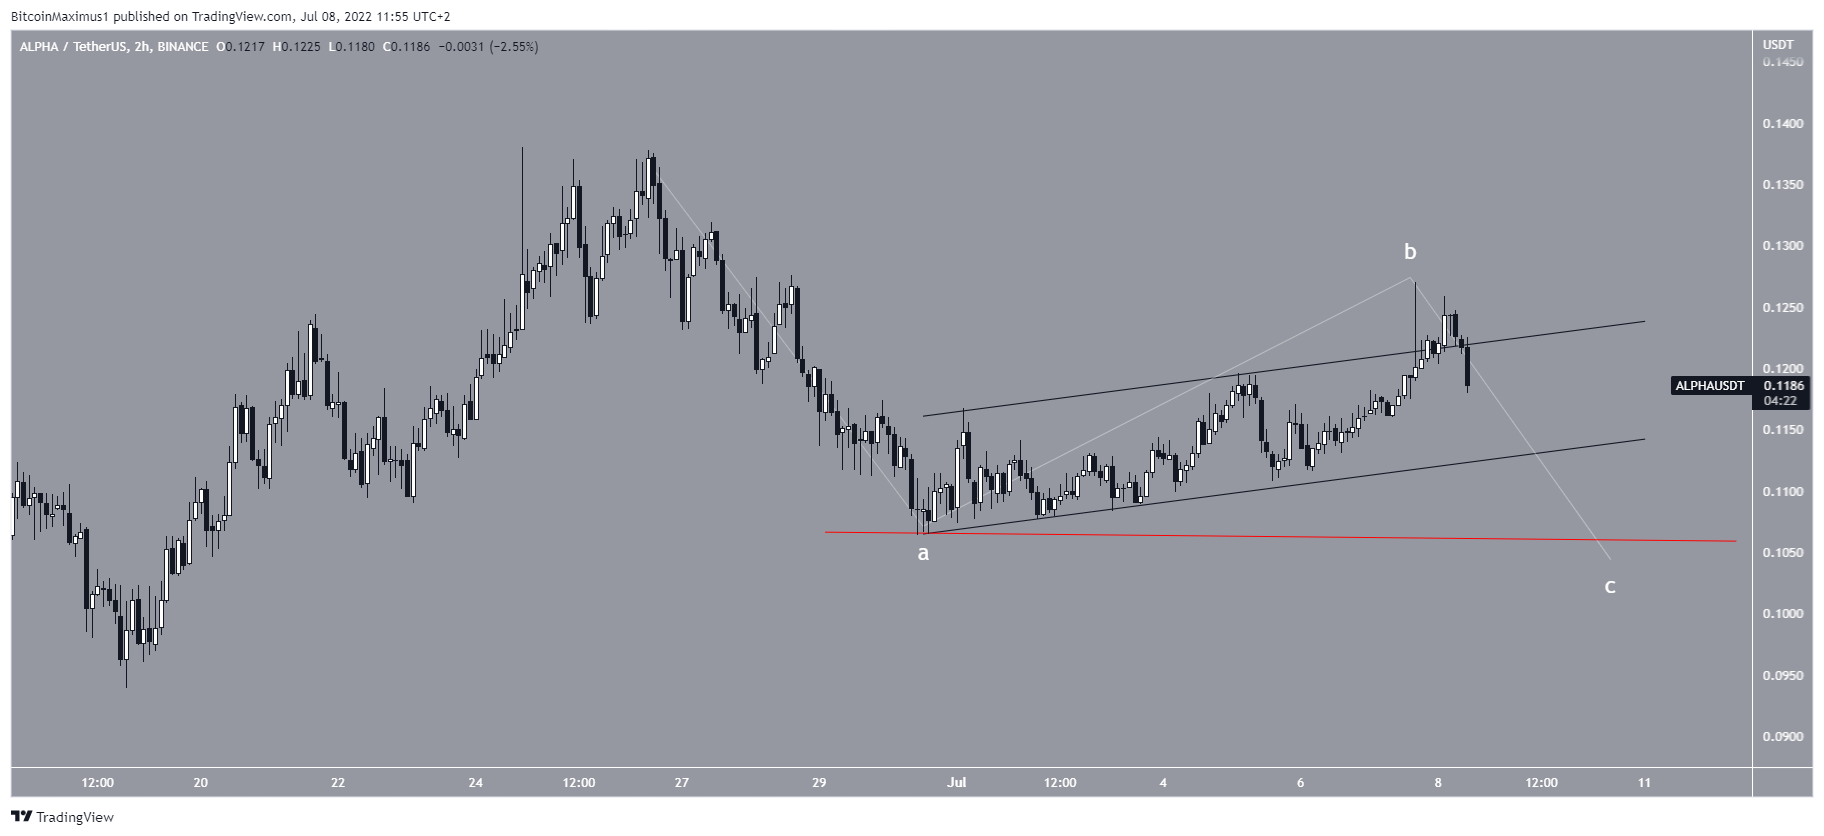
As it stands, a decrease that sweeps the June 30 lows (red line) would be more likely prior to upwards continuation.
For Be[in]Crypto’s latest bitcoin (BTC) analysis, click here
