
Algorand (ALGO) has been moving upwards since breaking out from a descending wedge on Aug. 7.
It reached a new yearly high on Sept. 8 and is currently attempting to break out above the $1.78 horizontal resistance area.
ALGO reaches yearly high
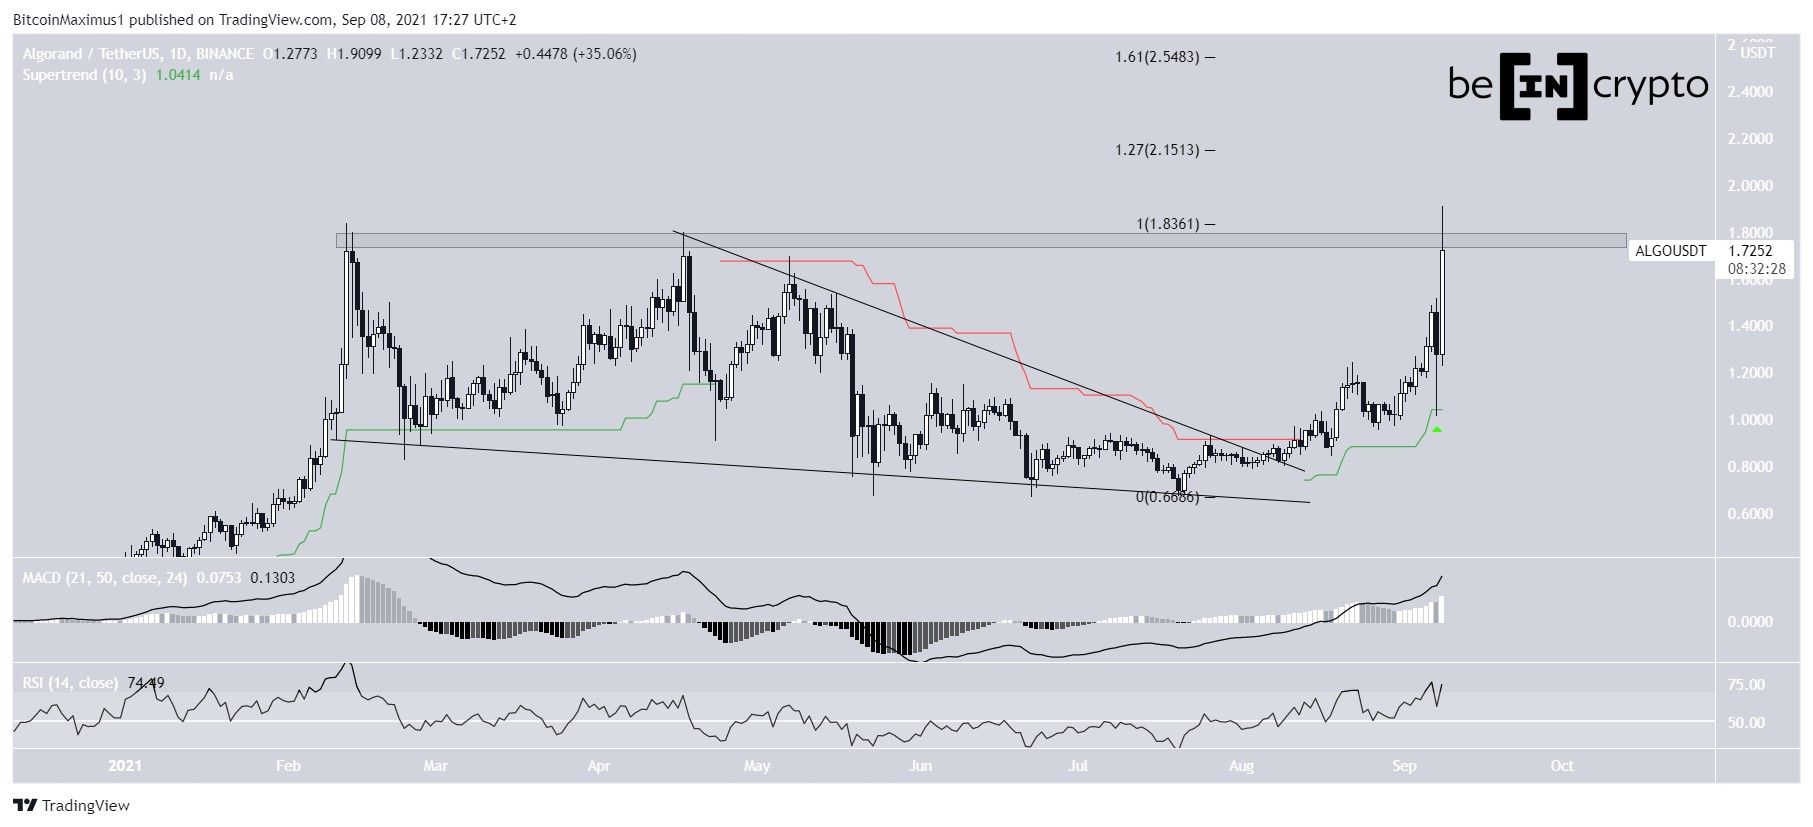
On Aug. 7, ALGO broke out from a descending wedge and has been moving upwards since. The Sept. 8 fall only caused it to validate the Supertrend line as support (green) and created a long lower wick.
ALGO resumed its ascent with strength on Sept.8 and briefly moved above the $1.77 resistance area. This generated a new yearly high of $1.91.
Technical indicators in the daily time-frame are bullish. The MACD and RSI are both increasing. The former is positive while the latter has just moved above 70.
Currently, ALGO is attempting to reach a close above the $1.77 horizontal resistance area. If it does, the two closest resistance levels would be at $2.15 and $2.55. These are the 1.27 and 1.61 external Fib retracement levels when measuring the most recent drop.
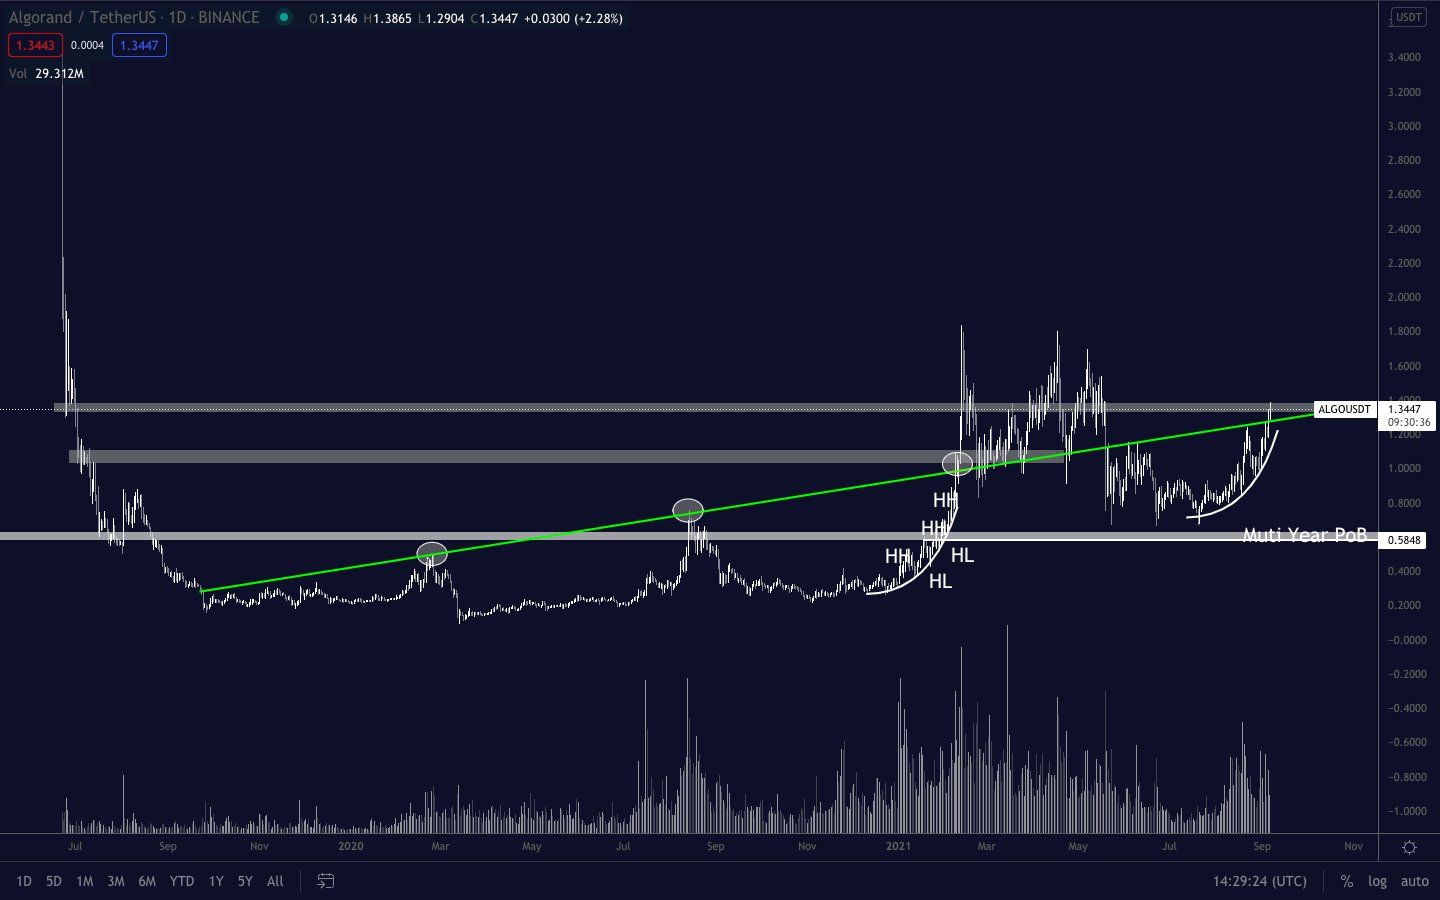
Cryptocurrency trader @Pentosh1 stated that ALGO could go to new yearly highs since it is close to moving above the $1.40 horizontal area.
Future movement
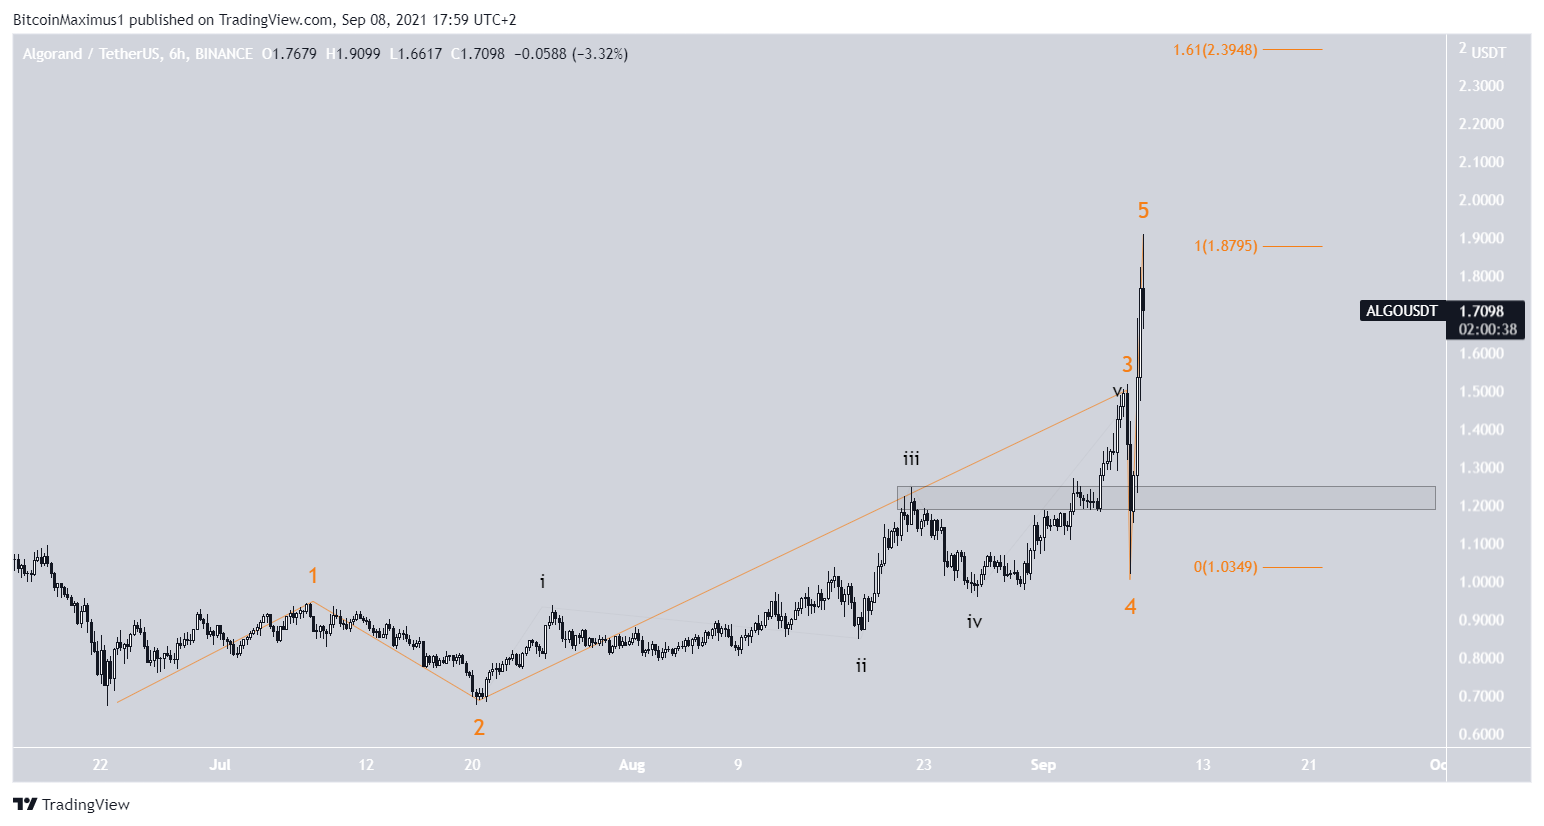
The shorter-term six-hour chart shows that the movement has become parabolic over the last two days.
If the increase since June 22 is a bullish impulse, then it is possible that ALGO just finished wave five. The aforementioned yearly high was made at the 1:1 length of waves 1-3 (orange).
This is a suitable level for a top to be reached in. Furthermore, it coincides with a horizontal resistance area.
If wave five extends further, the next Fib resistance would be at $2.4, coinciding with that given in the previous section.
For BeInCrypto’s latest Bitcoin (BTC) analysis, click here.
