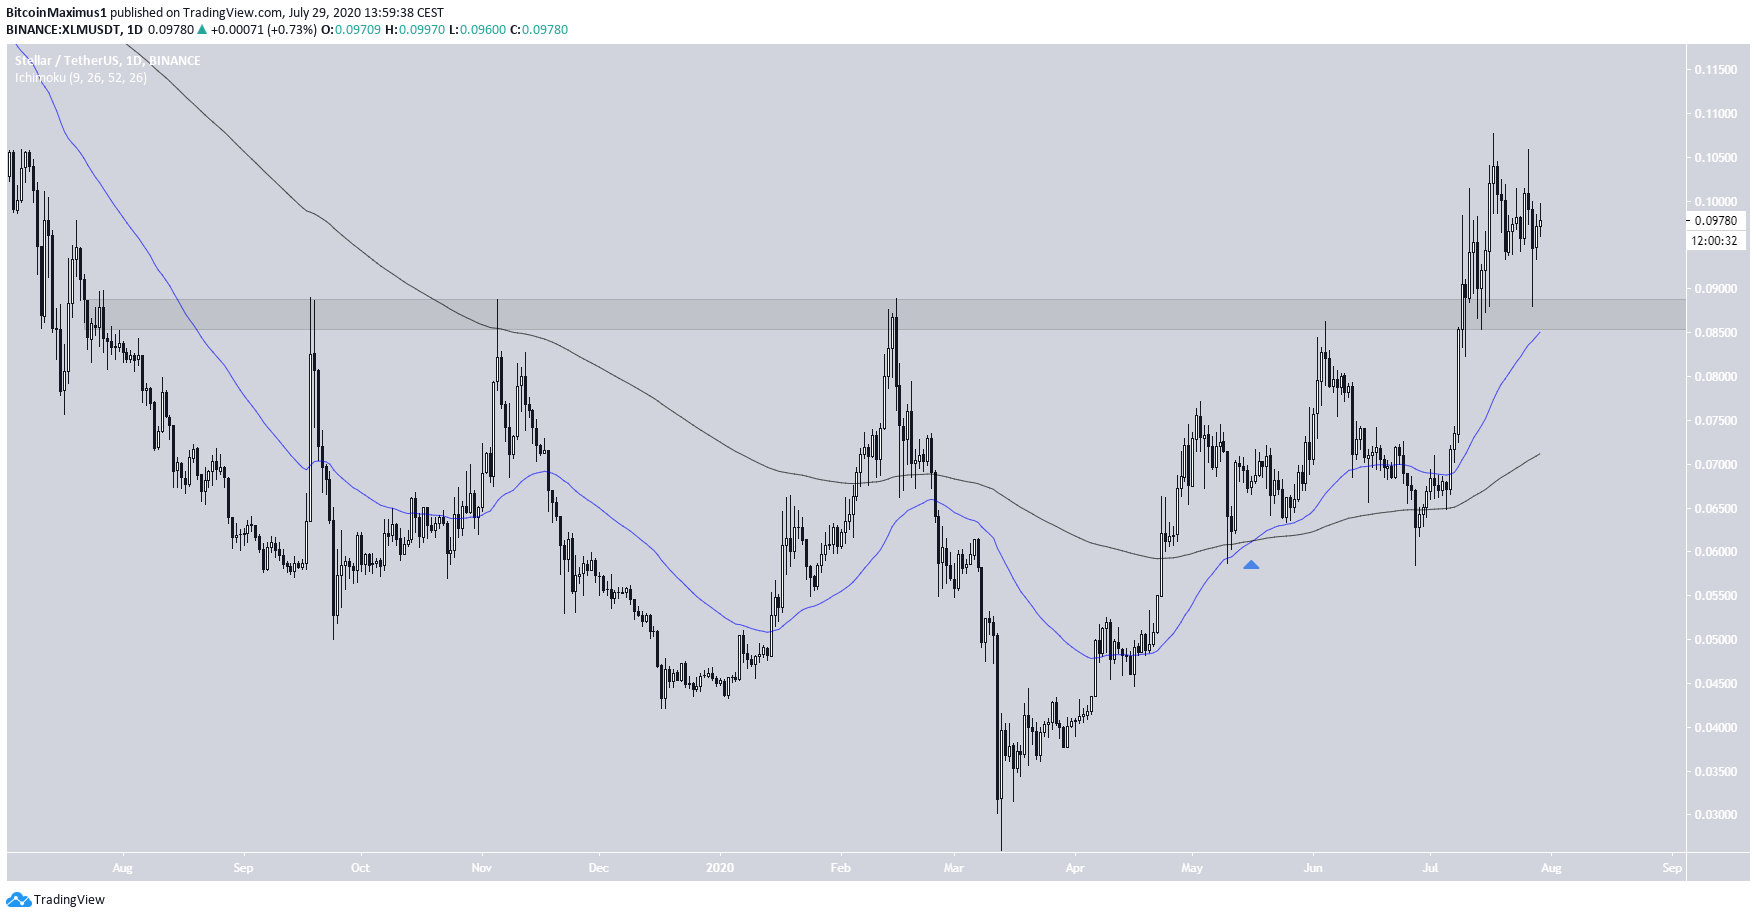
At the beginning of July, the Stellar (XLM) price broke out from a long-term resistance area. However, the price could not sustain the rally and has since fallen back below the breakout level.
Unless XLM can successfully reclaim this level, it’s outlook remains bearish.
Breakout From Long-Term Range
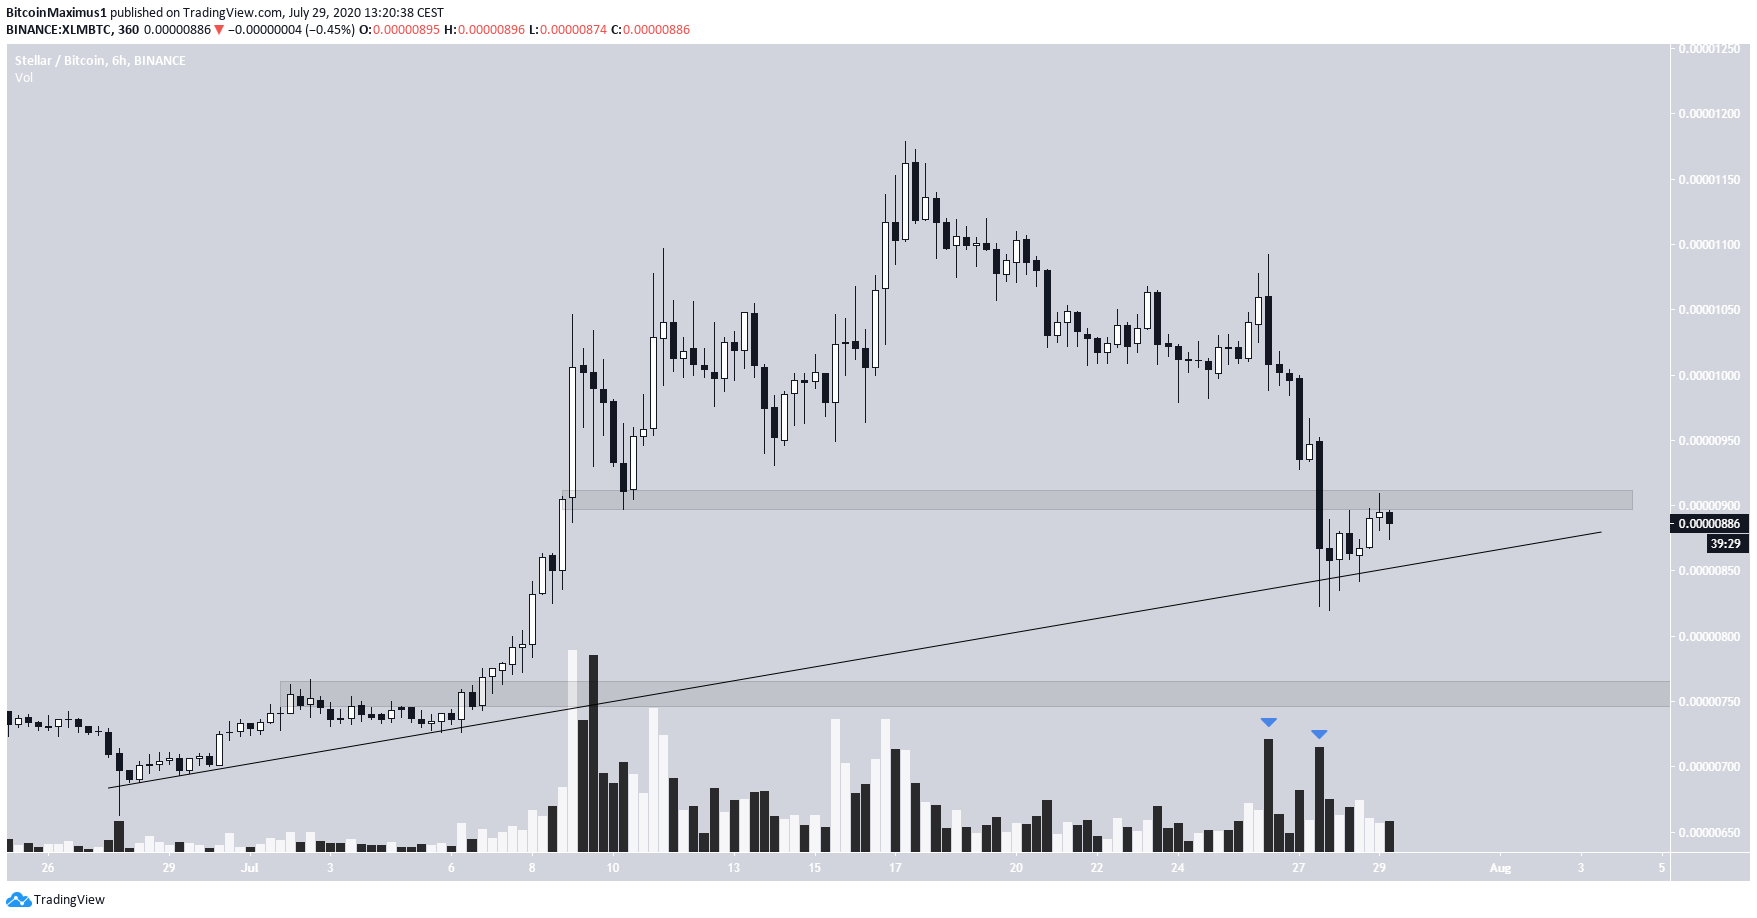
Beginning in July 2019, the XLM price consolidated below the 900 satoshi area, validating it as resistance on several occasions. On July 8, the price was finally successful in breaking out, reaching a high of 1187 satoshis after a few days. However, the price underwent a rapid decline on July 27 and has fallen back below the 900 satoshi area again. If the price cannot reclaim this level, it would be a major bearish development, since it would signify that the higher prices could not be sustained and the move was a fake-out. Technical indicators are neutral, leaning bearish. The RSI is approaching the 50 line from above. While this is a likely place for a bounce, a decline below would be bearish. The MACD is losing momentum and could soon make a bearish cross. Therefore, the outlook from the daily perspective is neutral but leaning bearish.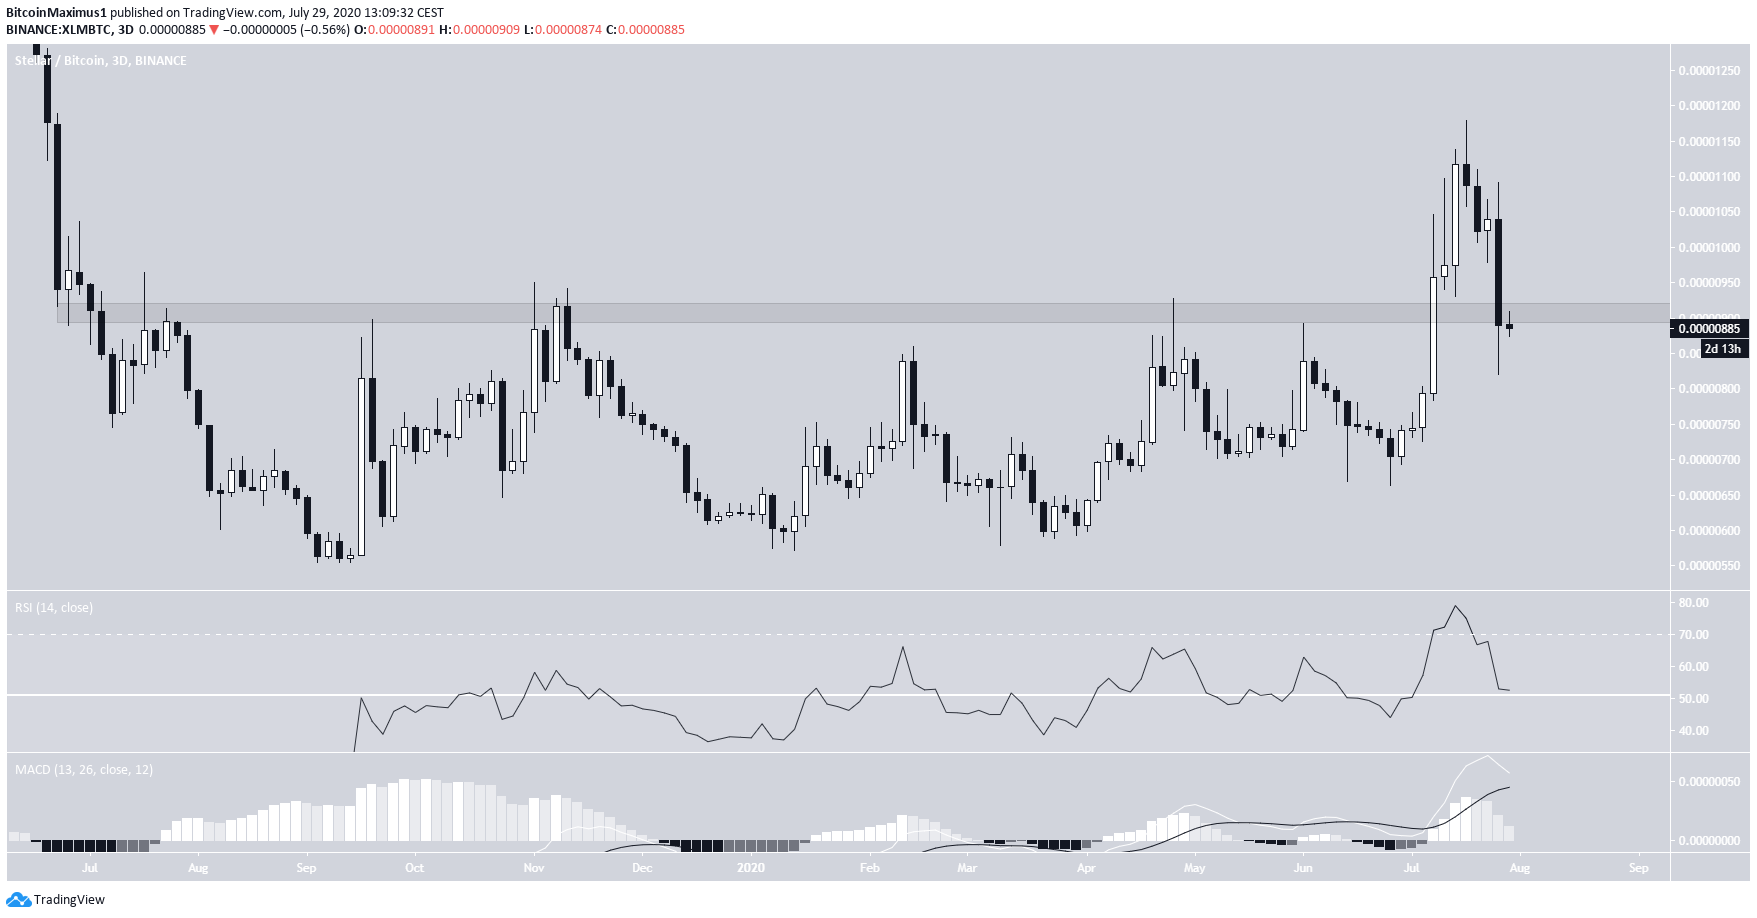
XLM/Dollar
Cryptocurrency trader @CryptoMichNL believes that the XLM price is likely to consolidate before moving upwards. They posted a chart showing the price resting inside support.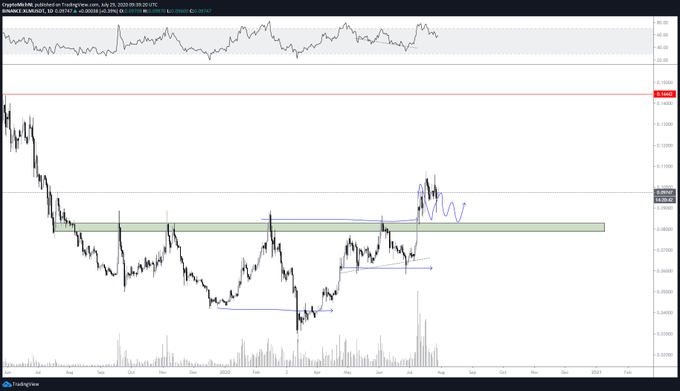
Disclaimer
In line with the Trust Project guidelines, this price analysis article is for informational purposes only and should not be considered financial or investment advice. BeInCrypto is committed to accurate, unbiased reporting, but market conditions are subject to change without notice. Always conduct your own research and consult with a professional before making any financial decisions. Please note that our Terms and Conditions, Privacy Policy, and Disclaimers have been updated.

Valdrin Tahiri
Valdrin discovered cryptocurrencies while he was getting his MSc in Financial Markets from the Barcelona School of Economics. Shortly after graduating, he began writing for several different cryptocurrency related websites as a freelancer before eventually taking on the role of BeInCrypto's Senior Analyst.
(I do not have a discord and will not contact you first there. Beware of scammers)
READ FULL BIO
Sponsored
Sponsored
