


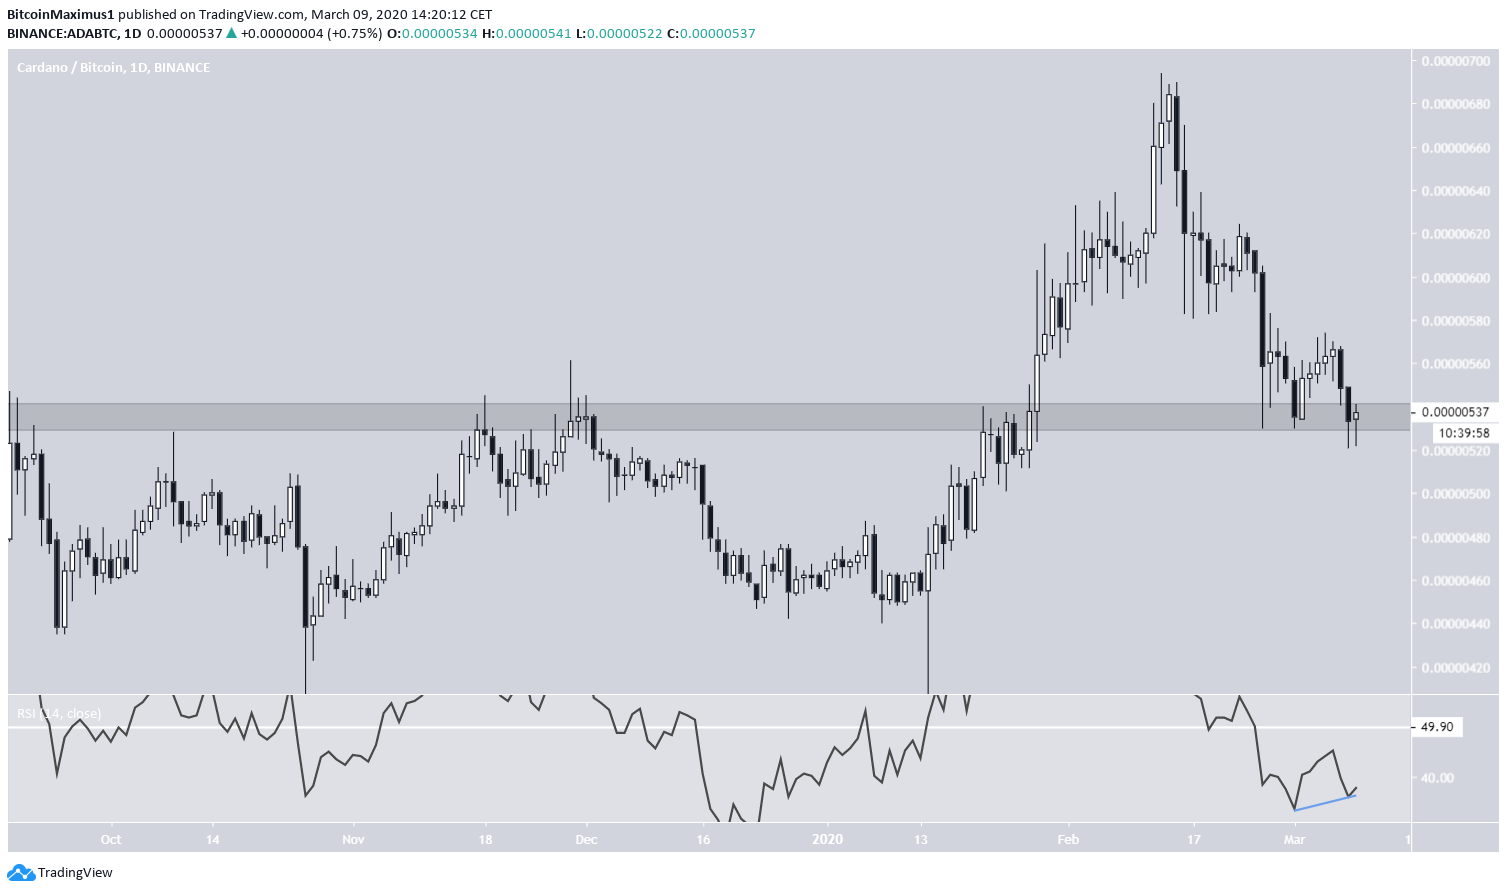
The ADA price has been decreasing since reaching a high on Feb. 13. The price reached the 535 satoshi support area on Feb. 26 and has traded near that level ever since.
Cardano (ADA) Price Highlights
- There is support at 535 satoshis.
- The daily RSI is bullish.
- ADA has possibly made a triple bottom.
- There is resistance at 580 satoshis.
Well-known trader @ACXTrades tweeted an ADA price chart and announced that he has initiated a long trade, calling it a “low risk play.” In the image, we can see that the ADA price has reached a very significant support area.
$ADA Longed. Low risk play. pic.twitter.com/pPv0Pp2Luw
— ◇.A.C.X.◇ (@ACXtrades) March 8, 2020
Is ADA actually a low risk play? Will the price reverse its trend or will it continue decreasing? Keep reading below if you are interested in finding out.
Significant Support
The most significant area for ADA is found at 535 satoshis. The price has previously broken out from this area, and after reaching a high on Feb. 13, it as returned to validate it as support.
Currently, it is trading inside this support area, making this a low risk play indeed, since a stop loss could be placed below it in order to mitigate possible losses.
In addition, the daily RSI has generated some bullish divergence, making this a likely place to initiate a bounce.
Triple Bottom
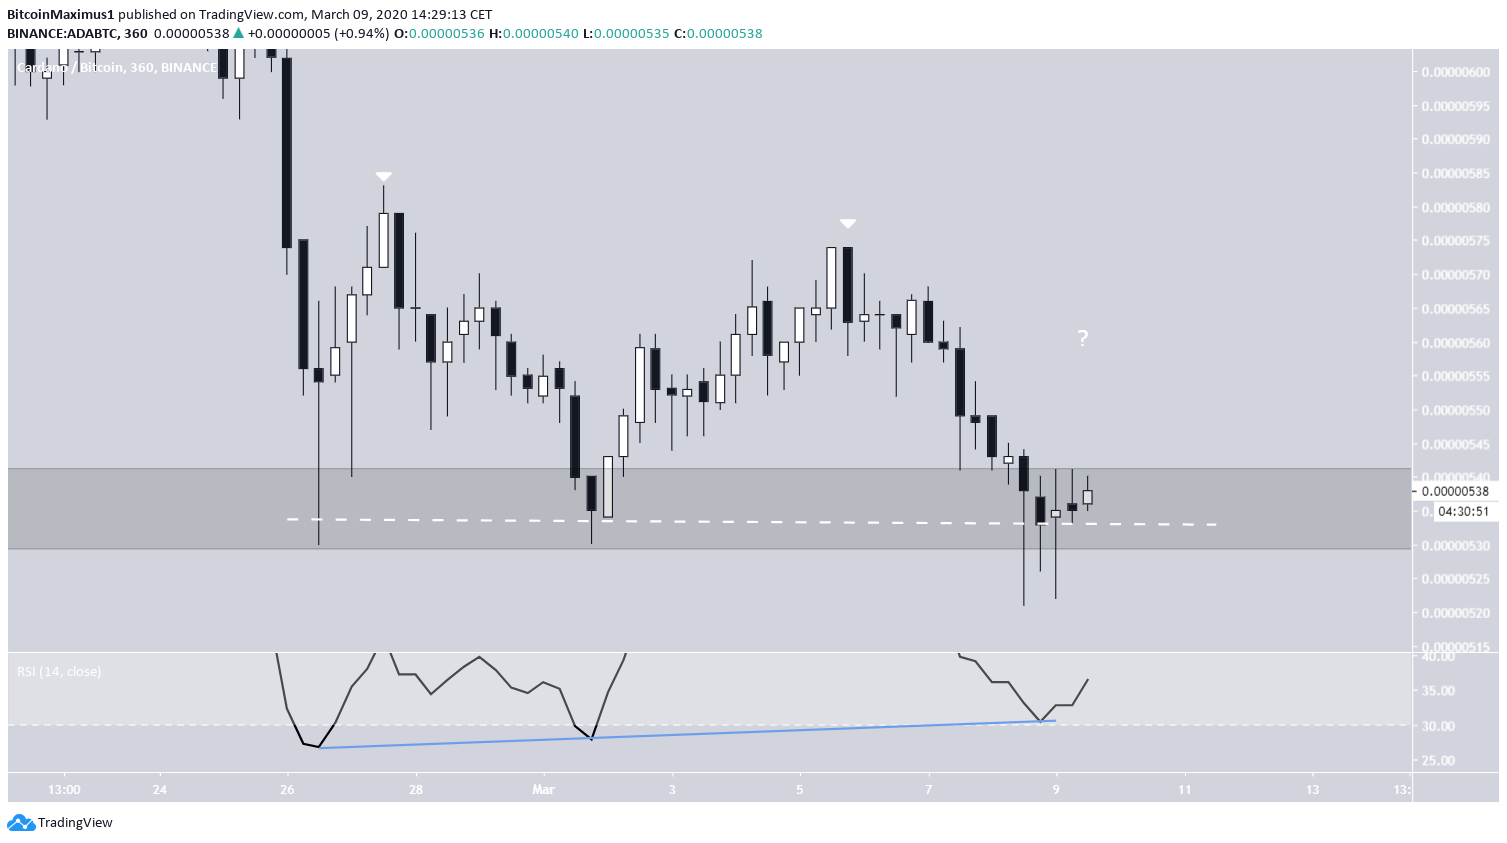
Looking at a lower time-frame, it is visible that the price has made a triple bottom inside this support area. This is a bullish reversal pattern that is combined with bullish divergence in the RSI. The view in the majority of time-frames is bullish.
However, there is a bearish characteristic that raises concerns. Until now, each bounce has led to a lower high than the previous one, so until this pattern reverses, we cannot with certainty state that the price movement is bullish.
Therefore, unless the price breaks out from the resistance of the initial high at 580 satoshis, its movement is still considered bearish.
Short-Term Range
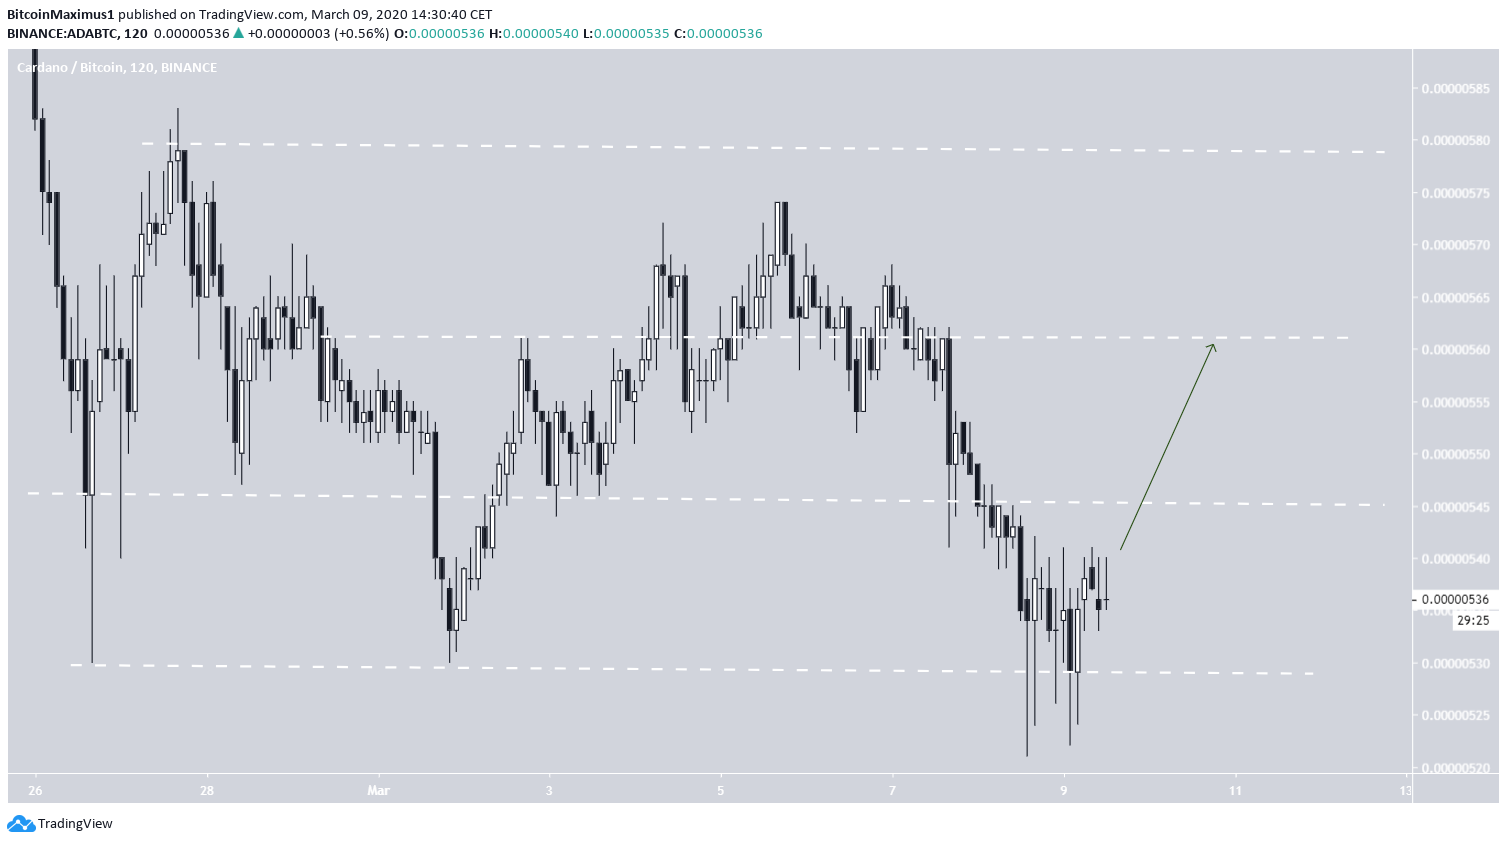
In the short-term, we can outline one support area at 530 satoshis and three resistance areas, 545, 560 and 580 satoshis, respectively.
In order for the lower high pattern to be invalidated, the price has to move above 560 satoshis. While we cannot say with certainty that it will, it looks very likely to at least reach this area.
A price breakout above 580 satoshis would make the directional bias bullish in the short/medium-term.
To conclude, the ADA price has reached a very significant support area that is expected to initiate a bounce. While a short-term increase is likely, the longer-term outlook still remains uncertain.


