

The ADA price has reached a significant resistance area and is trading inside an ascending wedge.
Cardano (ADA) Highlights
- There is resistance at 630, 770, and 1,000 satoshis.
- ADA has broken out from a short-term descending channel.
- The price is trading inside a descending wedge.
- A golden cross has transpired.
- The RSI supports a short-term decrease.
$ADA | $BTC Update
— Lenny (@TraderLenny) February 4, 2020
Keeping a close eye on this descending channel on the lower time frames. pic.twitter.com/64O1EtqEVX
A New Bullish Trend
On Jan 28, the ADA price broke out from an ascending triangle that had been in place for 172 days. Shortly after, a golden cross (a bullish cross between the 50 and 200-day moving averages) transpired, confirming that the ADA price is in a bullish trend. In addition, while the daily RSI is overbought, it has yet to generate a trace of bearish divergence. However, the rally has stalled near 630 satoshis, a minor resistance area that coincides with a previous high.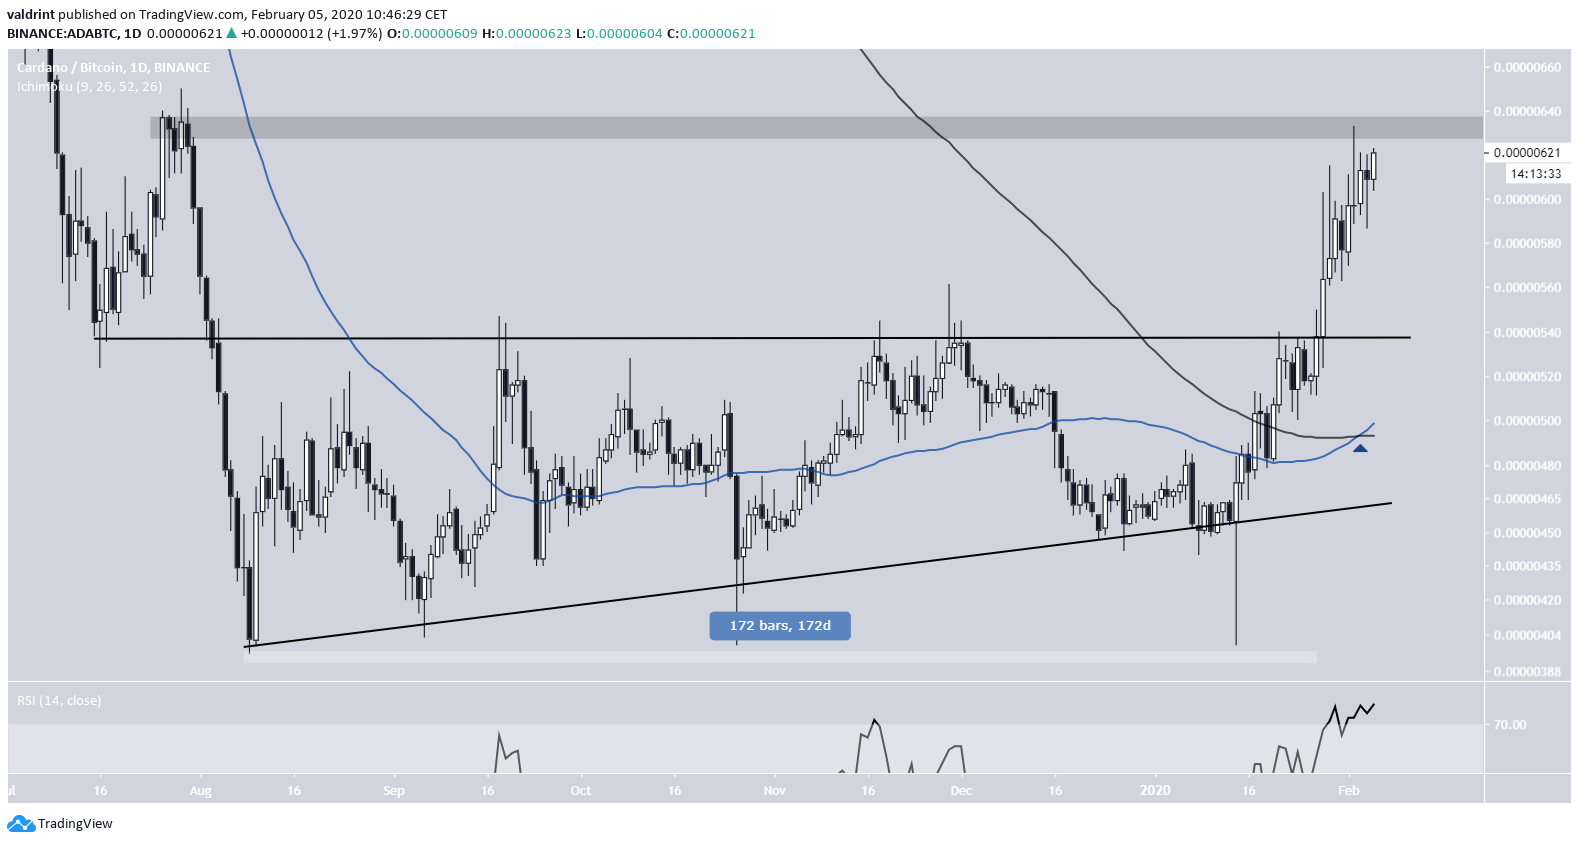 The reason for this delay can be seen in the weekly chart. The 630 satoshi area was reached in December of 2017 and acted as an all-time low until August 2019, when the price finally broke down.
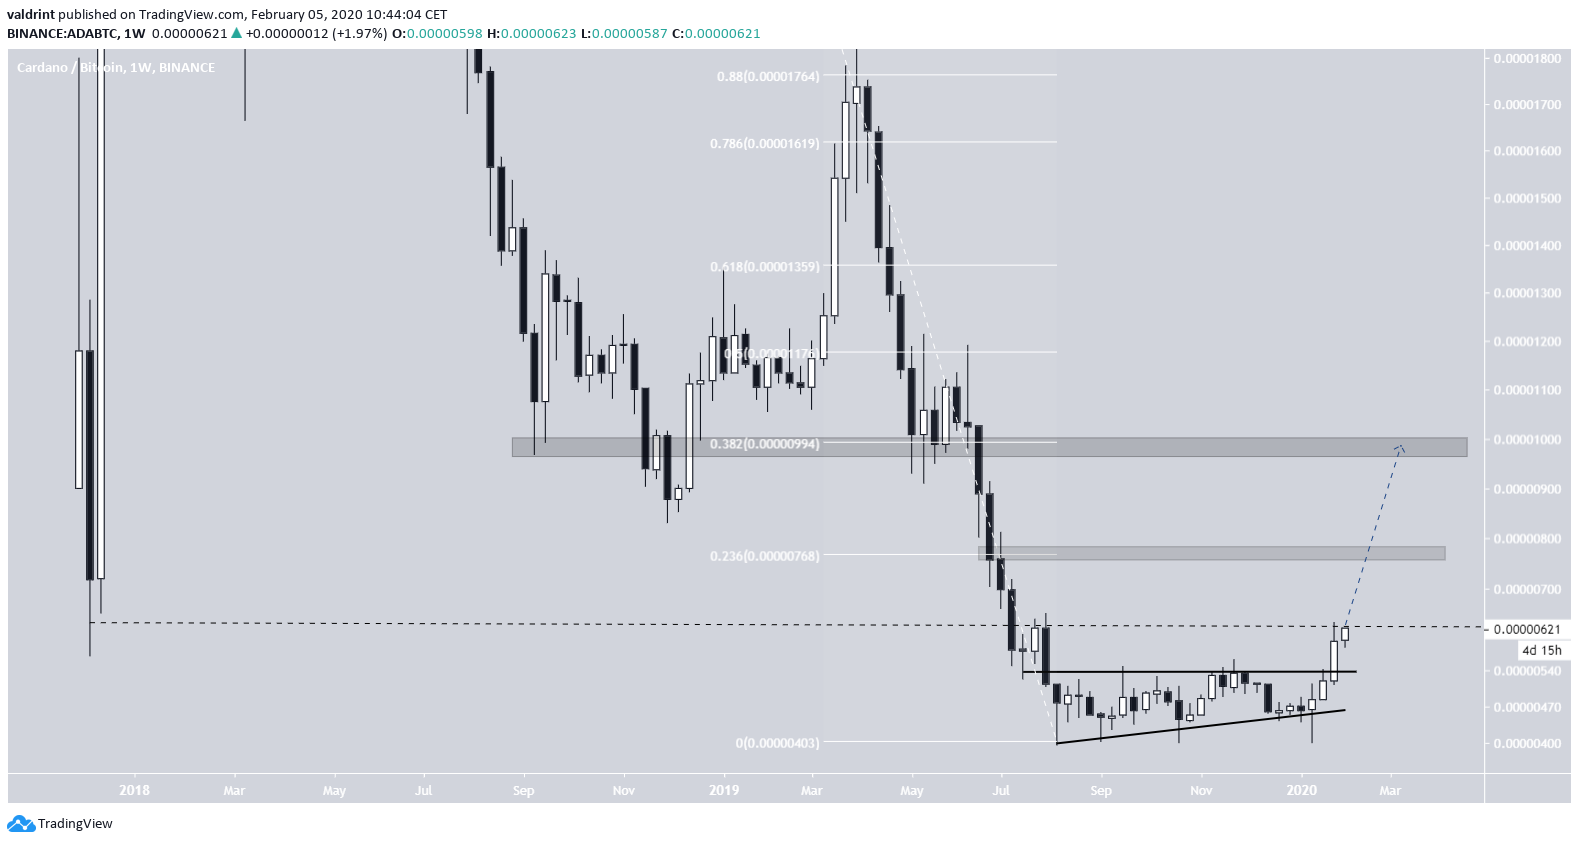
Once the price is successful in moving above this area, a strong move towards 1,000 satoshis would be not very surprising. The next resistance areas are found at 770 and 1,000 satoshis, respectively.
The reason for this delay can be seen in the weekly chart. The 630 satoshi area was reached in December of 2017 and acted as an all-time low until August 2019, when the price finally broke down.
Once the price is successful in moving above this area, a strong move towards 1,000 satoshis would be not very surprising. The next resistance areas are found at 770 and 1,000 satoshis, respectively.
Channel Breakout
Since the tweet, the ADA price has already broken out from the descending channel. Furthermore, it has moved above its 50-day moving average. The price broke out from a similar descending channel prior and the same MA on Feb 1, increasing by 9% after. An increase of the same magnitude from here would take the price clear above this resistance area.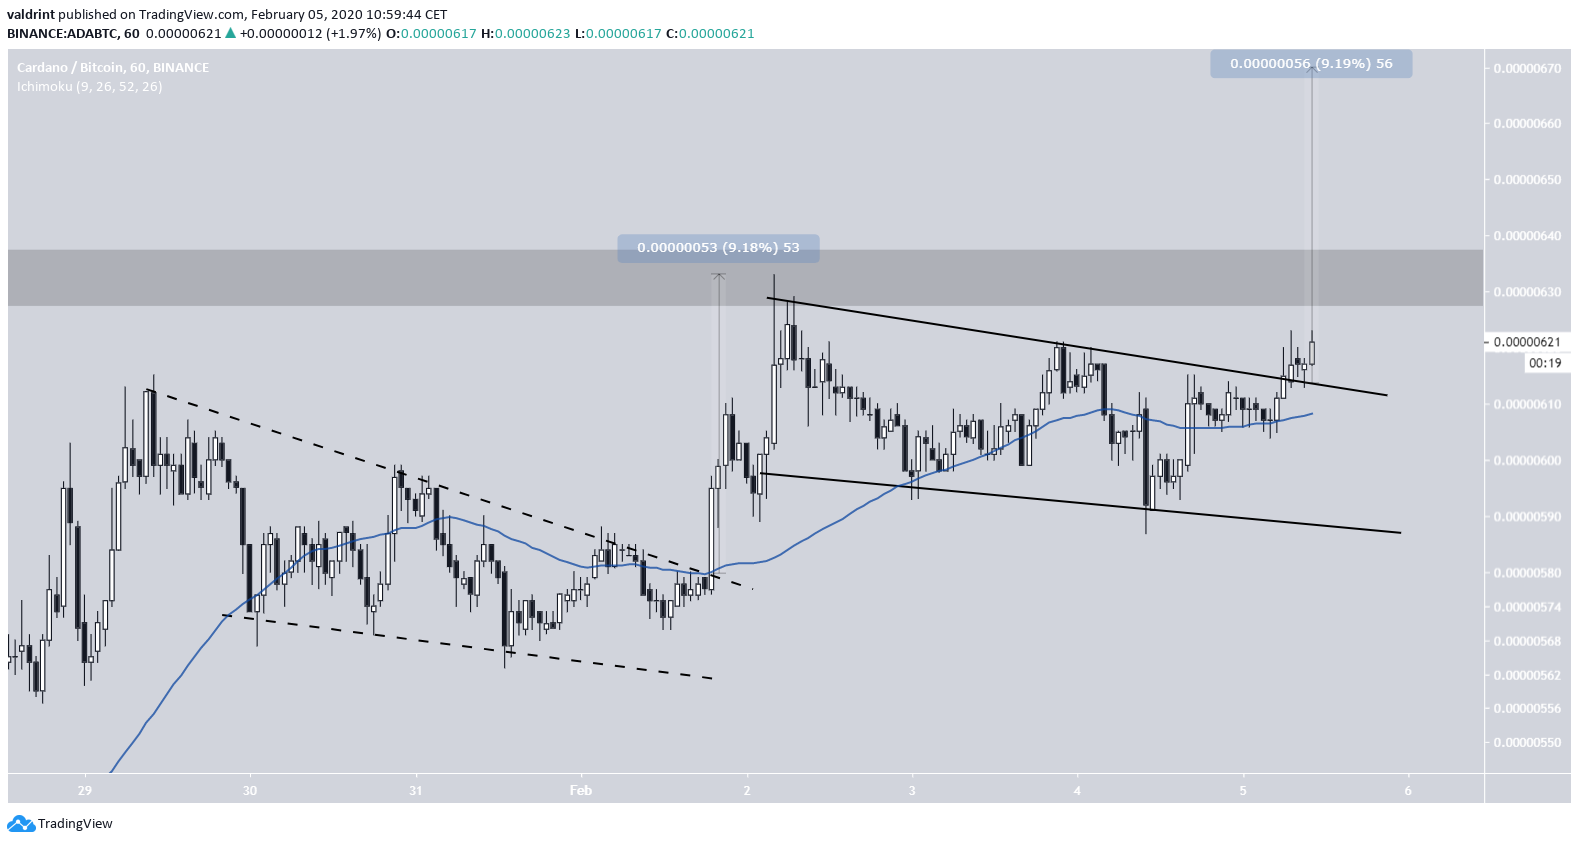
Future Movement
The price is currently trading inside a short-term ascending wedge, which is considered a bearish reversal pattern. Furthermore, the RSI has been generating bearish divergence for the entire duration of this pattern. Thus, a breakdown from the wedge is expected.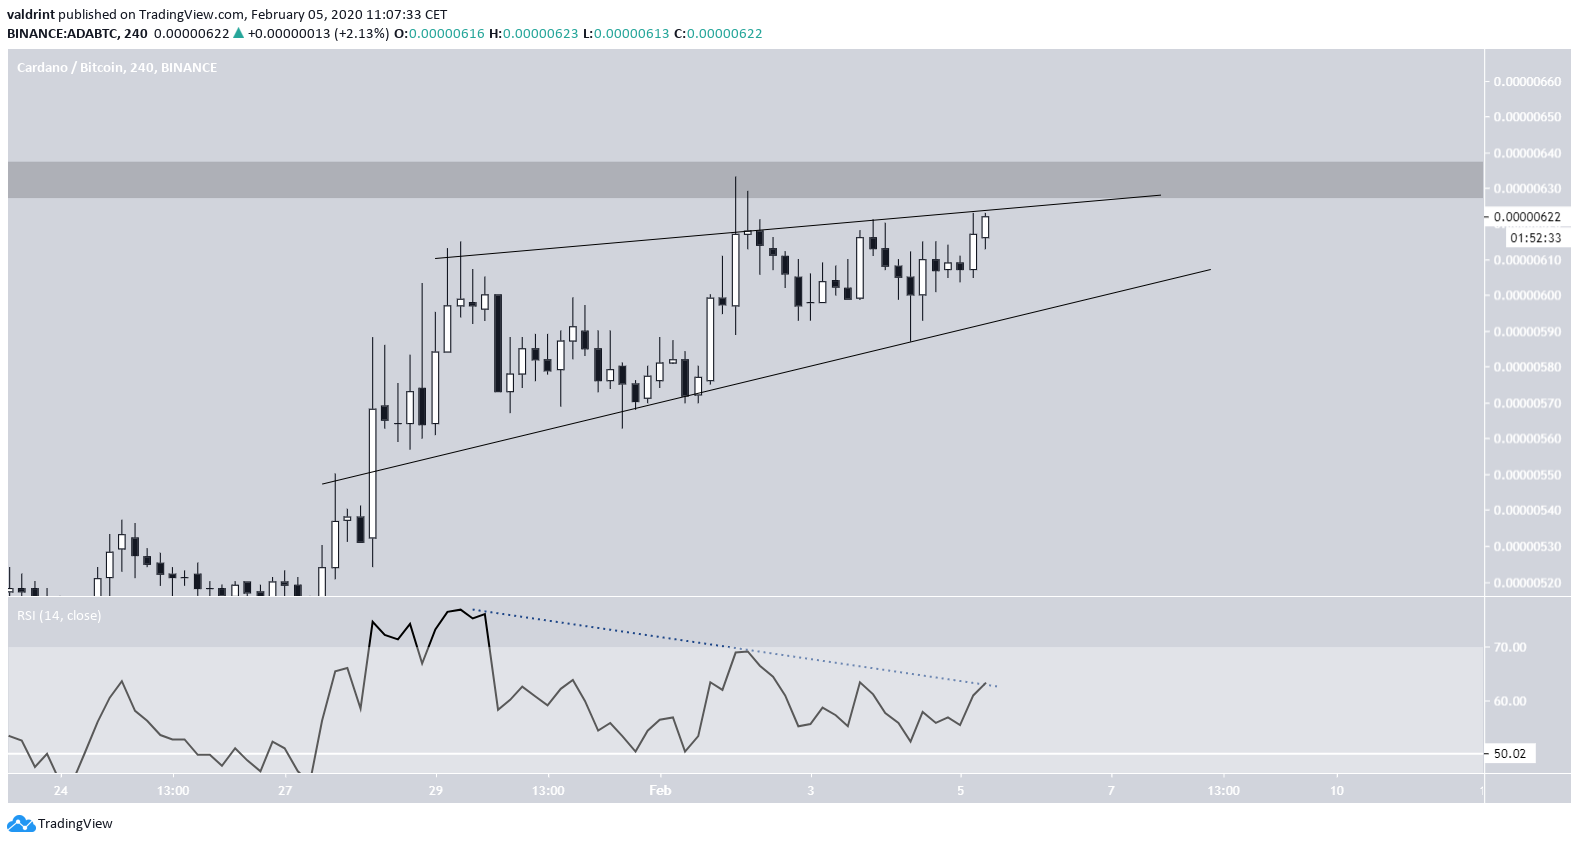 This proposed breakdown would cause the price to validate the previous breakout level as support, a customary movement that the ADA price has yet to do.
Afterward, the price is expected to continue moving upwards towards the 770 satoshi resistance area.
This proposed breakdown would cause the price to validate the previous breakout level as support, a customary movement that the ADA price has yet to do.
Afterward, the price is expected to continue moving upwards towards the 770 satoshi resistance area.
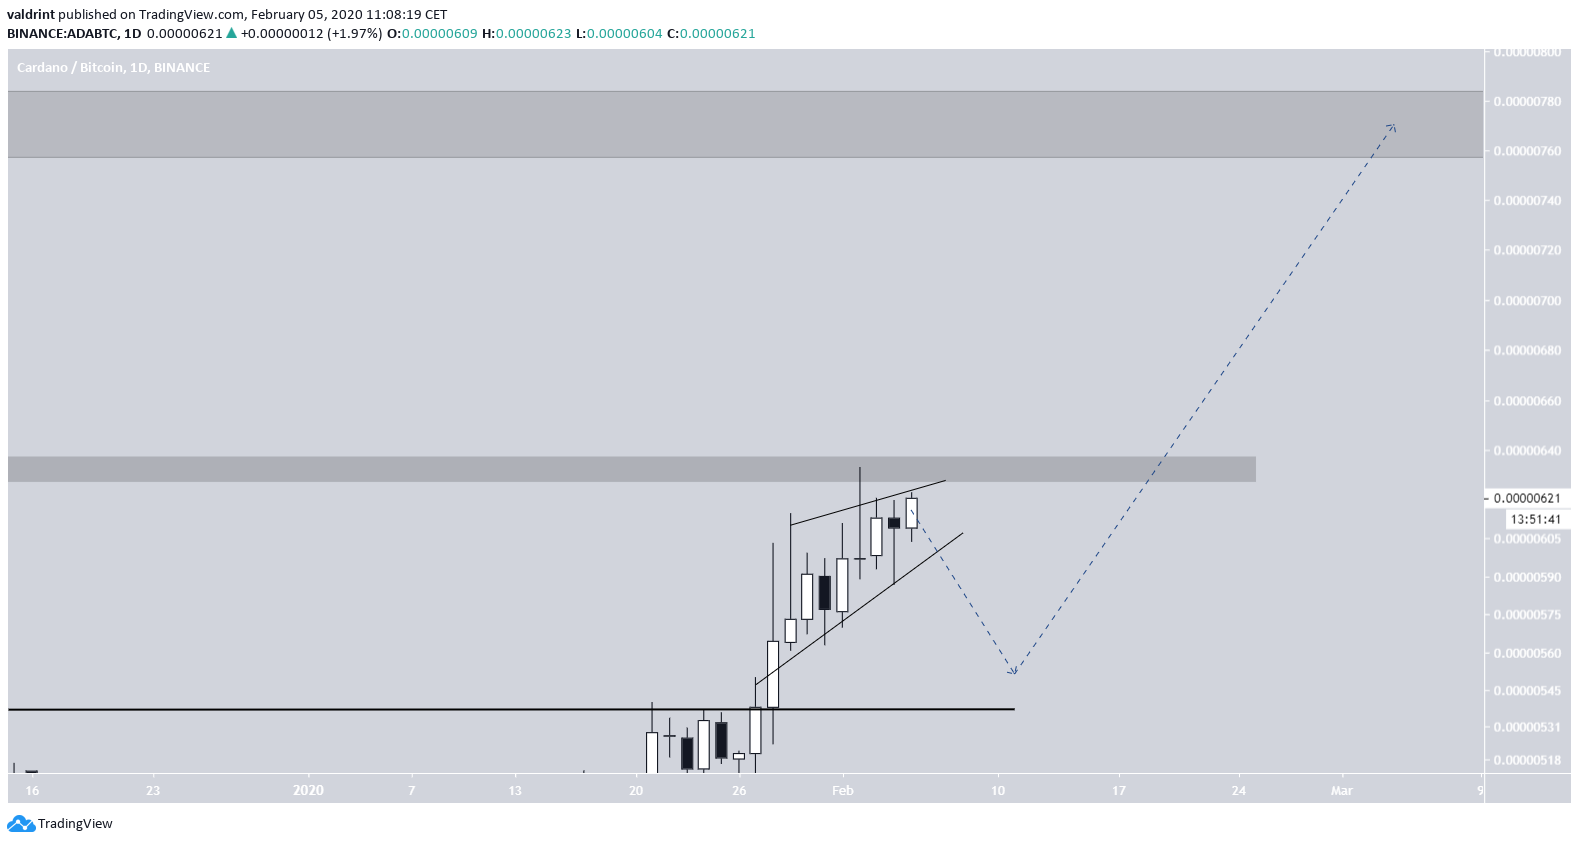 To conclude, the ADA price is trading inside a short-term bearish pattern. A breakdown from this pattern is expected, followed by the continuation of the current upward move towards the resistance areas outlined above.
Disclaimer
In line with the Trust Project guidelines, this price analysis article is for informational purposes only and should not be considered financial or investment advice. BeInCrypto is committed to accurate, unbiased reporting, but market conditions are subject to change without notice. Always conduct your own research and consult with a professional before making any financial decisions. Please note that our Terms and Conditions, Privacy Policy, and Disclaimers have been updated.

Valdrin Tahiri
Valdrin discovered cryptocurrencies while he was getting his MSc in Financial Markets from the Barcelona School of Economics. Shortly after graduating, he began writing for several different cryptocurrency related websites as a freelancer before eventually taking on the role of BeInCrypto's Senior Analyst.
(I do not have a discord and will not contact you first there. Beware of scammers)
READ FULL BIO
Sponsored
Sponsored