The Cardano (ADA) price has been falling since July 24. While a short/medium-term bounce is expected, it is unclear whether the correction has reached an end.
ADA Resting at Support
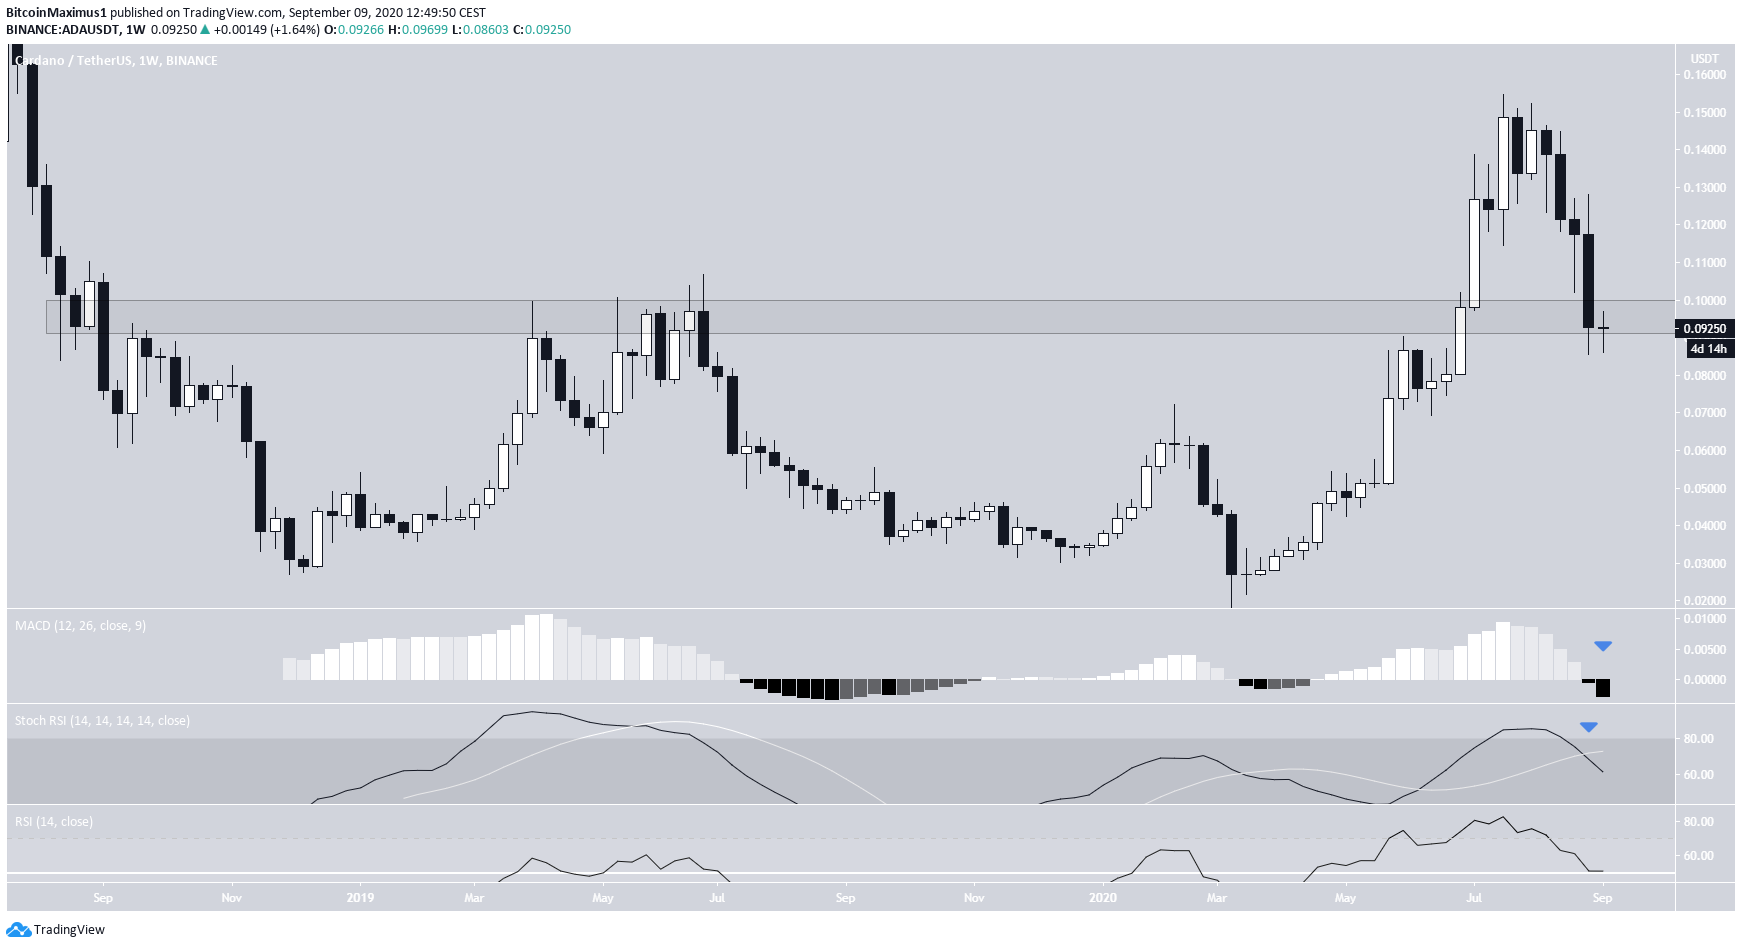
Even though ADA was one of the biggest risers throughout March and May, the price reached a top of $0.154 on July 24 and has been moving downwards since. Similar to the rest of the market, the decline accelerated on September 1.
The price has approached a long-term support level at $0.09. Previously, the same area acted as resistance during June and July 2019.
Long-term technical indicators are bearish. Both the RSI and the Stochastic RSI are falling, the latter having made a bearish cross. The MACD has already crossed into negative territory.
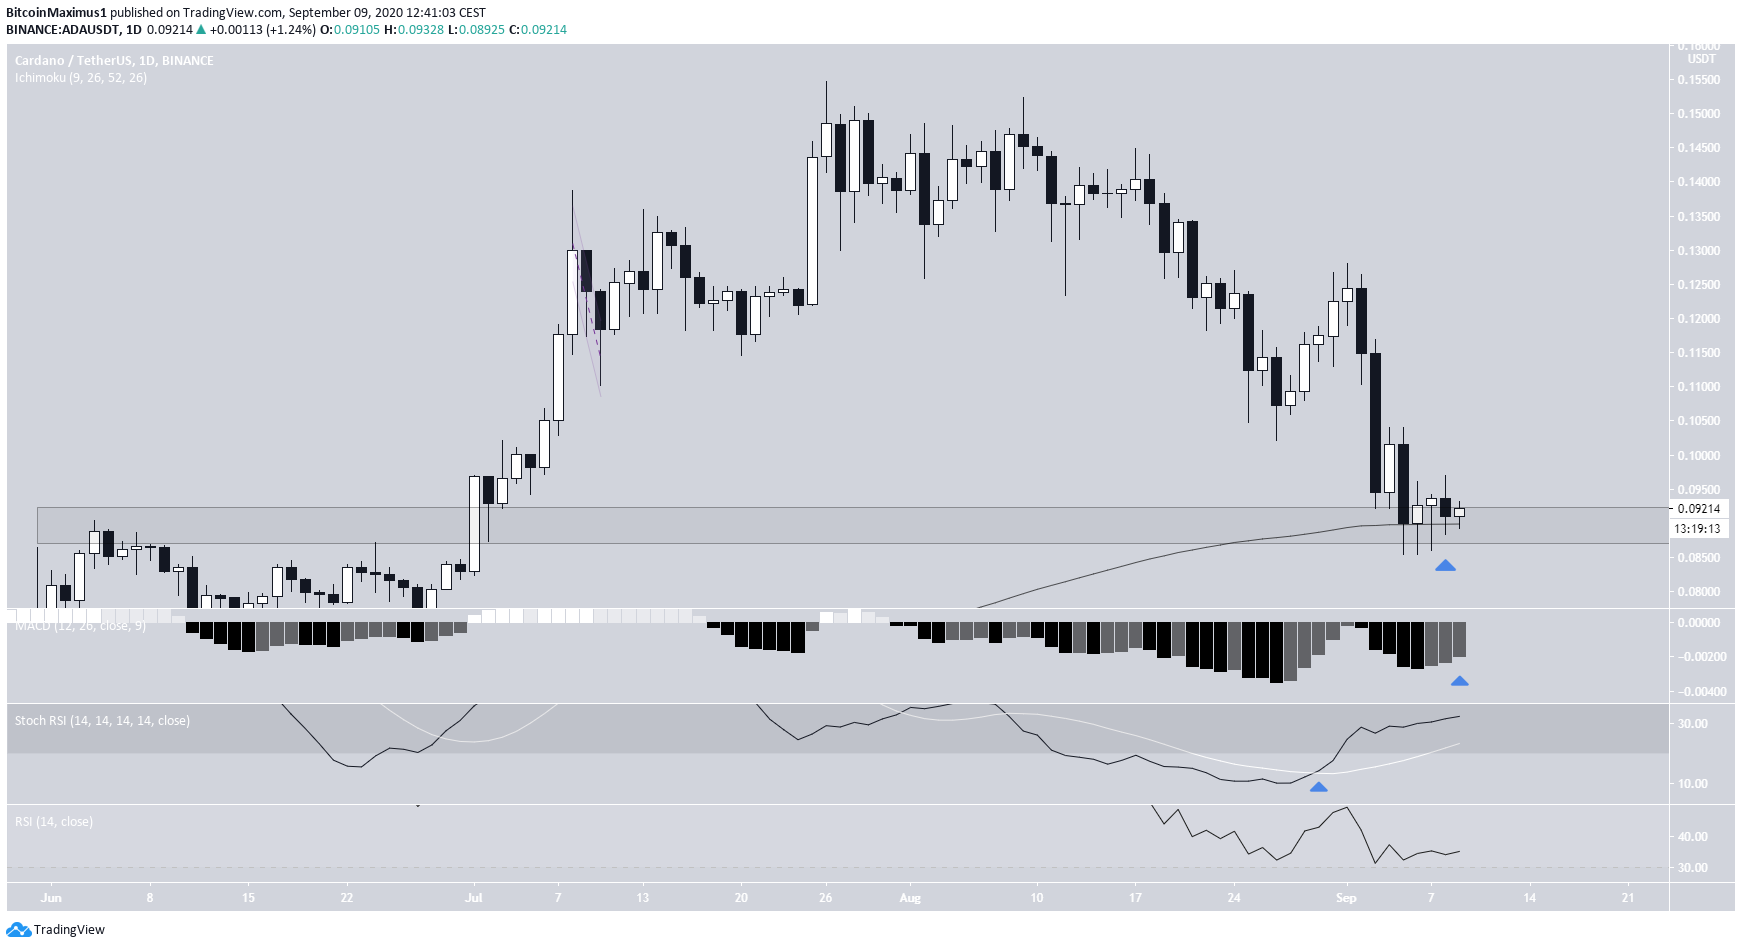
At the time of writing, the price was resting at the $0.09 support area. This area is strengthened by the presence of the 200-day moving average (MA).
Technical indicators are neutral, leaning bullish. The MACD has begun to rise, and the stochastic RSI has made a bullish cross. However, the slope of the latter is very gradual, and the regular RSI is moving down.
While these suggest a bounce might occur, the bias remains bearish due to the long-term readings.
Wave Count
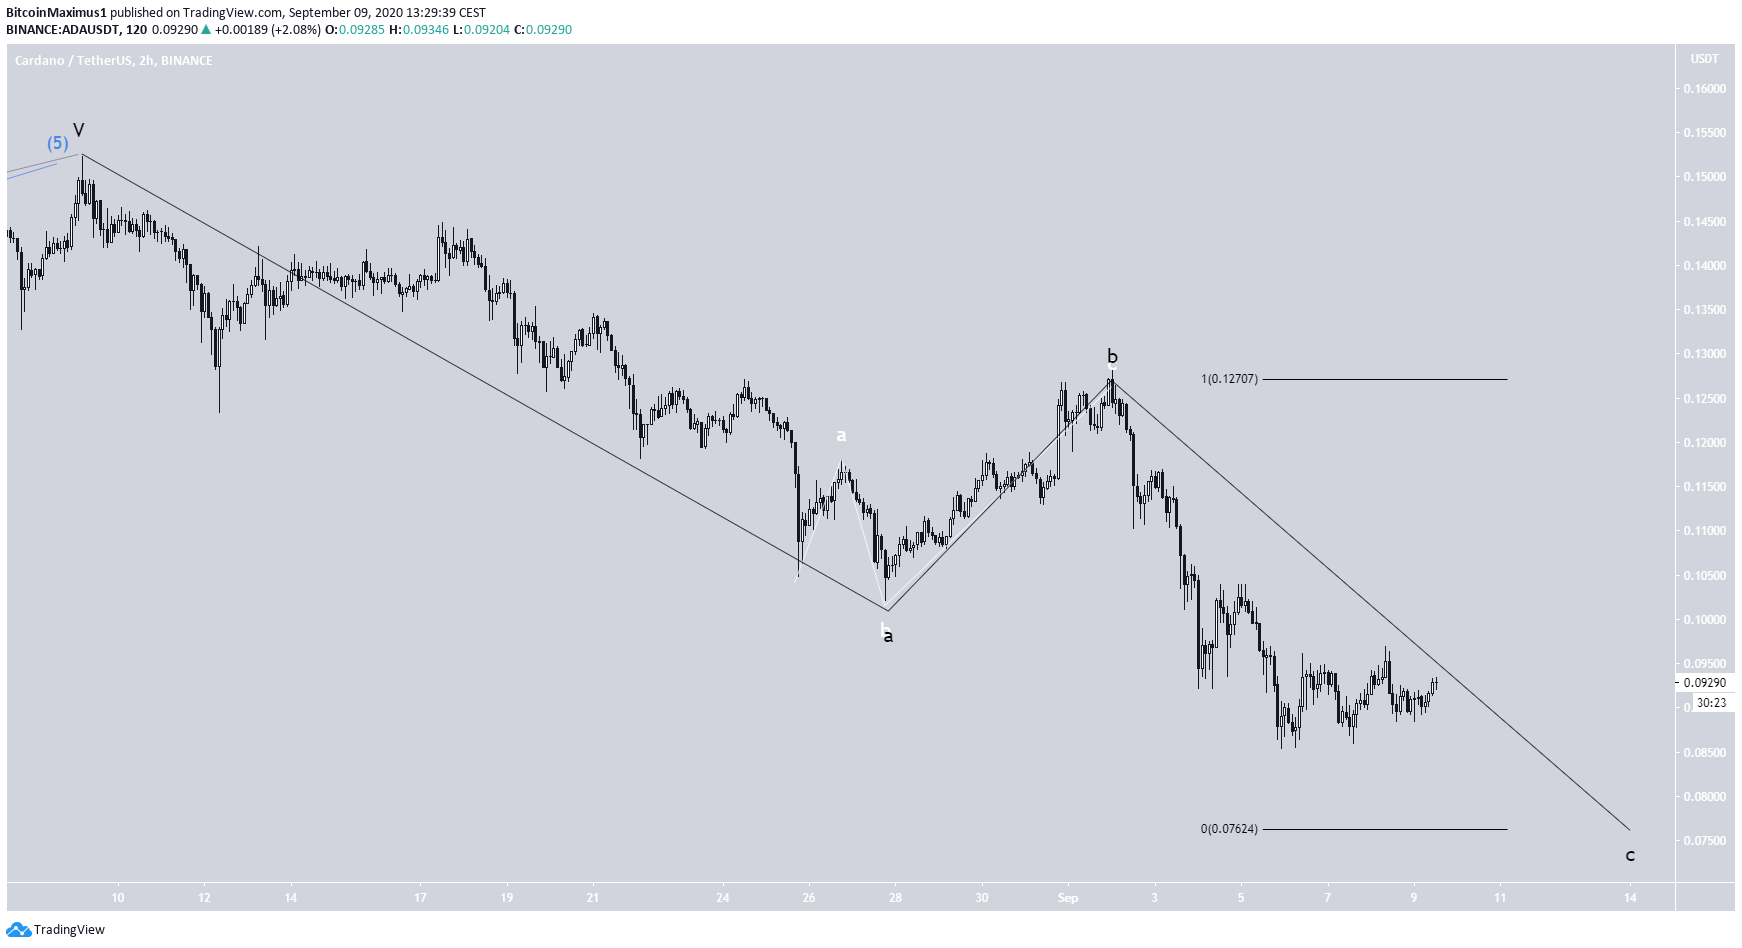
Beginning on March 13, the ADA price has likely completed a five-wave formation (in black below) with an extended fifth wave. It contains another impulse inside of it (blue). If the formation is correct, the ADA price has either begun an A-B-C correction or a bearish impulse.
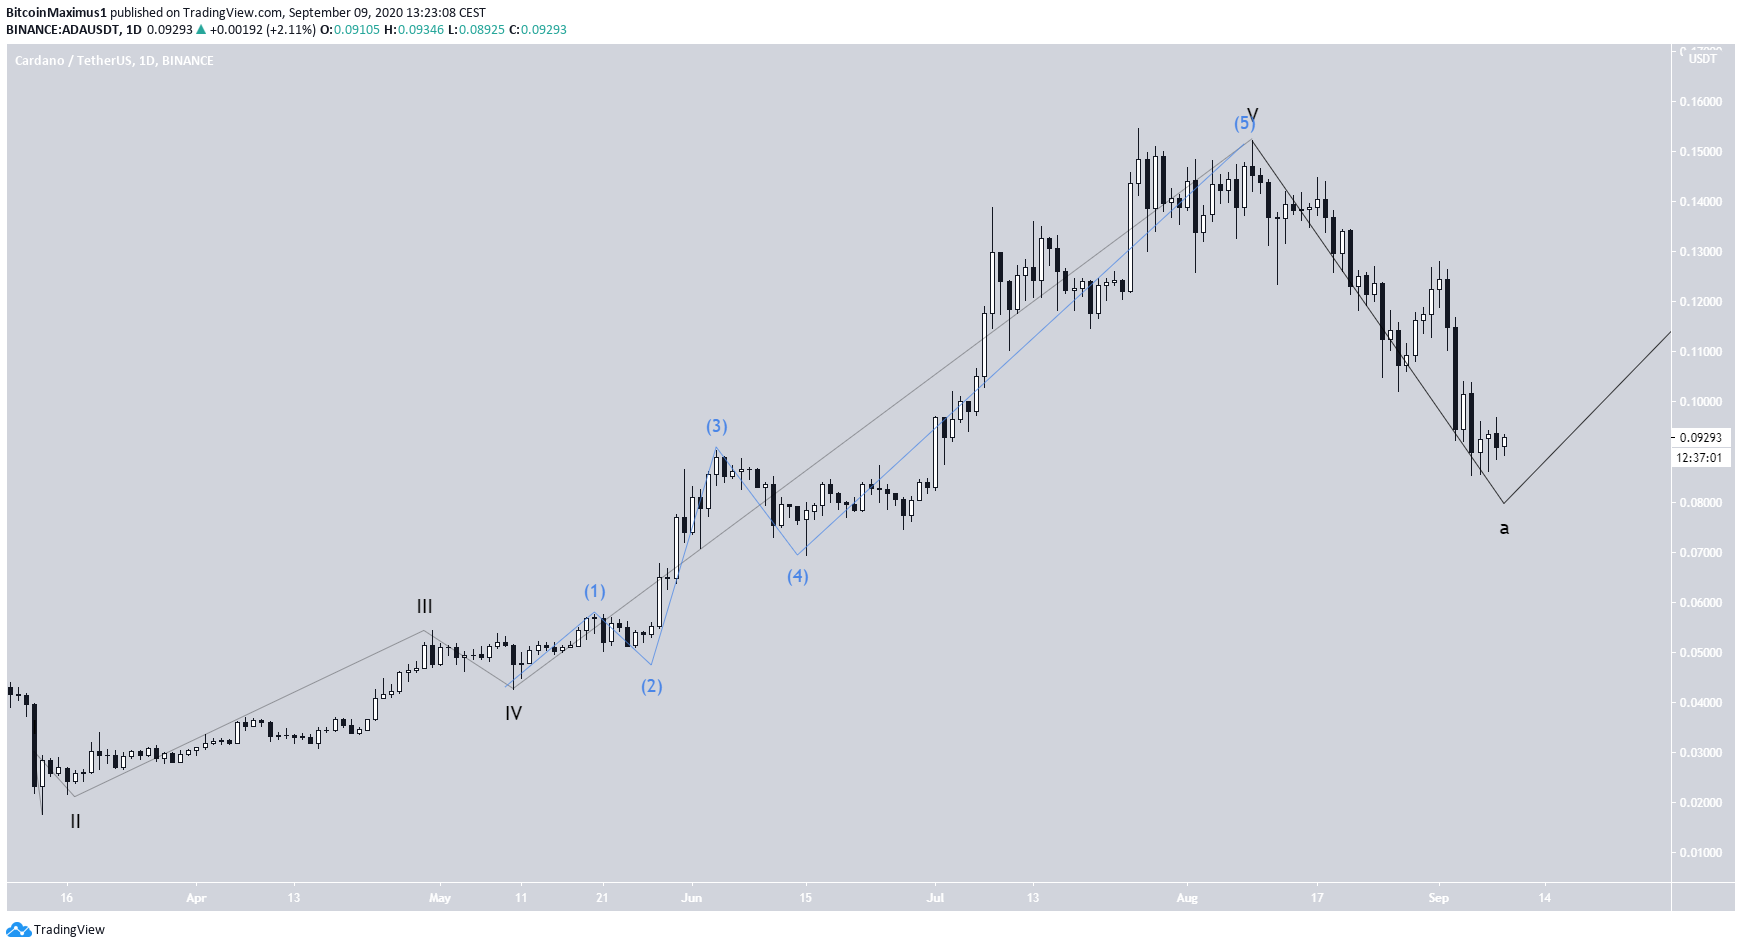
The shorter-term movement indicates that the price has likely begun a correction since the decline has taken the three-wave form instead of a five-wave one. The price is likely in sub-wave c (black), which could end at $0.078 if sub-waves A to C have a 1:1 ratio, which is quite common.
ADA/BTC
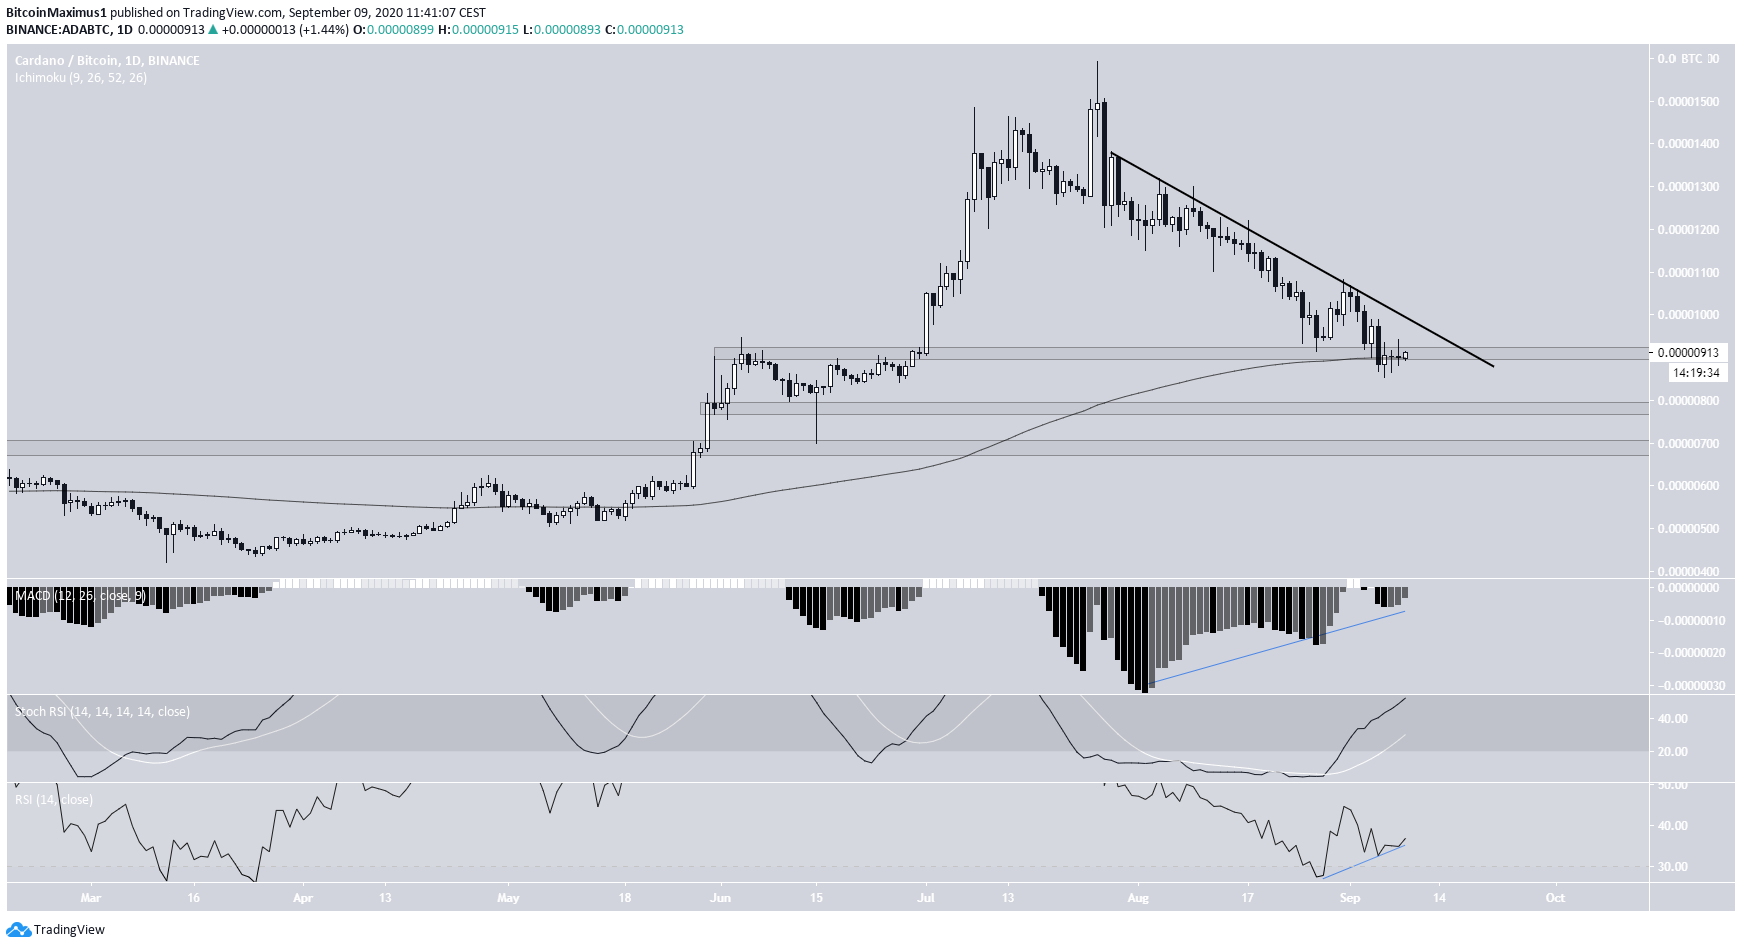
Cryptocurrency trader @cryptoNTez stated that the ADA price is likely to continue falling towards 800, and eventually 690 and 630 satoshis.
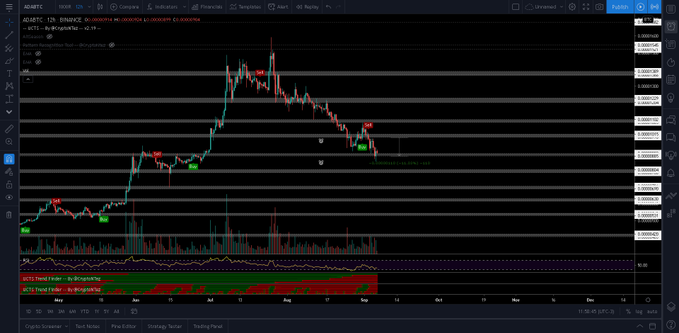
At the time of writing, ADA had dropped below and was struggling to reclaim the 915 satoshi area, which is also the 200-day moving average (MA).
Whether it is successful in doing so will be crucial in determining the direction of the next move. Failure would likely take the price towards the next support areas at 800 and 690 satoshis.
Technical indicators have turned bullish. There is significant bullish divergence on both the RSI and the MACD, while the Stochastic RSI has made a bullish cross.
If ADA manages to reclaim the resistance area and break out from the descending resistance line, it could head towards 1300 satoshis.