
The Aave (AAVE) price has broken out from a descending resistance line that’s been in place since hitting a high on Aug 26.
Despite the breakout, the price was rejected by an important Fib resistance level and is expected to decrease in the short-term.
AAVE Breaks Out from Resistance
The AAVE price has been increasing since it reached a low of $24.66 on Nov 5. The increase has been swift, causing a breakout from a descending resistance line that had been in place for more than two months. On Nov 11, the price reached a high of $72.01, measuring an increase of 193% from the aforementioned Nov 5 low.
However, it seems as AAVE has been rejected by the 0.618 Fib level of the entire downward move at $65 and is in the process of creating a bearish candlestick.
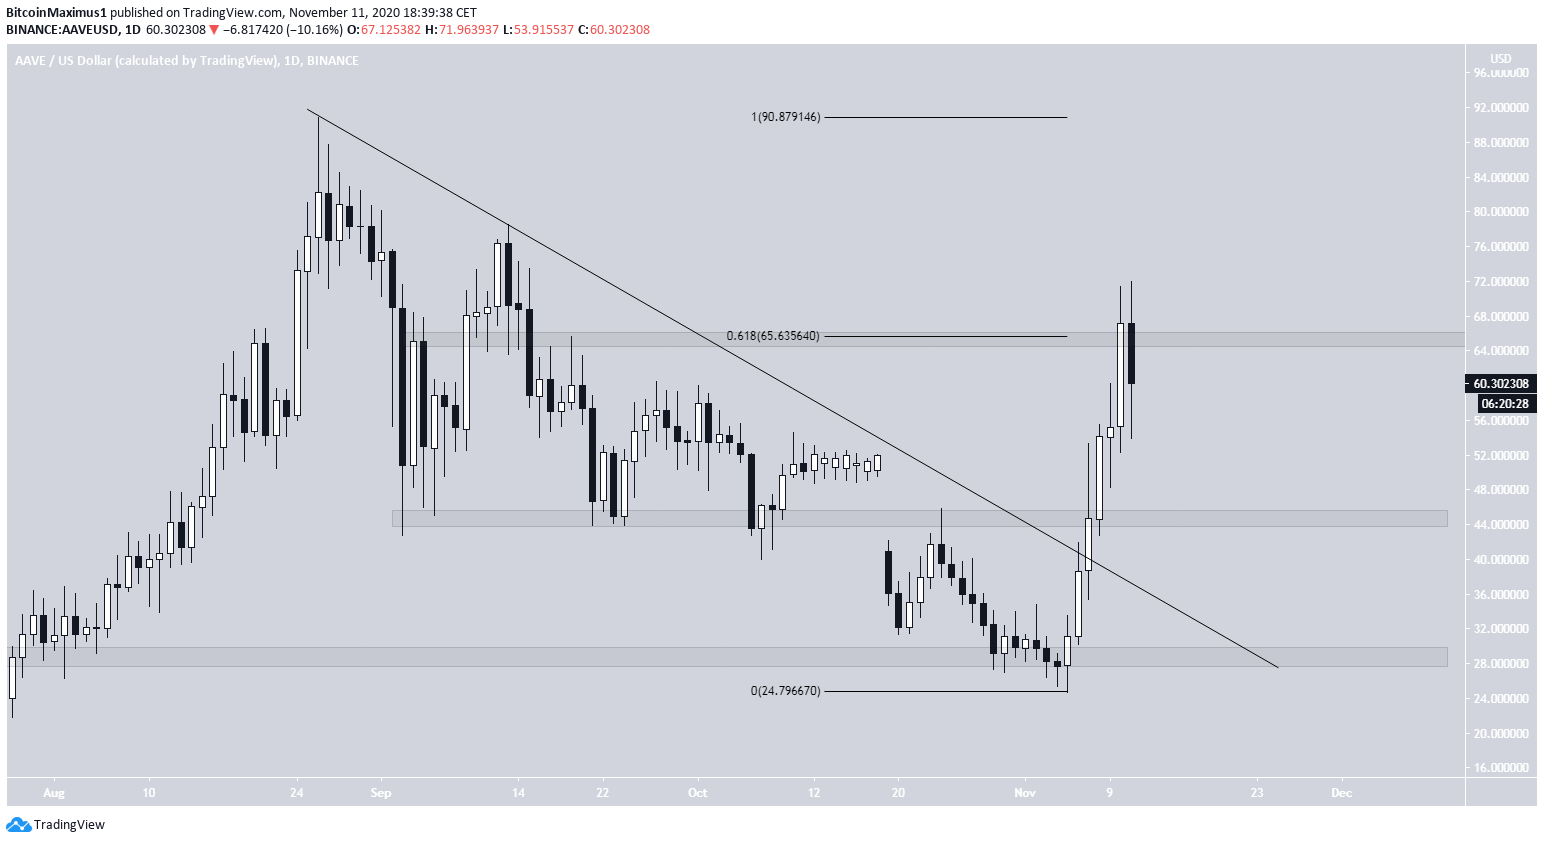
If the price continues to decrease, the closest support area is found at $45.
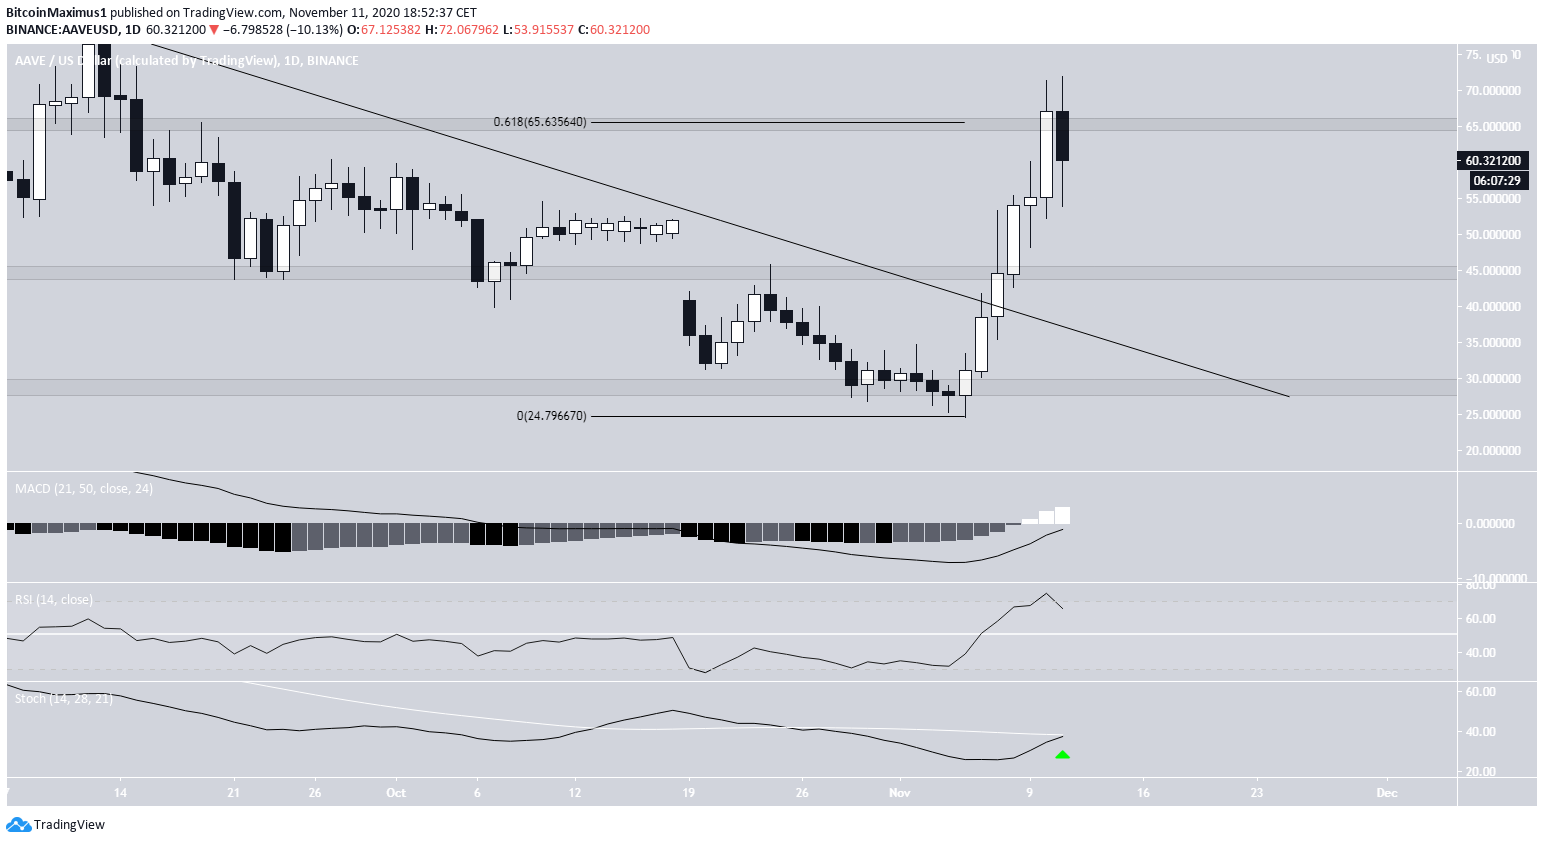
Despite the rejection, technical indicators in the daily time-frame are bullish. The MACD has been steadily increasing and has nearly crossed into positive territory. The RSI has also been moving up and now is in the overbought territory. Furthermore, the Stochastic oscillator is very close to making a bullish cross.
While a short-term decrease could occur, it seems that the AAVE price has not yet reached a top.
Short-Term Movement
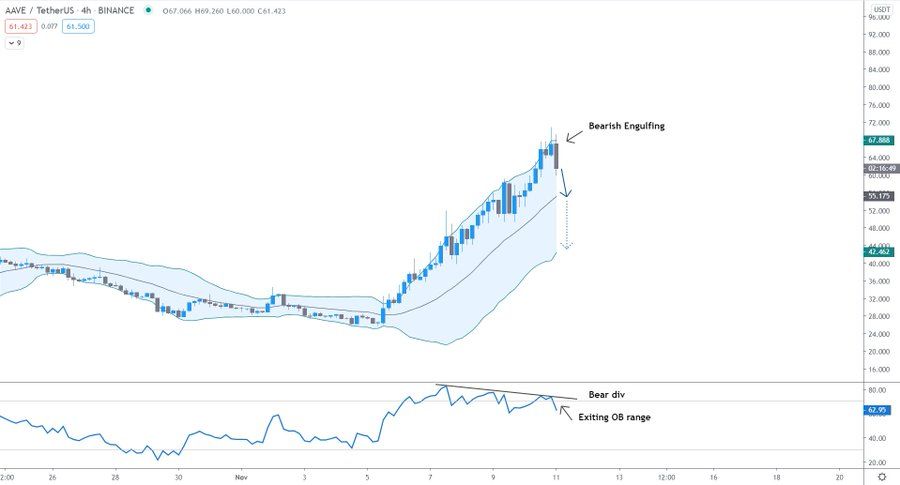
Cryptocurrency trader @TradingTank outlined an AAVE chart, stating that it looks ready for a correction. Tank outlined a bearish engulfing candlestick and bearish divergence in the RSI to support the downward move scenario.
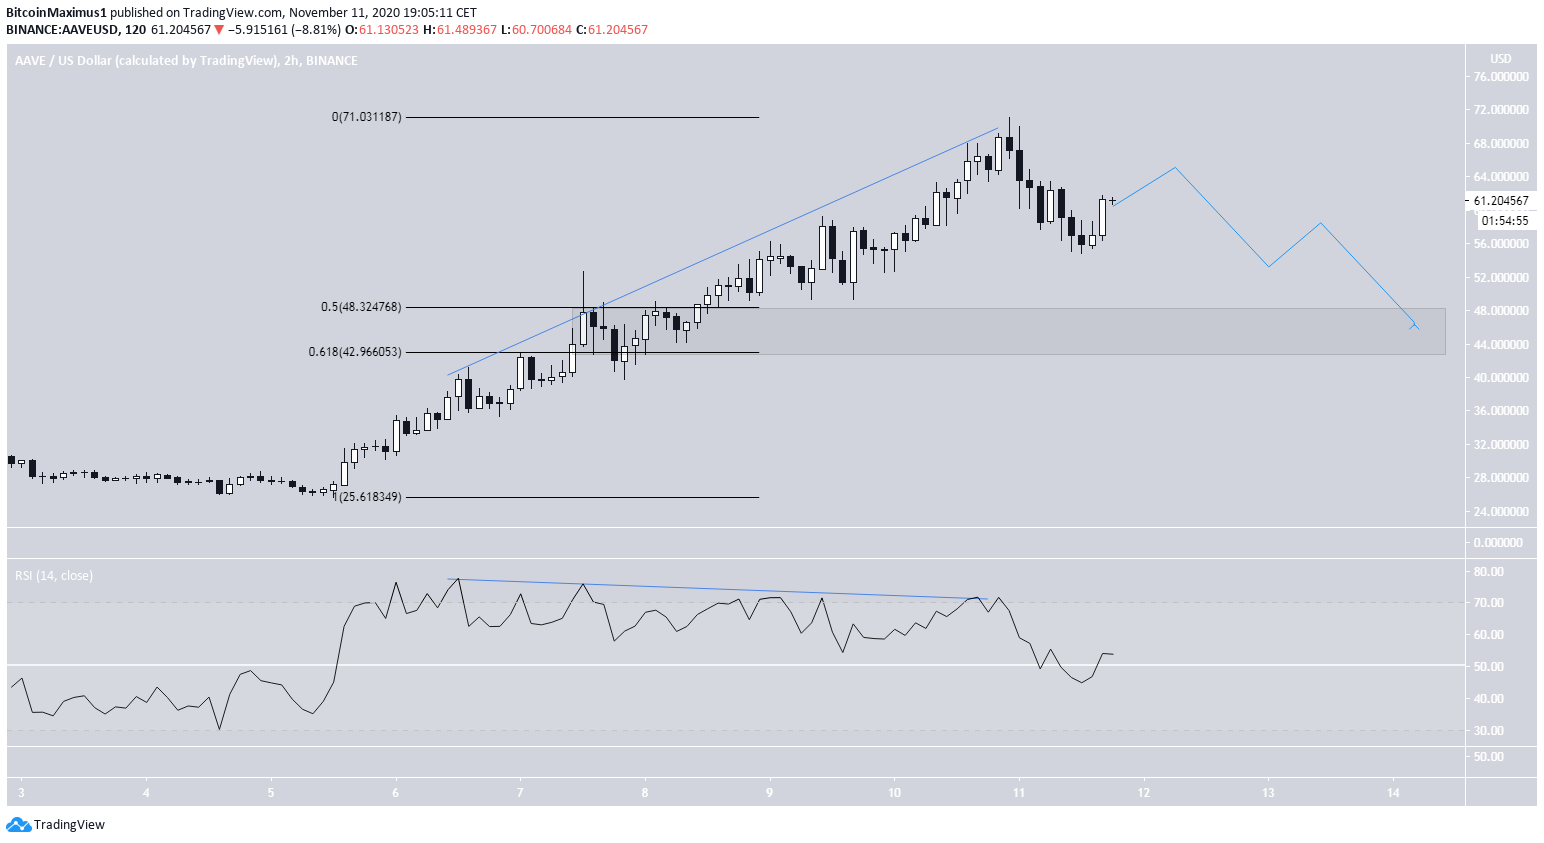
The shorter-term two-hour chart shows a nearly parabolic increase prior to the breakout that led to the $72 high. However, it also shows a pronounced bearish divergence in the RSI that preceded the current decrease.
The 0.5-0.618 Fib area is found between $42-$48, aligning with the previously mentioned $45 area, and making it a likely level for a bottom to be reached.
Therefore, the AAVE price is expected to gradually decrease towards $45 before potentially making another breakout attempt.
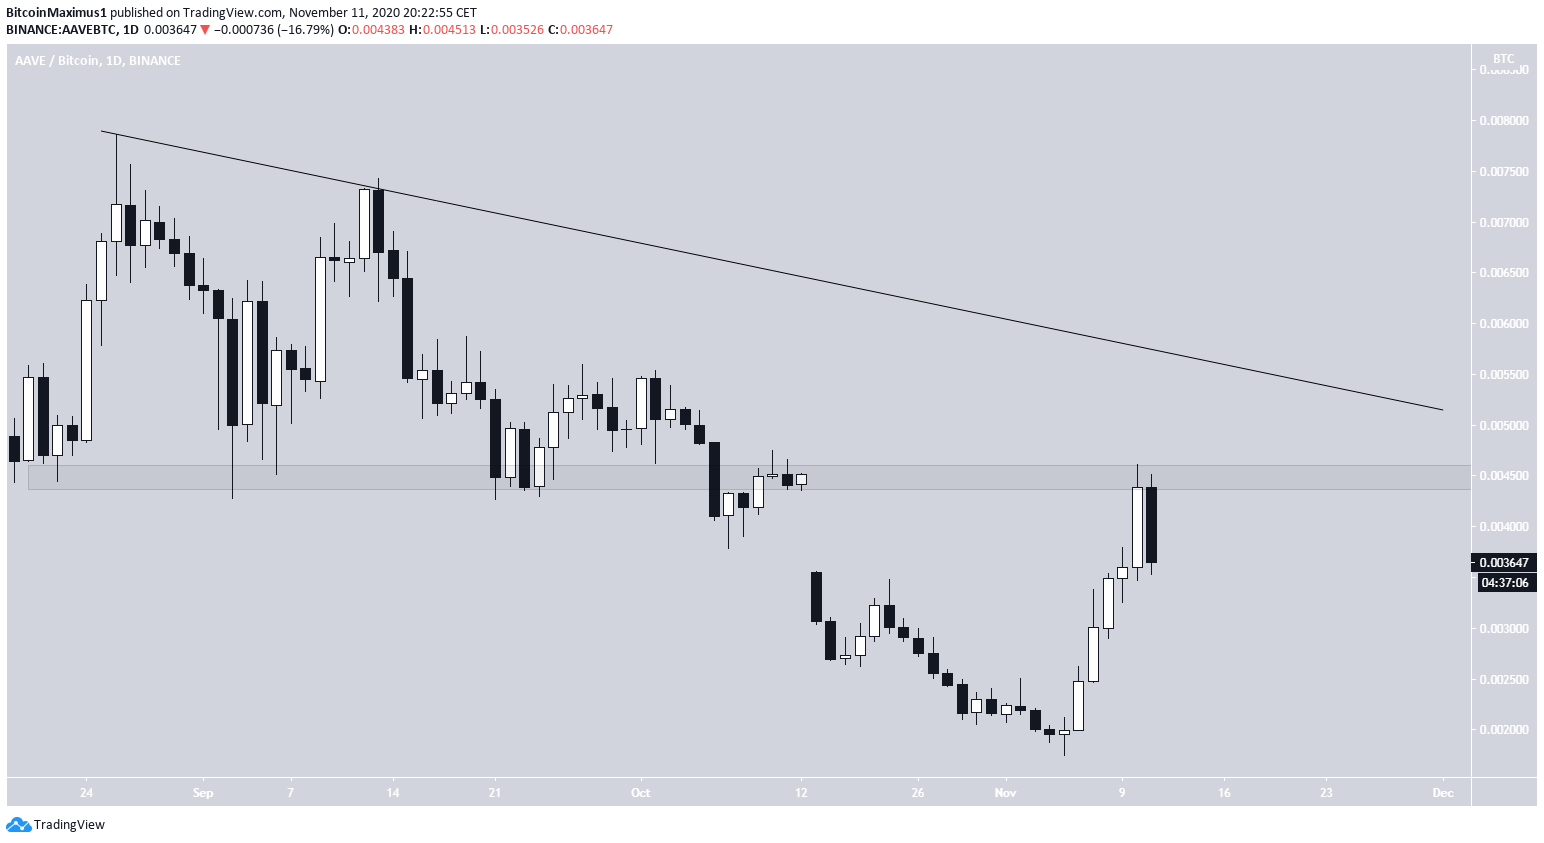
AAVE/BTC
The AAVE/BTC chart is considerably more bearish than its USD counterpart.
First, the price is still following a descending resistance line, as opposed to the USD pair which has already broken out.
Second, the price has been rejected by the ₿0.0045 resistance area, which previously acted as support.
Until the price is successful in breaking out from this level and the resistance line after, it is likely that the trend is bearish.
Conclusion
AAVE is expected to decrease in the short-term, gradually dropping towards the support levels near $45 before attempting another breakout.
For BeInCrypto’s latest Bitcoin analysis, click here!
Disclaimer: Cryptocurrency trading carries a high level of risk and may not be suitable for all investors. The views expressed in this article do not reflect those of BeInCrypto.
