

After a breakout from a long-term descending resistance line, Aave (AAVE) is attempting to find short-term support and create a higher low.
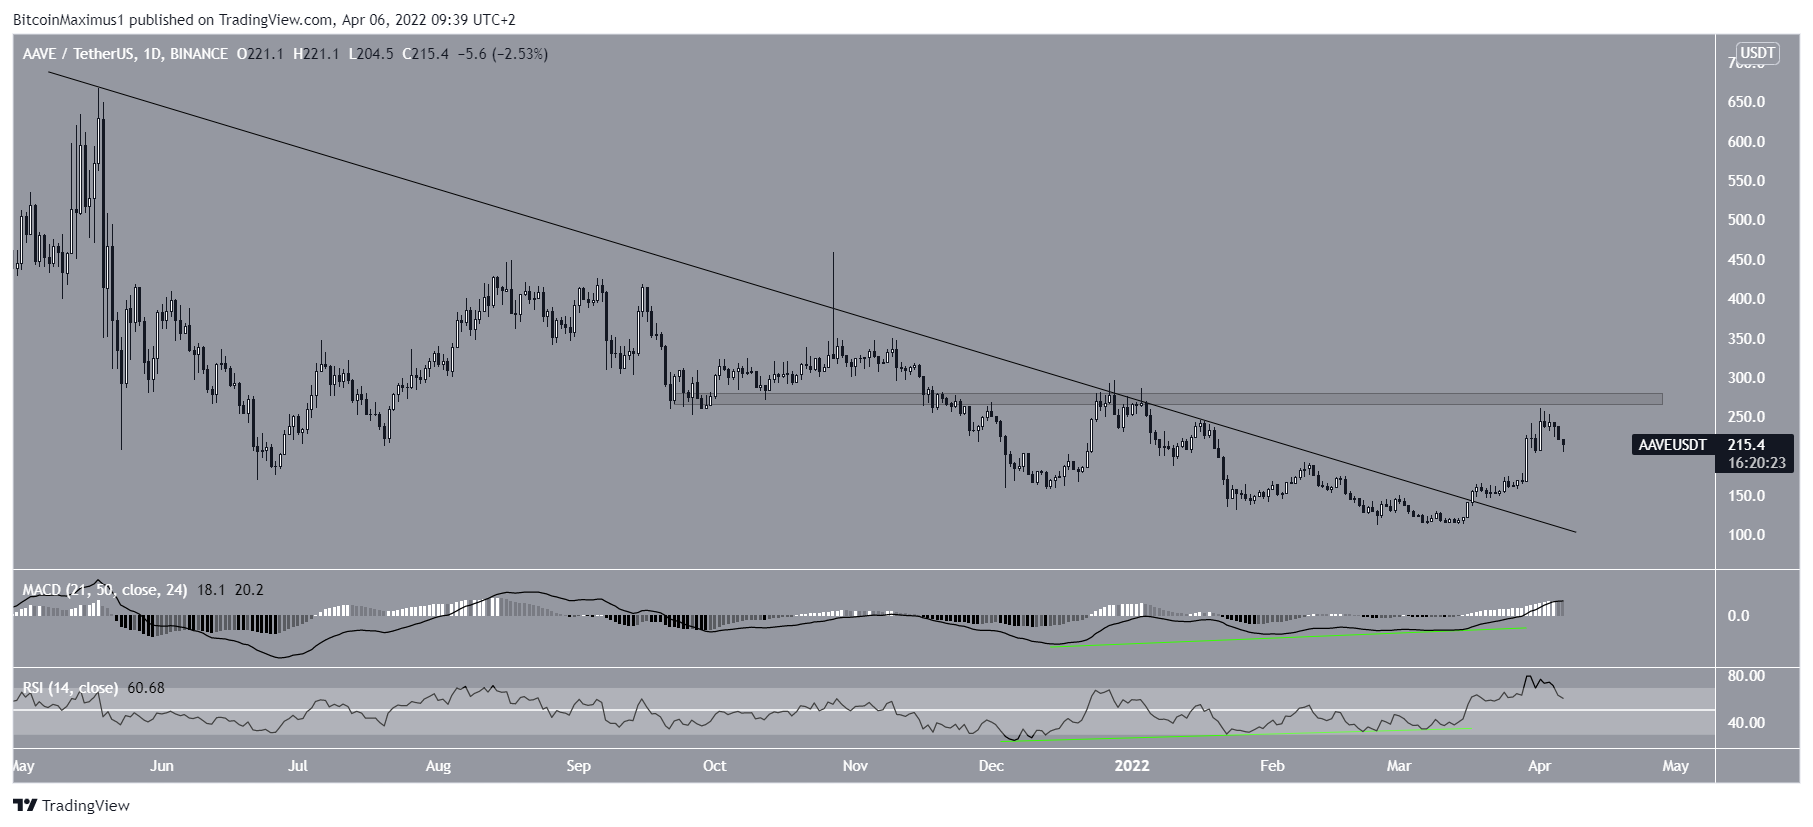
AAVE has been decreasing underneath a descending resistance line since reaching an all-time high price of $668 on May 18 2021. The decrease led to a low of $112.4 on May 24 2021.
The price has been moving upwards since and broke out from the descending resistance line on March 17. At the time, the line had been in place for 302 days.
So far, the upward movement has led to a high of $261 on April 1. This was just below the $275 resistance area.
An interesting development is a surge in volume on March 29, 30, and April 1. Such levels of volume had previously not been seen since the Oct 2021 breakout attempts and May all-time high (red circles).

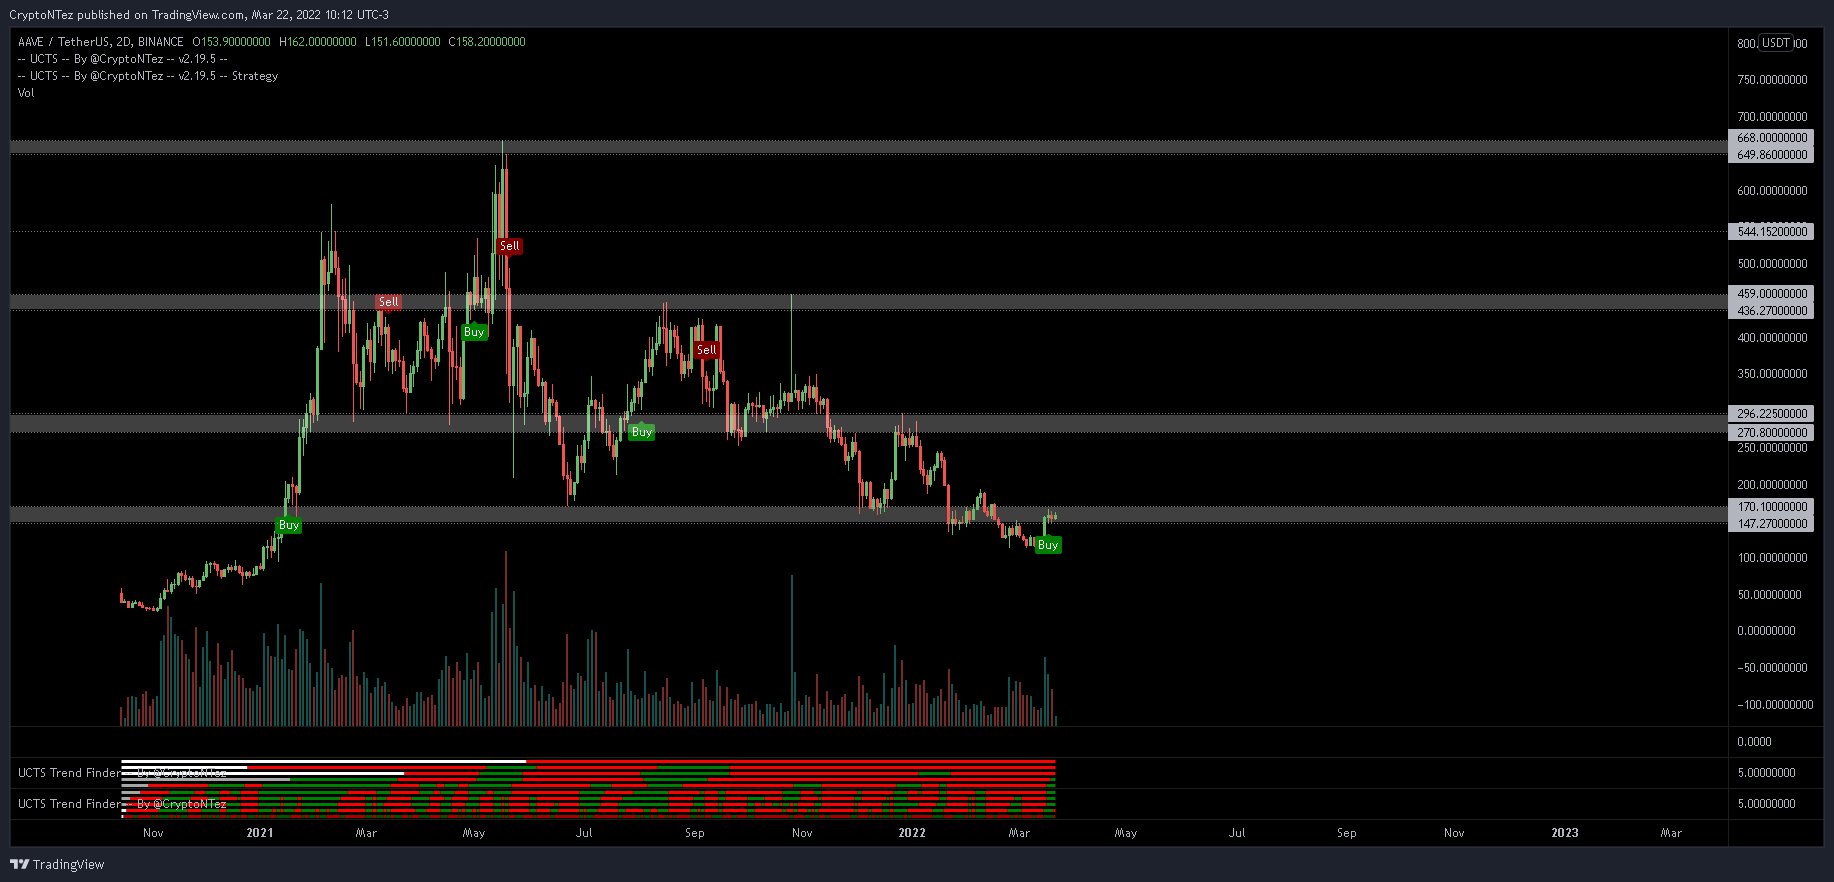
Cryptocurrency trader @CryptoNTez tweeted a chart of AAVE, stating that the price could pump soon alongside the rest of the bullish market.
A closer look at the daily movement and technical indicators are required in order to determine if AAVE will continue to increase.
Ongoing upward movement
Alongside the surge in volume, both the RSI and MACD are bullish. This is evident by the pronounced bullish divergences (green lines) that have developed in both the RSI and MACD. Such divergences often precede bullish trend reversals, as was the case in AAVE.
Additionally, the MACD is positive and the RSI is above 50. These are both considered signs of a bullish trend.
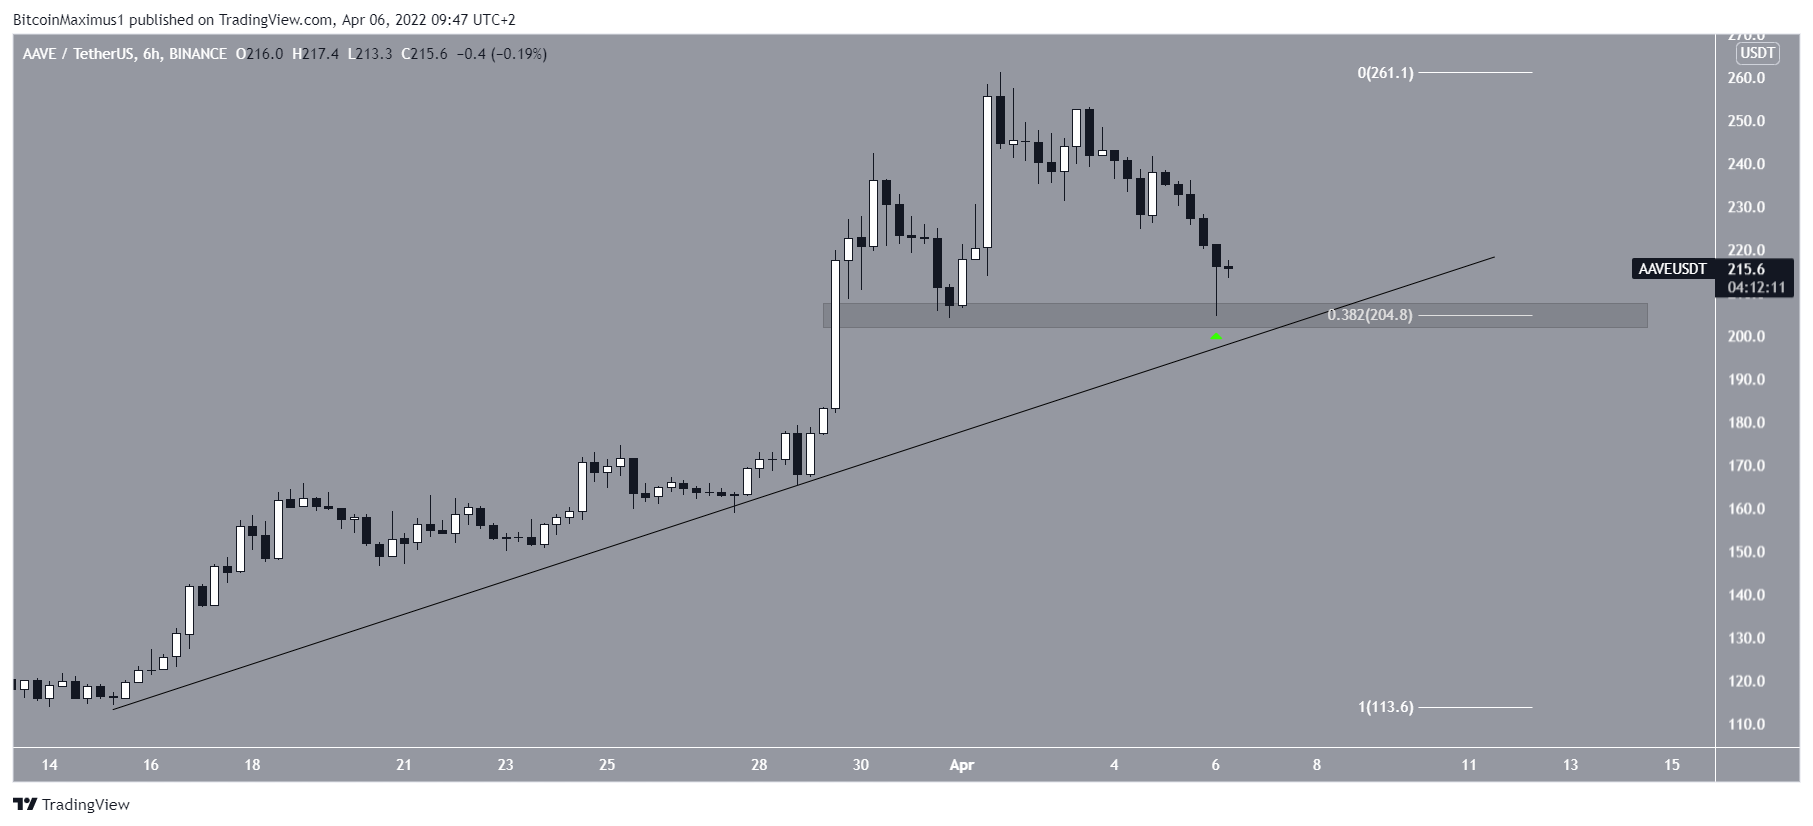
The six-hour chart shows that despite the ongoing drop, AAVE has bounced at a confluence of support levels at $205 (green icon).
The support is created by :
- An ascending support line
- A horizontal support area
- The 0.382 Fib retracement support level.
Therefore, as long as this area holds, the trend remains bullish.
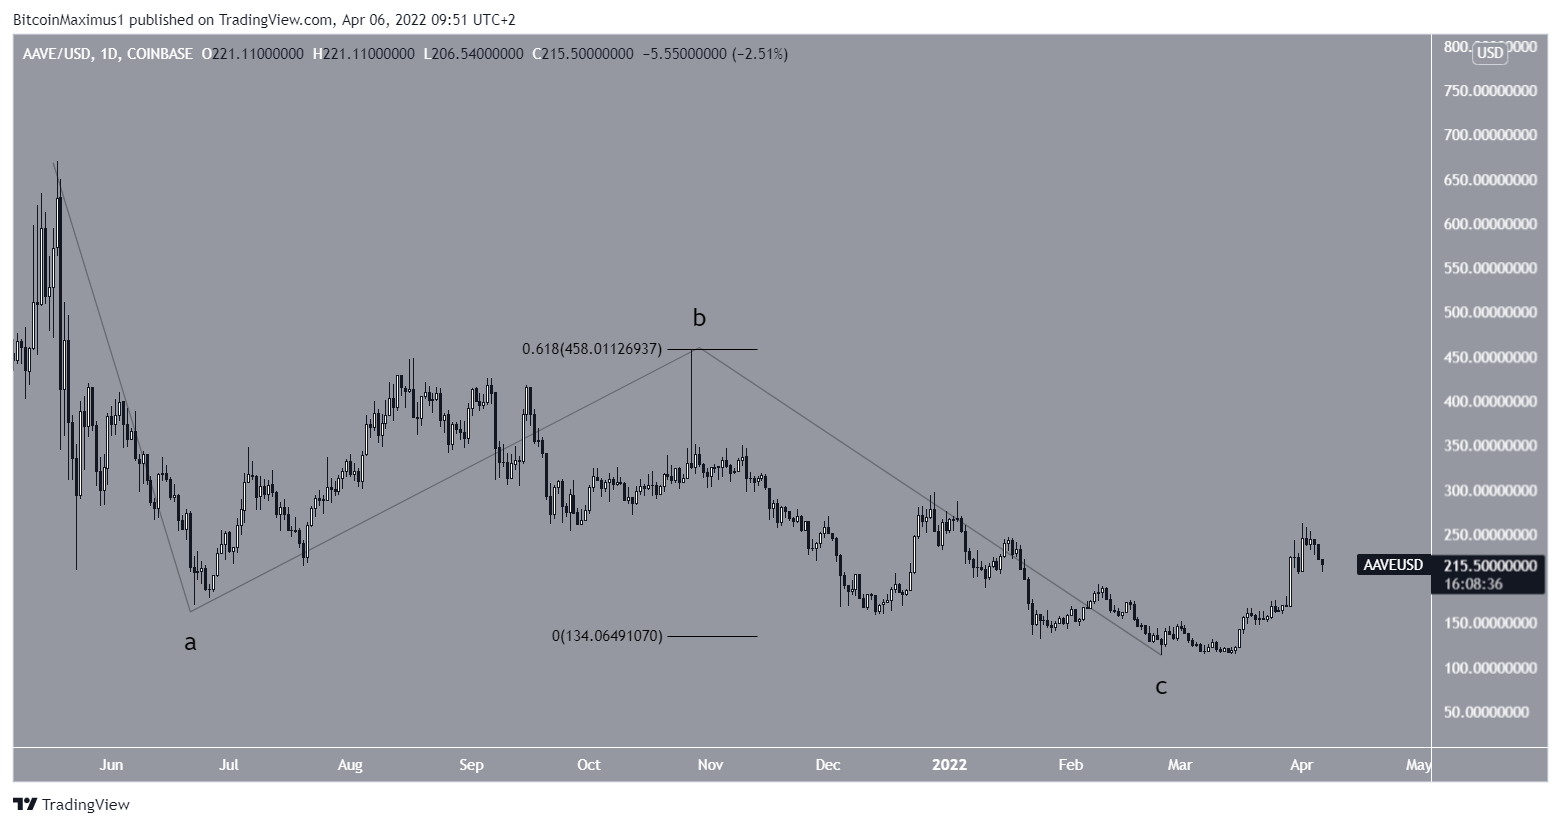
AAVE wave count analysis
The most likely wave count indicates that since the all-time high, AAVE has completed an A-B-C corrective structure (black). In it, waves A:C have had a 1:0.618 ratio, which is common in such structures.
This fits with the bullish divergences and breakout from the long-term descending resistance line.
If correct, a substantial upward movement for AAVE awaits, which would be expected to take it to at least $460.
For Be[in]Crypto’s latest Bitcoin (BTC) analysis, click here
Disclaimer
In line with the Trust Project guidelines, this price analysis article is for informational purposes only and should not be considered financial or investment advice. BeInCrypto is committed to accurate, unbiased reporting, but market conditions are subject to change without notice. Always conduct your own research and consult with a professional before making any financial decisions. Please note that our Terms and Conditions, Privacy Policy, and Disclaimers have been updated.
