
The Bitcoin dominance rate (BTCD) has steadily decreased alongside a descending resistance line from May 14. The price is showing short-term reversal signs, but the trend remains bearish as long as BTCD is below this line.
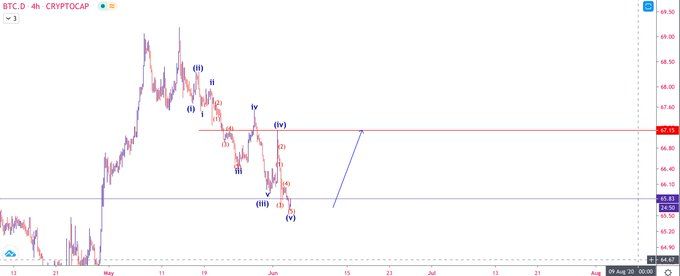
Well-known Elliott Wave trader @TheEWguy explains that he is moving out of altcoins, because the BTC dominance rate looks likely to move upwards, at least in the short-term.
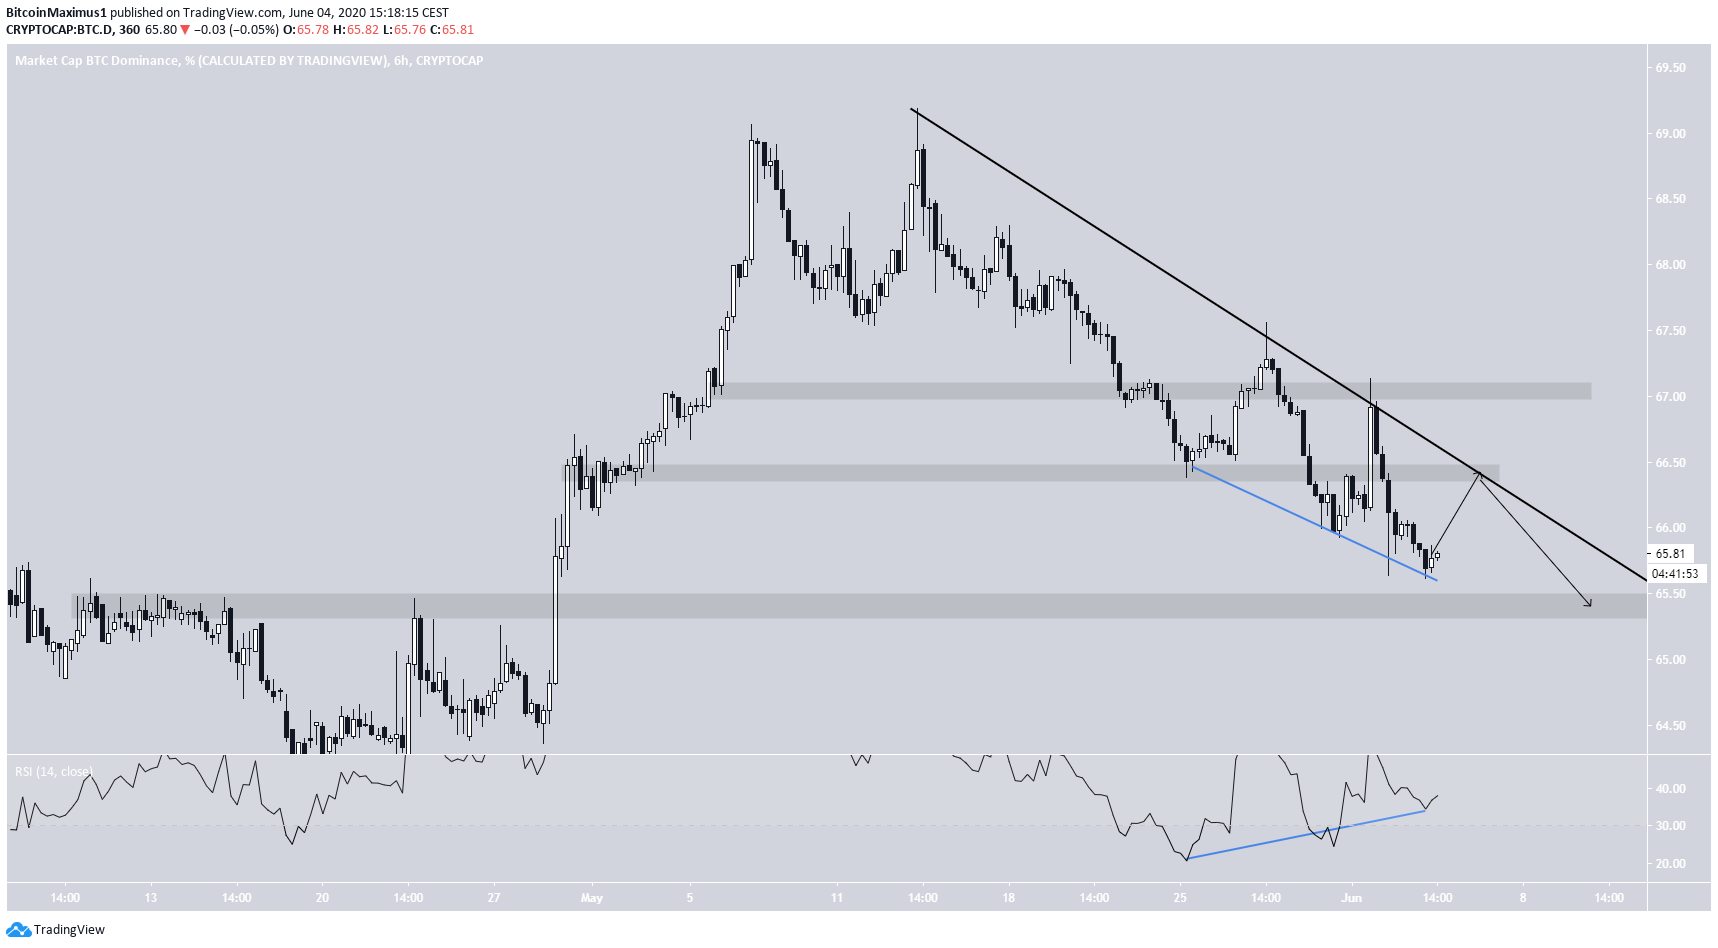
Indeed, the steady decrease since May 14 has actually accelerated since the beginning of June. There are, however, some signs of a reversal. The rate has followed a descending resistance line since May 14.
While the price action has created three lower lows, the RSI has, on the contrary, created higher lows. This is a classic bullish divergence pattern and is likely to cause a rally, which would take the rate to 65.4%. That resistance area coincides with the descending resistance line.
However, for a reversal to take place, it would make more sense for BTCD to fall to the 64.4% major support area before attempting a break-out above the resistance line.
As long as the rate remains below the descending resistance line, price action should not be considered bullish.
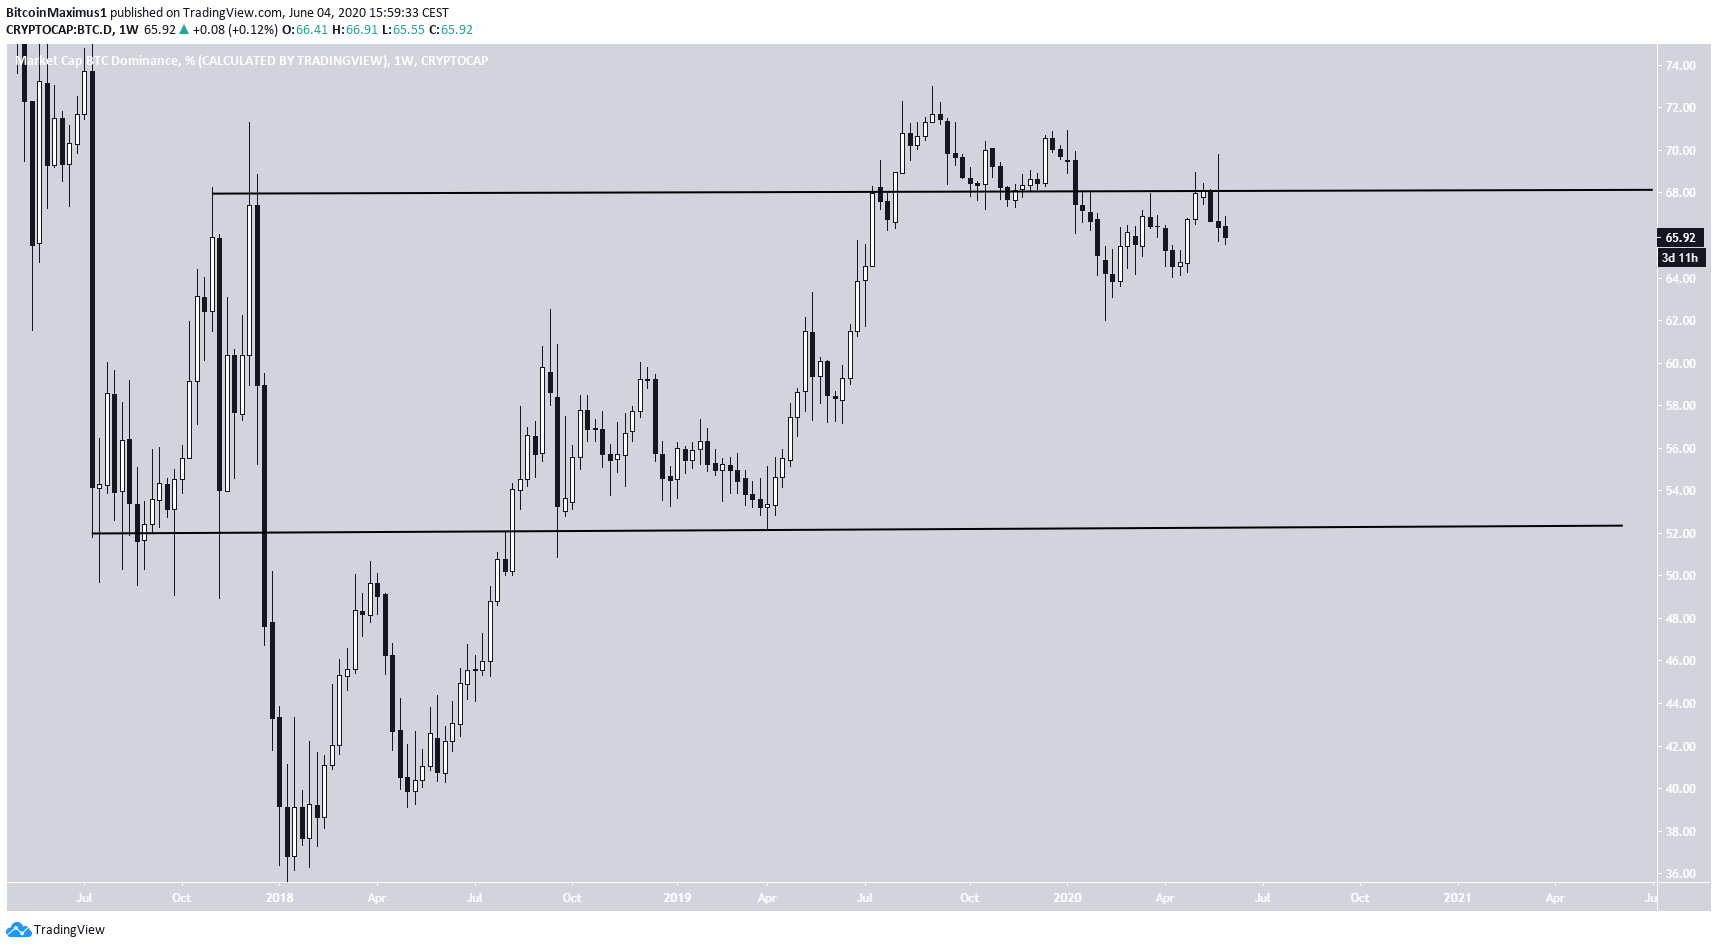
Long-Term Range
Over the long-term, BTCD is trading inside a range between 68.4 and 52.4%. While it initially broke out in July 2019, it has since returned into the range, apparently validating the resistance line.
Unless price reclaims the 68.4% resistance area, this likely means that BTCD is in a downward trend and will gradually decrease towards the 52.4% area.
While a reclaim of the area is not out of the question, it would also need to break out of the descending resistance line and the multiple minor resistance areas outlined in the previous section to do so.
Therefore, while a short-term bounce could occur, BTCD has most likely begun a longer-term downward trend.
In conclusion, while BTCD may soon bounce, the longer-term trend remains bearish until prices move above the 68.4% area.
