

The Serum (SRM) price has broken down from an ascending support line and validated it as resistance afterward.
SRM is in the process of possibly creating a higher low and a bullish structure. Failure to do so would likely send the price back towards a new all-time low and negative price discovery.
While the Mantra DAO (OM) price is following its own ascending support line, the lack of bullish signals suggests a new all-time low is on the horizon.
SRM Breaks Down from Support
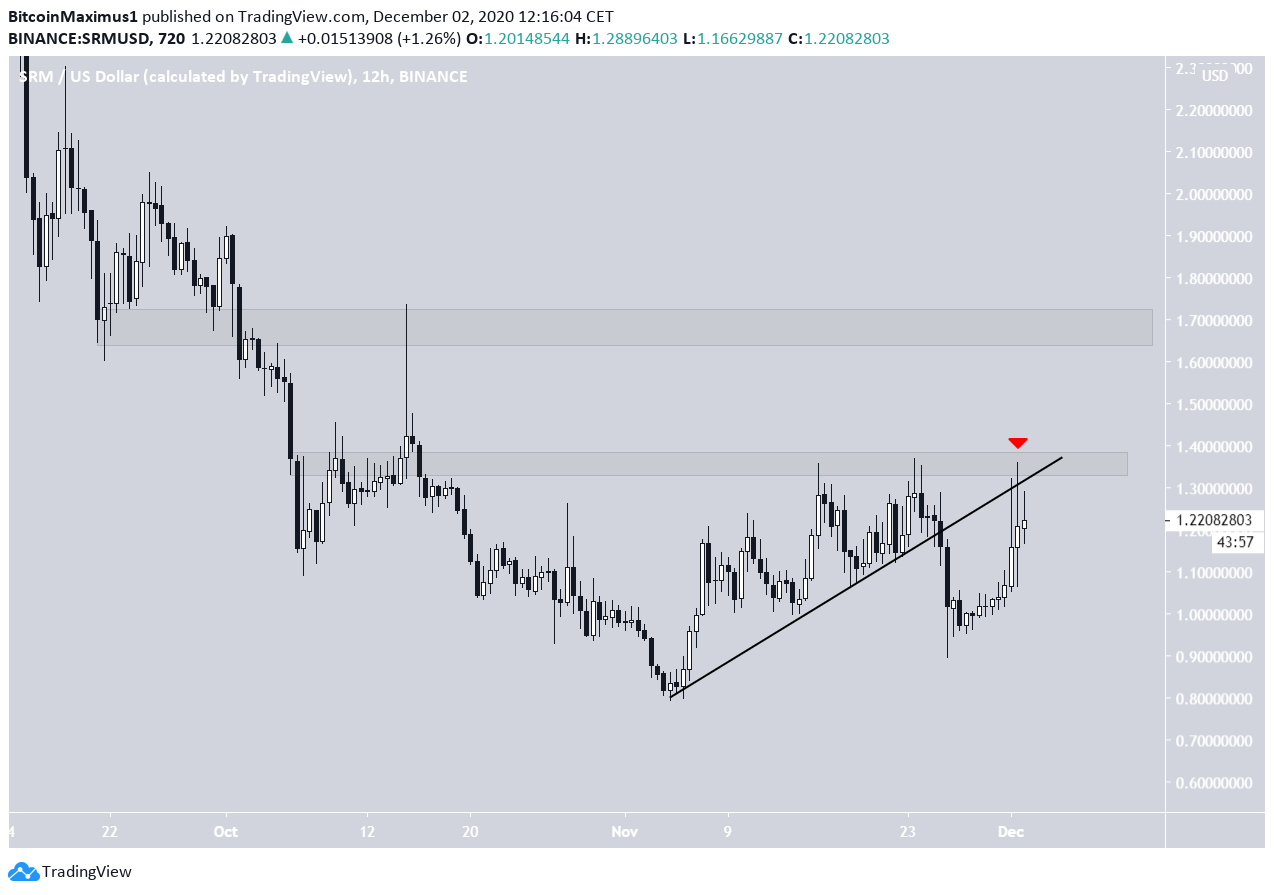
The SRM price had been following an ascending support line after it reached a low of $0.79 on Nov. 4. The price continued to increase alongside this support line and ended up making two attempts at breaking out above the $1.35 area.
However, both attempts were unsuccessful and SRM broke down from the support line shortly afterward.
Yesterday, SRM began yet another upward move which was rejected by both the $1.35 area and the support line, which has now turned to resistance (red arrow).
If the price were to break out above the current resistance area, the next resistance would be found at $1.65.
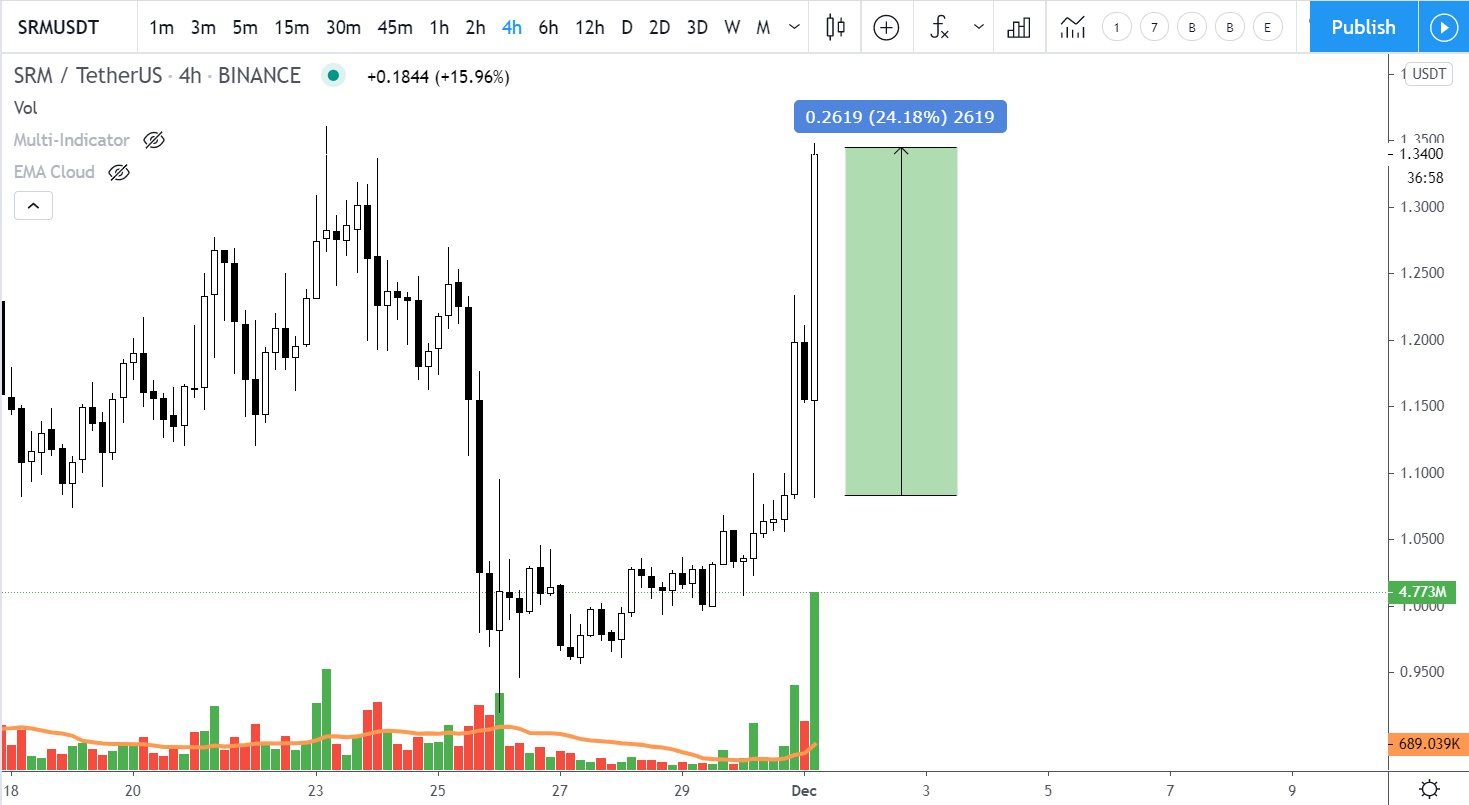
Cryptocurrency trader @Devchart outlined a SRM price chart, noting that the SRM price is pumping significantly despite yesterday’s BTC drop.
However, as we saw in the chart above, the increase only served to validate the ascending support line and the $1.35 area before decreasing once more.
Future Movement
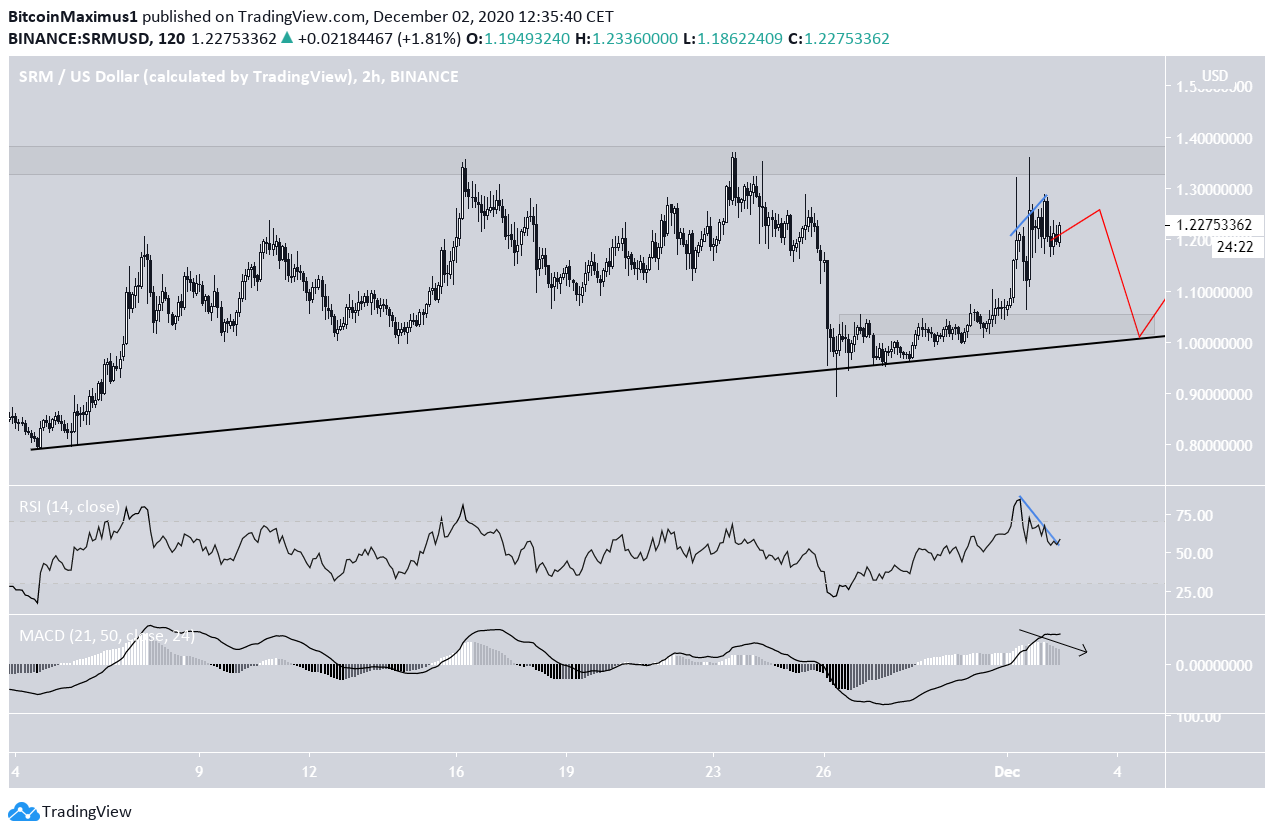
The two-hour chart shows a pronounced bearish divergence in the RSI, which suggests that the price will drop.
However, SRM may also be following another ascending support line, which is more gradual and coincides with the minor $1.05 support area.
Therefore, the most likely movement would be a re-test of this /area before the price potentially moves upwards.
The loss of the ascending support line would likely take SRM back towards a new all-time low.
OM Bounces but Does not Show Strength
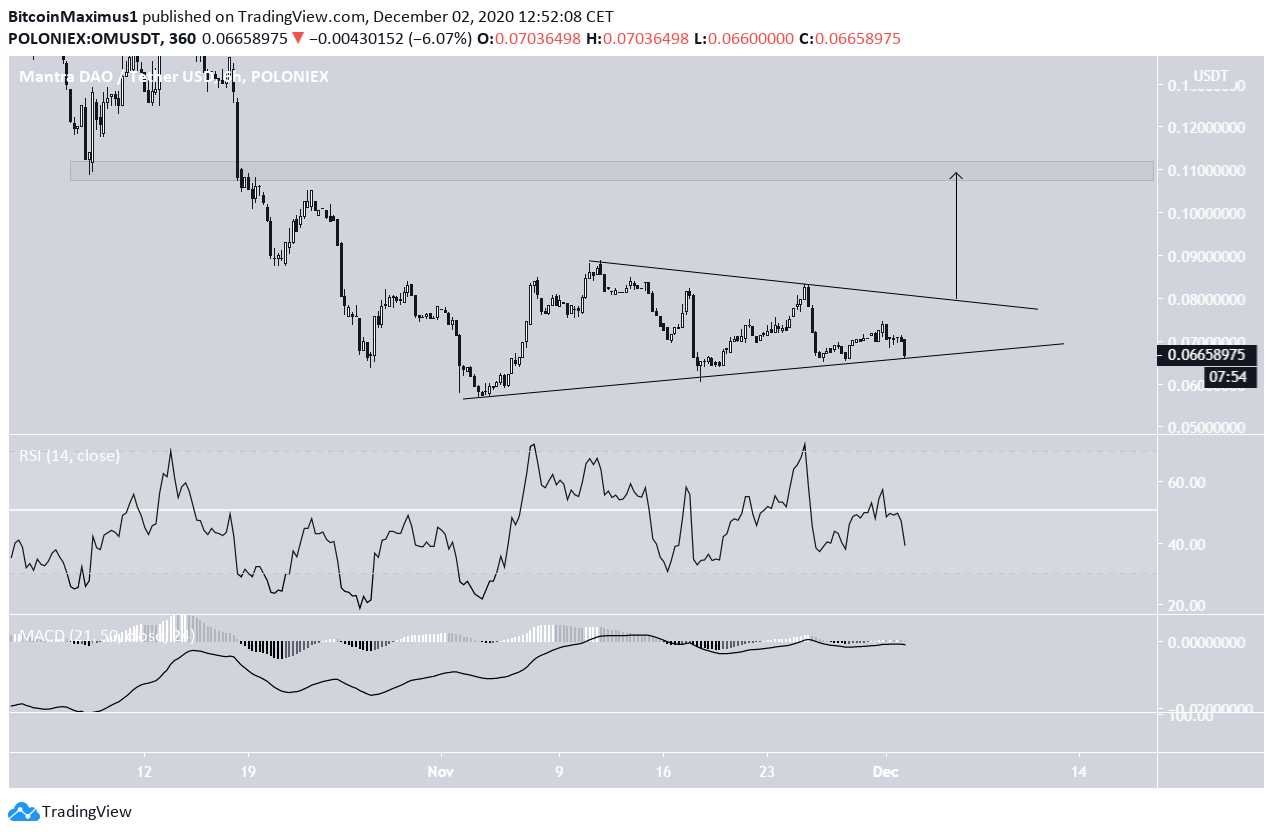
The OM price has been increasing inside a symmetrical triangle since it reached an all-time low price of $0.056 on Nov 3.
At the time of press, OM was trading at the support line of this triangle. A breakout that travels the entire height of the pattern would take the price all the way to $0.11.
However, both the MACD and RSI are bearish, indicating that OM is more likely to decrease instead, and proceed to reach a new all-time low.
For BeInCrypto’s latest Bitcoin analysis, click here!
Disclaimer: Cryptocurrency trading carries a high level of risk and may not be suitable for all investors. The views expressed in this article do not reflect those of BeInCrypto
Disclaimer
In line with the Trust Project guidelines, this price analysis article is for informational purposes only and should not be considered financial or investment advice. BeInCrypto is committed to accurate, unbiased reporting, but market conditions are subject to change without notice. Always conduct your own research and consult with a professional before making any financial decisions. Please note that our Terms and Conditions, Privacy Policy, and Disclaimers have been updated.
