

Bitcoin (BTC) has been trading inside a symmetrical triangle over the past week.
Technical indicators and the longer-term outlook support a breakout from this triangle that would eventually take the price to a new all-time high.
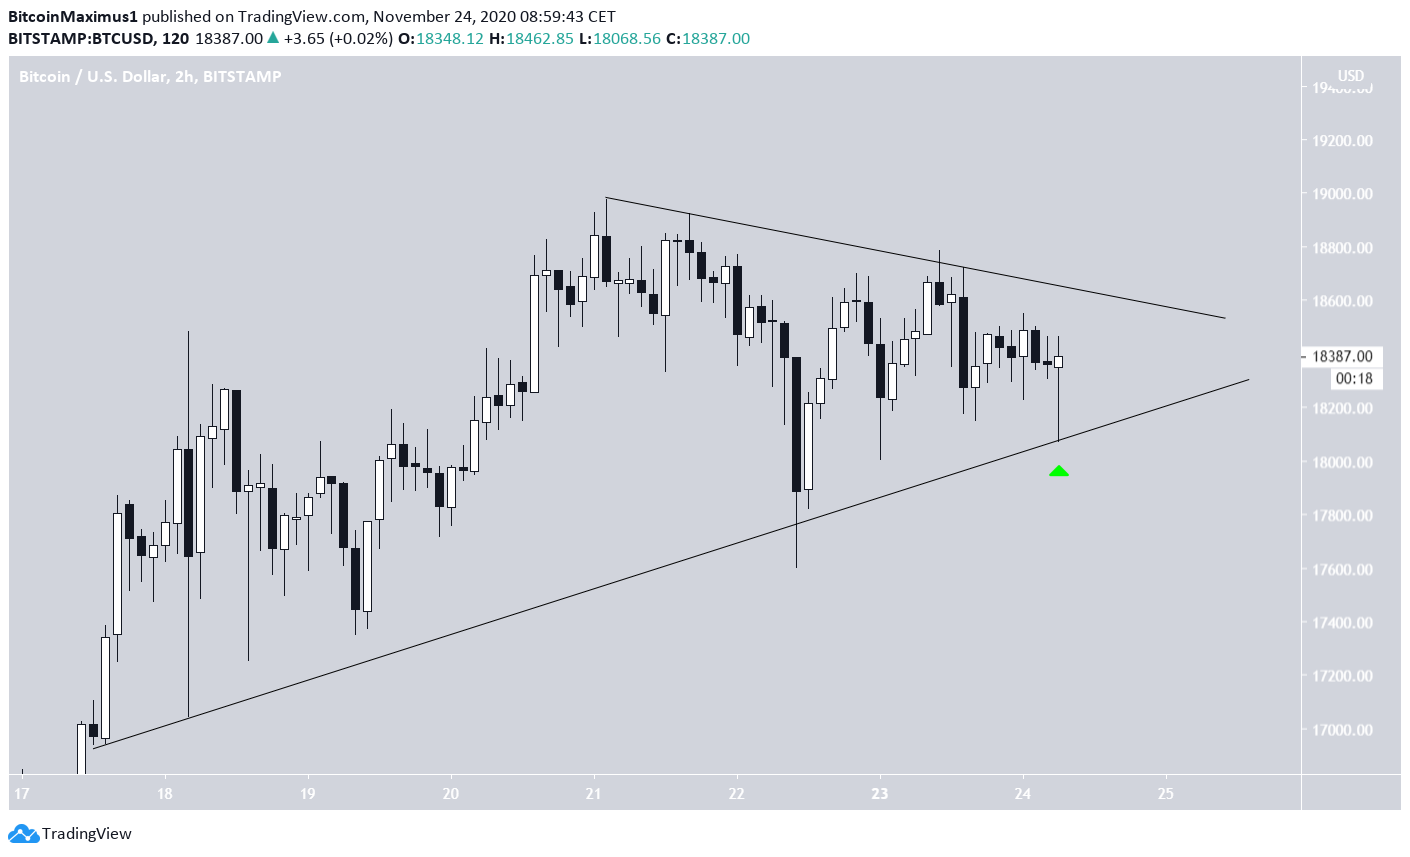
Bitcoin in a Symmetrical Triangle
The BTC price has been trading inside a symmetrical triangle since reaching a high of $18,977 on Nov. 21. Today, the price dropped to the support line of the triangle and created a long lower wick and a hammer candlestick, a sign of buying pressure.
The point of convergence between support and resistance occurs on or near Nov. 27, at which point a decisive move out of the pattern should occur.
The MACD has been gradually increasing over the past two days, supporting the possibility of a breakout from the triangle.
A breakout that travels the entire height of the pattern would take BTC all the way to $19,900.

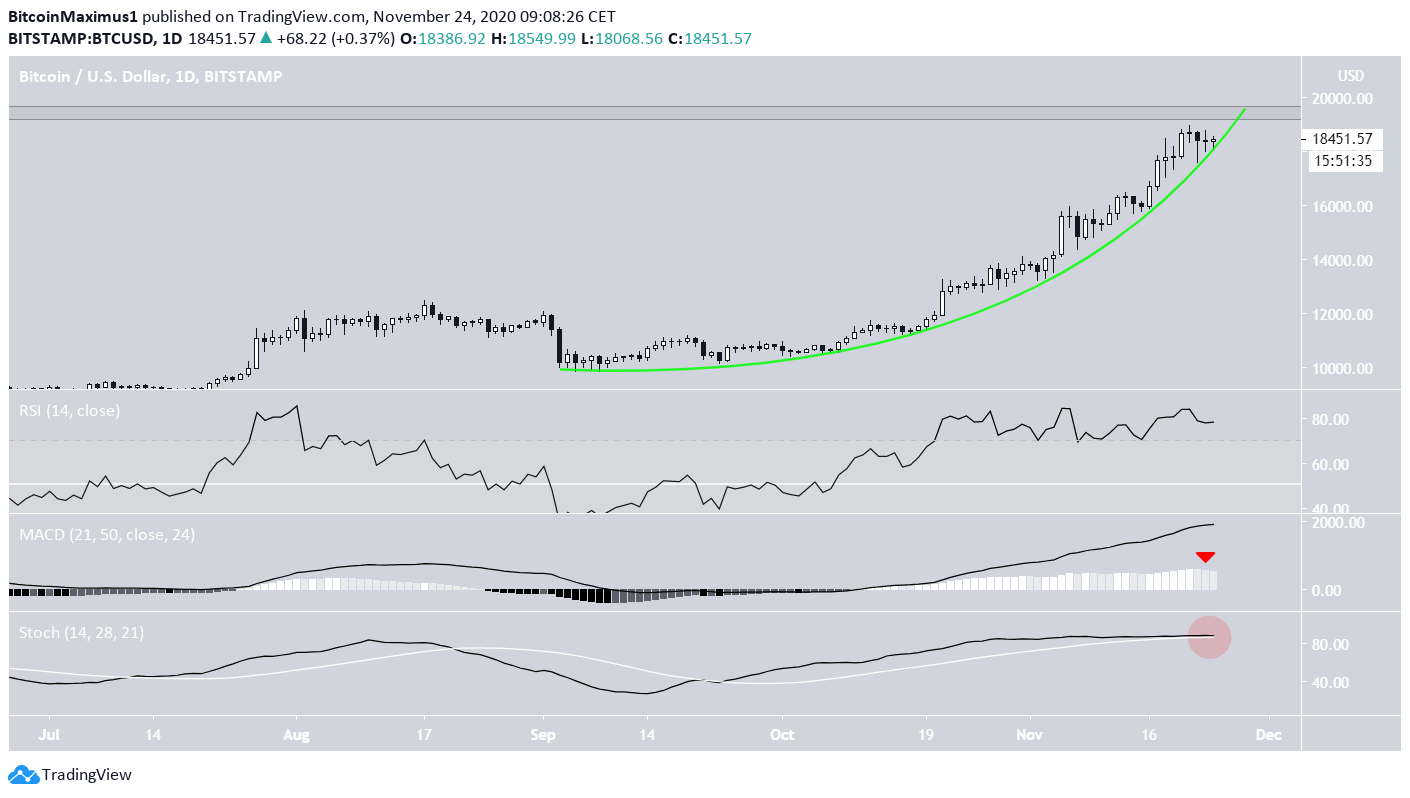
BTC Rally Coming to an End?
The BTC price has been following a parabolic ascending support line since the upward move began in September. The price is still trading above this line, approaching the all-time high resistance near $19,500.
The rally is heavily overbought, with both the RSI and MACD being near their highest ever levels. Furthermore, the Stochastic oscillator is close to making a bearish cross.
So, while another price increase seems likely because of the short-term readings, a retracement is overdue and could occur after the triangle breakout is complete.
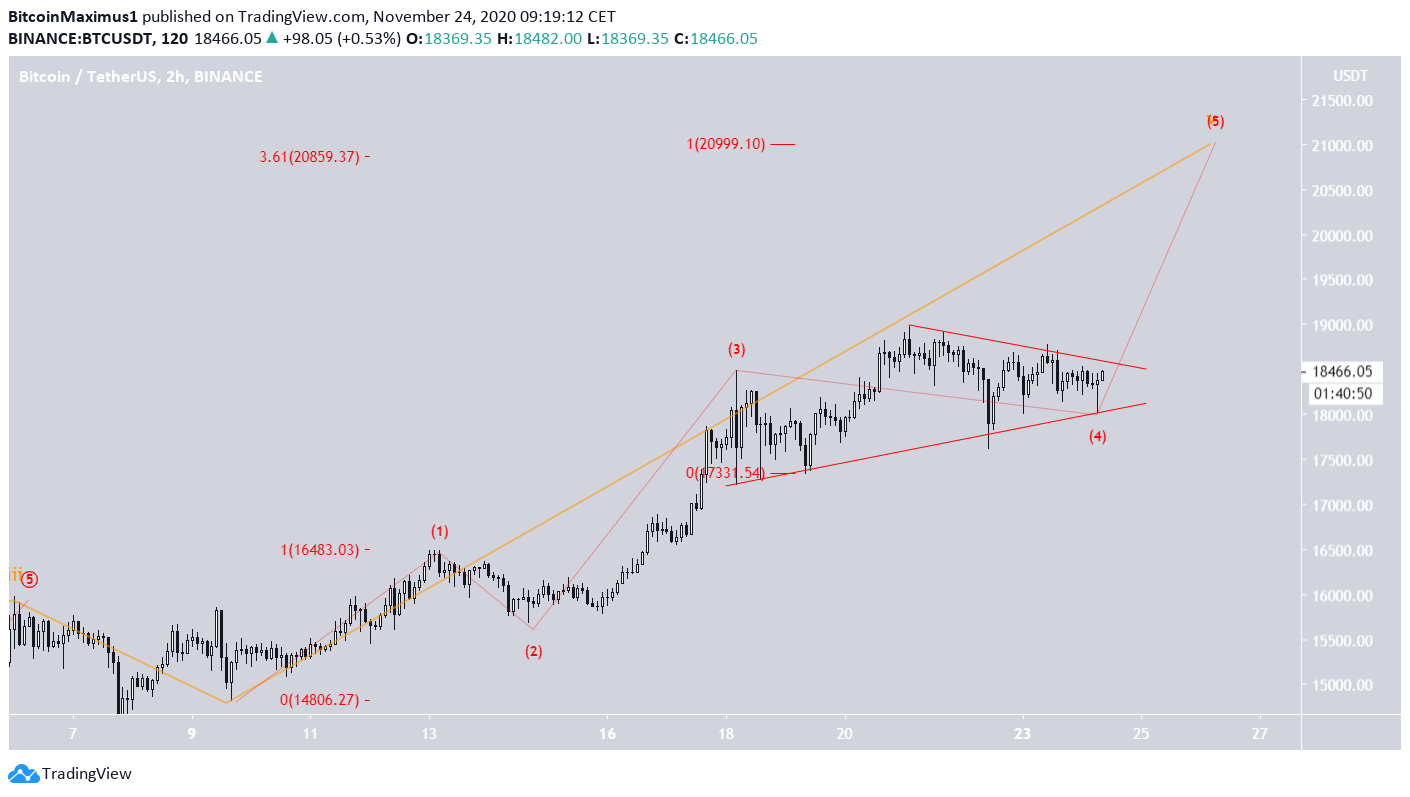
Wave Count
The BTC price is likely in the fifth-and-final wave of a bullish impulse (shown in orange below).
The presence of the triangle suggests that this is sub-wave 4 (red), after which the price should break out.
A likely target for the top of the move would be between $20,855-$21,000, the 3.61 Fib extension of sub-wave 1 and the projection of sub-waves 1-3 to the bottom of subwave 4.
Conclusion
BTC is trading inside a symmetrical triangle, from which a breakout is expected that could take the price to a new all-time high.
For BeInCrypto’s previous Bitcoin analysis, click here!
Disclaimer: Cryptocurrency trading carries a high level of risk and may not be suitable for all investors. The views expressed in this article do not reflect those of BeInCrypto
Disclaimer
In line with the Trust Project guidelines, this price analysis article is for informational purposes only and should not be considered financial or investment advice. BeInCrypto is committed to accurate, unbiased reporting, but market conditions are subject to change without notice. Always conduct your own research and consult with a professional before making any financial decisions. Please note that our Terms and Conditions, Privacy Policy, and Disclaimers have been updated.
