At BeInCrypto, we offer regular price analyses and predictions of the most popular and relevant cryptoassets. In our Mar 26 analysis of DASH (DASH), we predicted slight decreases within the channel defined below. However, our prediction was invalidated on Mar 27, when the price initiated a rapid upward movement. Keep reading below for our most recent price predictions for DASH!
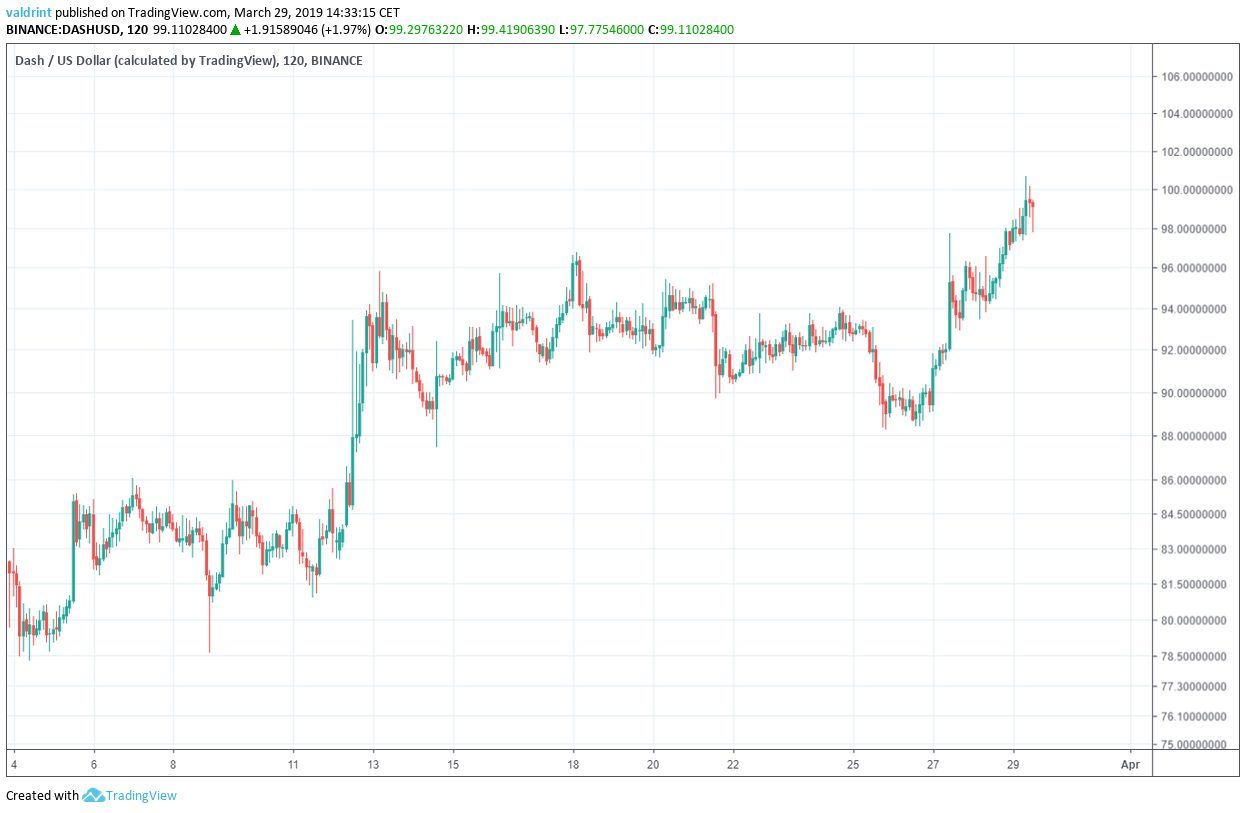
On Mar 4, the price made a low of $78.20. It has been gradually increasing throughout March. Currently, DASH is currently trading near $100—its highest value since Dec 2018.

DASH (DASH): Trends And Highlights For March 29, 2018
- DASH has been on an uptrend since Mar 4.
- It is trading inside an ascending channel.
- There is bearish divergence developing in the RSI and the MACD.
- There is resistance near $102.
- There is support near $78.
Ascending Channel
The price reached a low of $78.20 on Mar 4. An upward move followed. Several market cycles have been completed since, with each low being higher than the previous one. Tracing the closing prices corresponding to these lows gives us an ascending support line.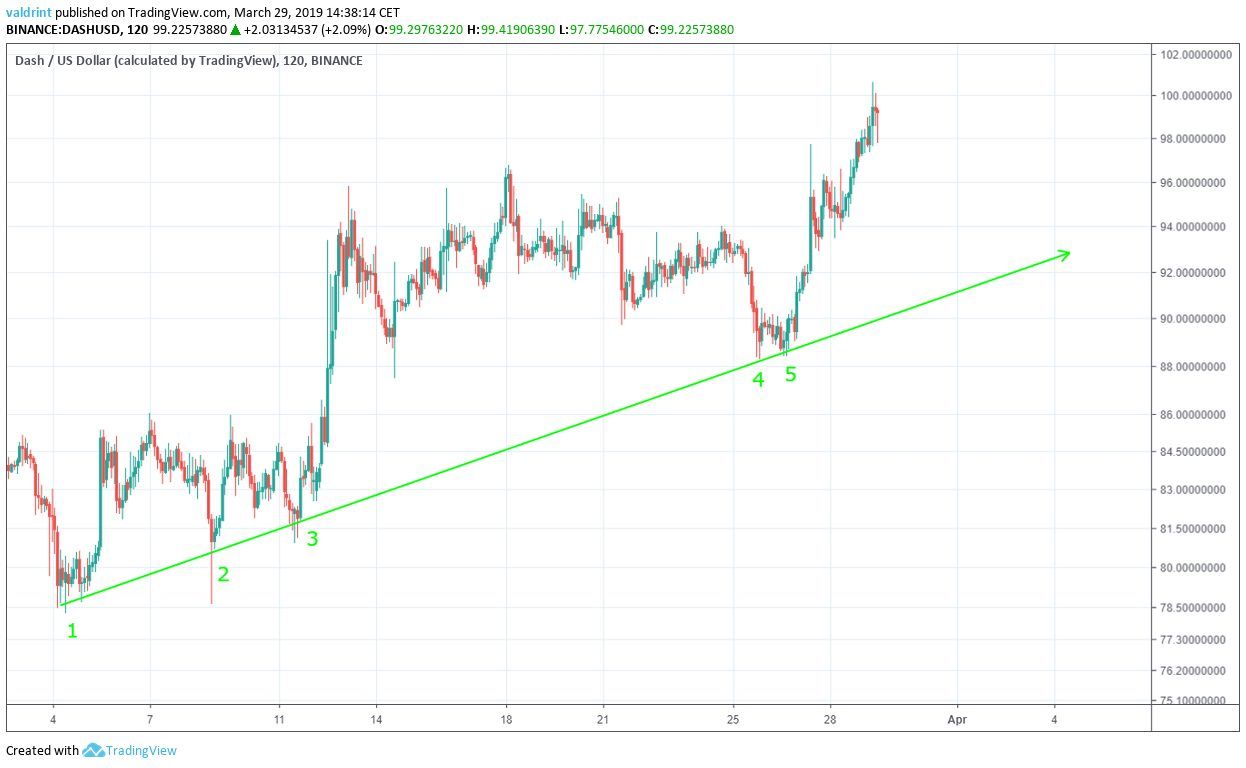 Furthermore, the price reached a high of $95.79 on Mar 13. It proceeded to make higher highs on Mar 16 and Mar 18. Tracing these highs gives us an ascending resistance line.
The resistance and support lines combine to create an ascending parallel channel:
Furthermore, the price reached a high of $95.79 on Mar 13. It proceeded to make higher highs on Mar 16 and Mar 18. Tracing these highs gives us an ascending resistance line.
The resistance and support lines combine to create an ascending parallel channel:
 Parallel channels are typically neutral patterns with prices gains and losses expected within the confines of the channel. While this remains the case with DASH, the upward direction of the channel suggest long-term growth.
Based on this channel, highs and lows should continue to grow successively larger over the long-term despite possible short-term losses.
Parallel channels are typically neutral patterns with prices gains and losses expected within the confines of the channel. While this remains the case with DASH, the upward direction of the channel suggest long-term growth.
Based on this channel, highs and lows should continue to grow successively larger over the long-term despite possible short-term losses.
Reversal Areas
In order to predict possible future price levels, the price of DASH on Binance was analyzed at one-day intervals from Dec 1, 2018 to Mar 29, 2019 alongside resistance and support areas.Resistance and support areas are formed when the price revisits the same level several times. They indicate possible future prices based on past patterns.
The first resistance area is found between approximately $98 and $102. Price reached this resistance area on Mar 29 when highs exceeded $100. If prices continue rising, DASH might break out of the current channel traced above.
In such a case, price increases might accelerate.
 DASH might also drop toward the support area found near $78. However, this may be unlikely because this support area is now well below the support line of the current trading pattern.
This means that the levels could only be reached if DASH brokedown from the current channel. Based on this information alone, however, we cannot accurately predict whether or not a breakdown or breakout is likely
DASH might also drop toward the support area found near $78. However, this may be unlikely because this support area is now well below the support line of the current trading pattern.
This means that the levels could only be reached if DASH brokedown from the current channel. Based on this information alone, however, we cannot accurately predict whether or not a breakdown or breakout is likely
Looking Out For a Reversal
To better predict possible future price fluctuations, we must incorporate technical indicators into our analysis.About the indicators: The moving average convergence divergence (MACD) is a trend indicator that shows the relationship between two moving averages (long and short-term) and the price. It is used to measure the strength of a move. The relative strength index (RSI) is an indicator which calculates the size of the changes in price in order to determine oversold or overbought conditions in the market.
Combining MACD and RSI bullish/bearish divergence with support/resistance essentially predicts price fluctuations.
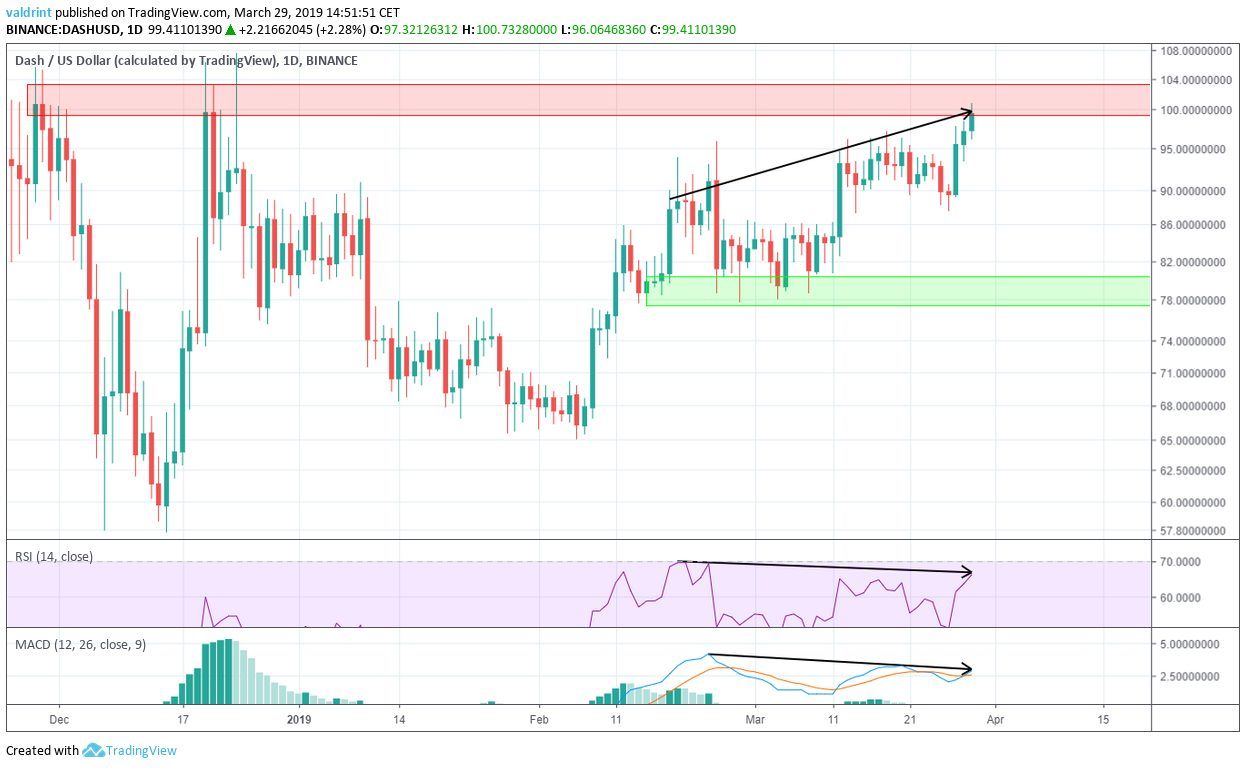 On Feb 19, the price made a high of $93.9. Since then, it has made several higher highs, culminating with the $100.2 high on Mar 29.
Similarly, the RSI and the MACD reached a high on Feb 19. However, they have proceeded to generate lower values.
This is known as bearish divergence and often precedes price decreases. The level of divergence is significant and is occurring inside a major resistance area. This further validates the possibility of price decreases.
Price may soon drop toward the support line of the channel. It is possible—albeit less likely—that price will breakdown below support and reach the support area around $78.
However, such lows may be reached in the months to come if a corrective period follows the gains seen since Feb.
On Feb 19, the price made a high of $93.9. Since then, it has made several higher highs, culminating with the $100.2 high on Mar 29.
Similarly, the RSI and the MACD reached a high on Feb 19. However, they have proceeded to generate lower values.
This is known as bearish divergence and often precedes price decreases. The level of divergence is significant and is occurring inside a major resistance area. This further validates the possibility of price decreases.
Price may soon drop toward the support line of the channel. It is possible—albeit less likely—that price will breakdown below support and reach the support area around $78.
However, such lows may be reached in the months to come if a corrective period follows the gains seen since Feb.
Summary of Analysis
Based on this analysis, it is likely that the price will keep trading inside the confines of the ascending channel. Price is expected to drop to the support line. It is unlikely that we will see a breakdown below support in the immediate future. However, such a breakdown may occur in the longer-term to correct for DASH’s recent highs. Do you think the price of DASH will keep increasing? Let us know in the comments below. Disclaimer: This article is not trading advice and should not be construed as such. Always consult a trained financial professional before investing in cryptocurrencies, as the market is particularly volatile.
Top crypto platforms in the US
 eToro
Explore
Explore
Explore
Explore
eToro
Explore
Explore
Explore
Explore
Don’t invest unless you’re prepared to lose all
the money you invest.
This is a high-risk investment and you should not expect to be protected if something goes wrong.
Take 2 mins to learn more
Don’t invest unless you’re prepared to lose all
the money you invest.
This is a high-risk investment and you should not expect to be protected if something goes wrong.
Take 2 mins to learn more
Don’t invest unless you’re prepared to lose all
the money you invest.
This is a high-risk investment and you should not expect to be protected if something goes wrong.
Take 2 mins to learn more
Don’t invest unless you’re prepared to lose all
the money you invest.
This is a high-risk investment and you should not expect to be protected if something goes wrong.
Take 2 mins to learn more
Don’t invest unless you’re prepared to lose all
the money you invest.
This is a high-risk investment and you should not expect to be protected if something goes wrong.
Take 2 mins to learn more
Don’t invest unless you’re prepared to lose all
the money you invest.
This is a high-risk investment and you should not expect to be protected if something goes wrong.
Take 2 mins to learn more
Top crypto platforms in the US
Uphold
eToro
eToro
eToro
eToro
Plus500
Coinbase
Moonacy
Don’t invest unless you’re prepared to lose all
the money you invest.
This is a high-risk investment and you should not expect to be protected if something goes wrong.
Take 2 mins to learn more
Don’t invest unless you’re prepared to lose all
the money you invest.
This is a high-risk investment and you should not expect to be protected if something goes wrong.
Take 2 mins to learn more
Don’t invest unless you’re prepared to lose all
the money you invest.
This is a high-risk investment and you should not expect to be protected if something goes wrong.
Take 2 mins to learn more
Disclaimer
In line with the Trust Project guidelines, this price analysis article is for informational purposes only and should not be considered financial or investment advice. BeInCrypto is committed to accurate, unbiased reporting, but market conditions are subject to change without notice. Always conduct your own research and consult with a professional before making any financial decisions. Please note that our Terms and Conditions, Privacy Policy, and Disclaimers have been updated.

Valdrin Tahiri
Valdrin discovered cryptocurrencies while he was getting his MSc in Financial Markets from the Barcelona School of Economics. Shortly after graduating, he began writing for several different cryptocurrency related websites as a freelancer before eventually taking on the role of BeInCrypto's Senior Analyst.
(I do not have a discord and will not contact you first there. Beware of scammers)
READ FULL BIO
Sponsored
Sponsored