Trusted

The Decreasing Bitcoin Dominance Rate Creates ‘Alt Season’ Possibilities

2 mins
Updated by Gerelyn Terzo
Join our Trading Community on Telegram

In Brief

  • The Bitcoin dominance rate has been decreasing for 229 days.
  • If it decreases below 62.5%, it could trigger a rapid downward move.
  • The Litecoin price is trading near an all-time low.
  • promo

The Bitcoin dominance rate has been decreasing for the past 229 days. Initially, this caused many altcoins to surge, leading several speculators to call for the beginning of alt season. However, the altcoin increases have ceased since February and never really reached the heights of the alt season in 2017.
However, recent movements have put the alt season theory back into play. Well-known trader @Damskotrades tweeted three charts, showing the Bitcoin dominance rate, altcoin dominance rate and the price of Litecoin. He suggested that due to a confluence of factors from these charts, he believes altcoins will begin to increase, beginning yet another “alt season.” Below, we will analyze each chart closely and determine the veracity of the alt season claim.

Bitcoin Dominance Rate

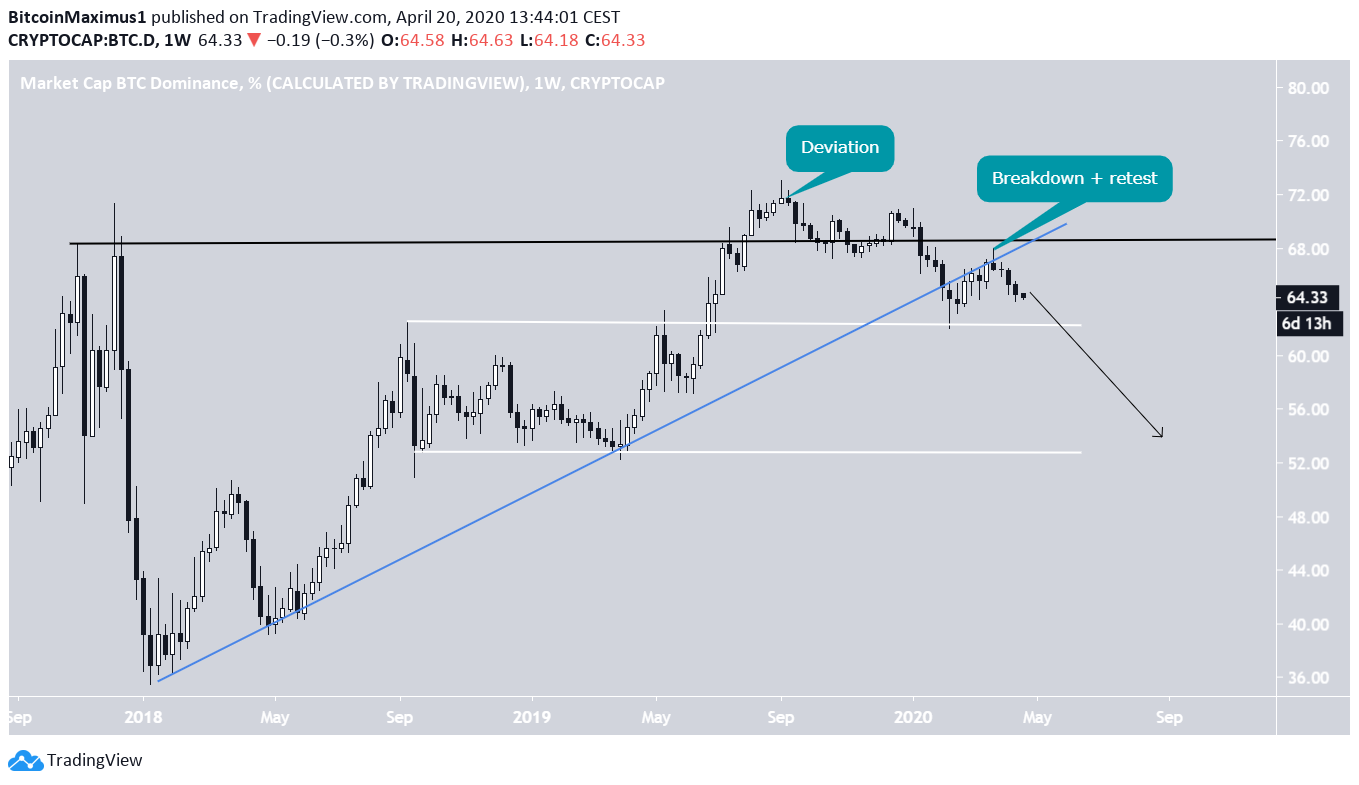
The Bitcoin dominance rate has been on a downward trend for the past 229 days, more specifically since Sept. 5, 2019, when it reached a high of 73.9%. There is a very important trading range found between 62.5% and 52.5%. The price was trading inside this range from September 2018 to July 2019, a period in which altcoins increased considerably. The price reached the resistance level of this range on Feb. 24 and began an upward move, which ended once the price touched the 200-day moving average (MA) (blue arrow). The price has been decreasing ever since. If the price falls back within the range, it is very possible that alt season would begin.
BTC dominance Downtrend
BTC Dominance Chart By Trading View
The long-term chart suggests that the price will eventually decrease below this range. There are two main reasons for this. First, there is the deviation above the resistance at 69%. Since the price has fallen back below the resistance, the failed breakdown often means that the price will decrease. In addition, the dominance rate has broken down below a long-term ascending support line and validated it as resistance afterwards. This is a customary bearish sign that suggests the price will go lower.
BTC Dominance Range
BTC Dominance Chart By Trading View

Litecoin

The Litecoin chart shows that the price is trading at ₿0.0059, at the monthly range lows and very near an all-time low. The previous times in which the price has reached this level, it has initiated upward moves with magnitudes of 470%, 290% and 346%, respectively. The monthly range high is at ₿0.016, so if an upward move were to begin, the price is expected to at least reach this value. In the beginning of 2017, the price briefly decreased below the monthly range low, only to reclaim it shortly afterwards and begin another upward movement. It is possible that the same will occur this time around.
Litecoin Movement
Litecoin Chart By Trading View
To conclude, the Bitcoin dominance rate has been consistently decreasing since September 2019. If it drops below 62.5%, it could trigger a rapid downward move, one that causes altcoins to surge. One such coin is Litecoin, which has almost reached an all-time low, a level that is likely to reverse the current bearish trend.
Top crypto projects in the US | November 2024
Coinrule Coinrule Explore
Coinbase Coinbase Explore
Uphold Uphold Explore
3Commas 3Commas Explore
Chain GPT Chain GPT Explore
Top crypto projects in the US | November 2024
Coinrule Coinrule Explore
Coinbase Coinbase Explore
Uphold Uphold Explore
3Commas 3Commas Explore
Chain GPT Chain GPT Explore
Top crypto projects in the US | November 2024

Disclaimer

In line with the Trust Project guidelines, this price analysis article is for informational purposes only and should not be considered financial or investment advice. BeInCrypto is committed to accurate, unbiased reporting, but market conditions are subject to change without notice. Always conduct your own research and consult with a professional before making any financial decisions. Please note that our Terms and ConditionsPrivacy Policy, and Disclaimers have been updated.

Valdrin-Tahiri.jpg
Valdrin Tahiri
Valdrin discovered cryptocurrencies while he was getting his MSc in Financial Markets from the Barcelona School of Economics. Shortly after graduating, he began writing for several different cryptocurrency related websites as a freelancer before eventually taking on the role of BeInCrypto's Senior Analyst. (I do not have a discord and will not contact you first there. Beware of scammers)
READ FULL BIO
Sponsored
Sponsored