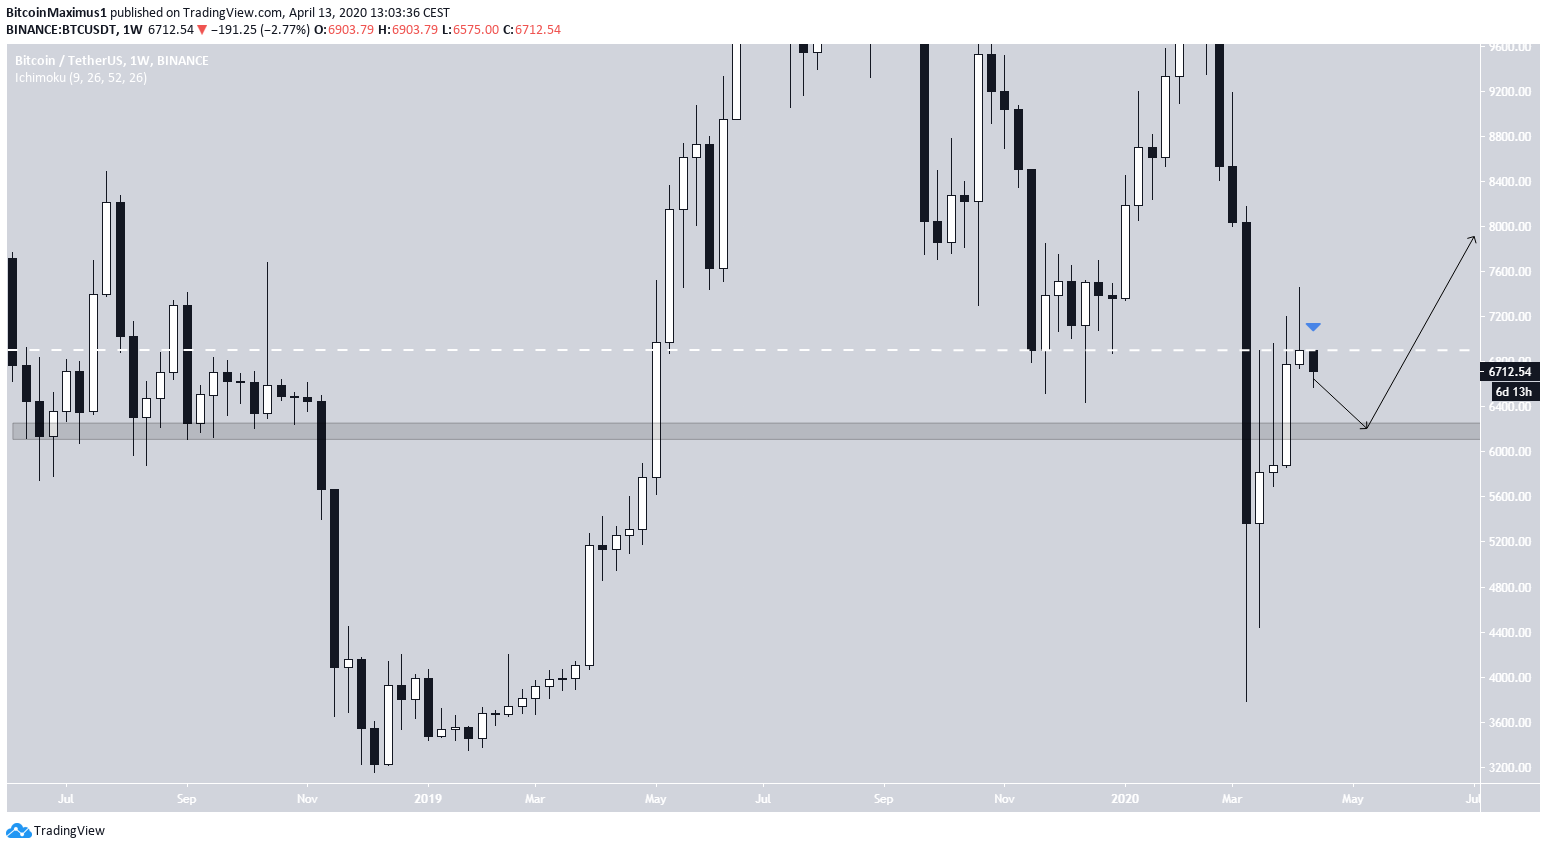
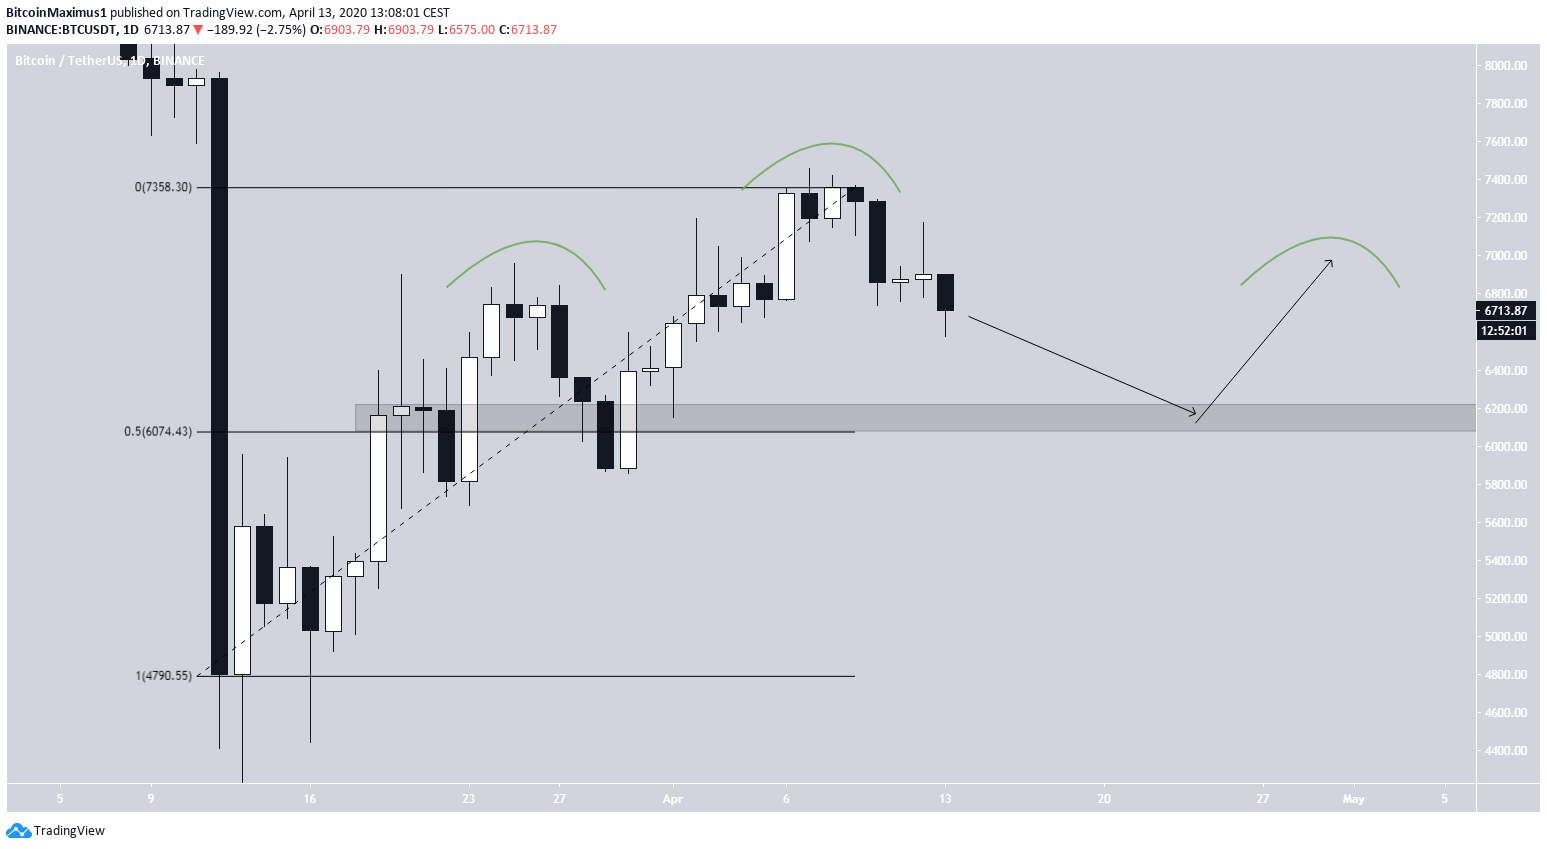
- Support for bulls: $6,250
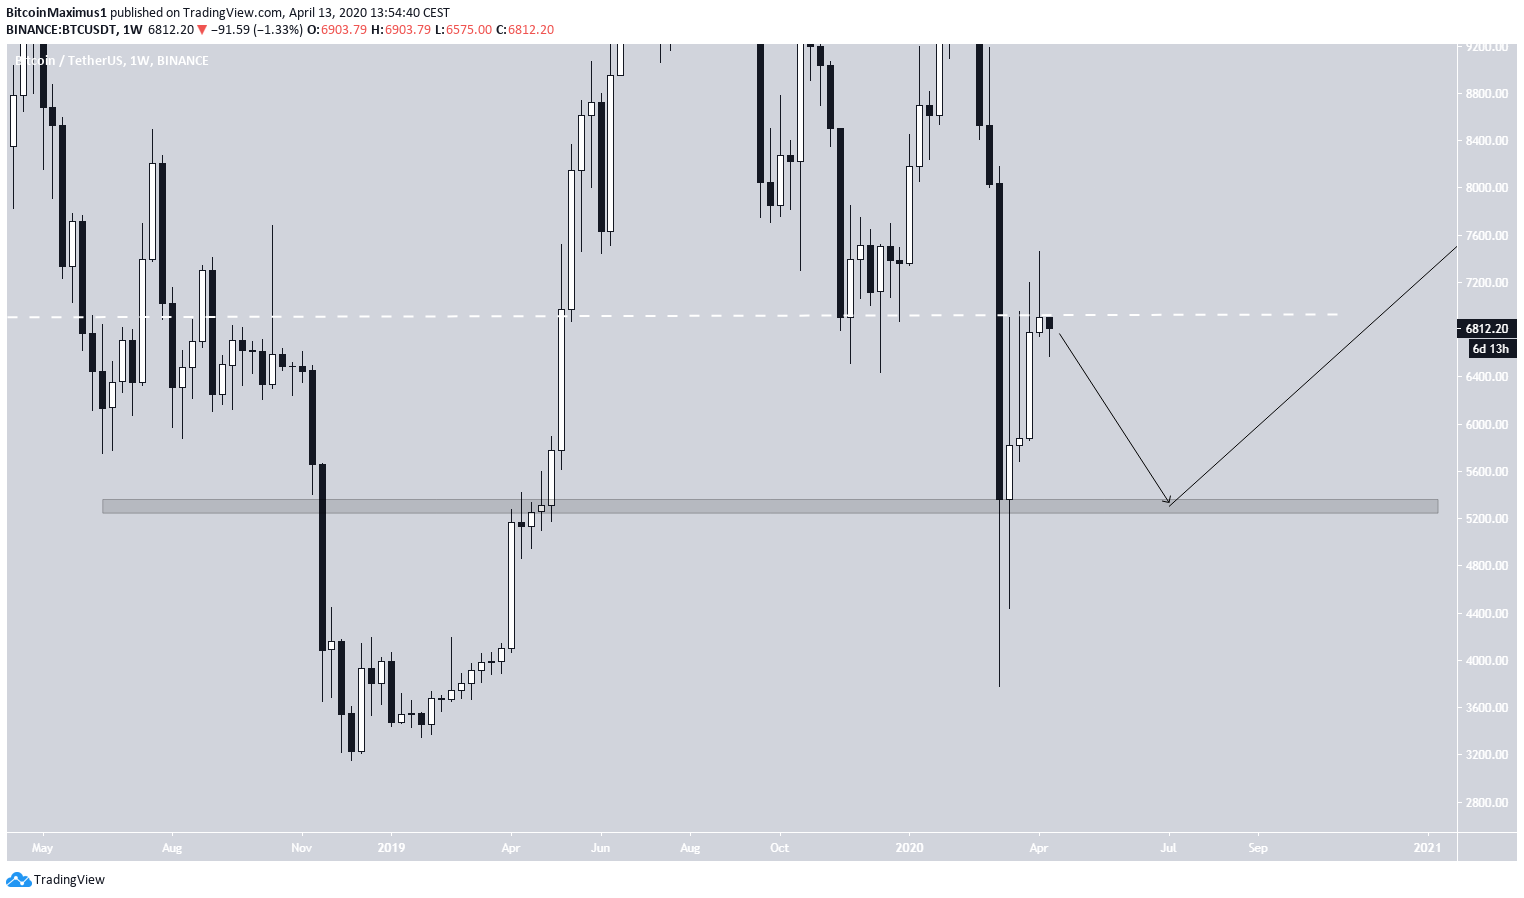
- Support for range nerds: $5,200
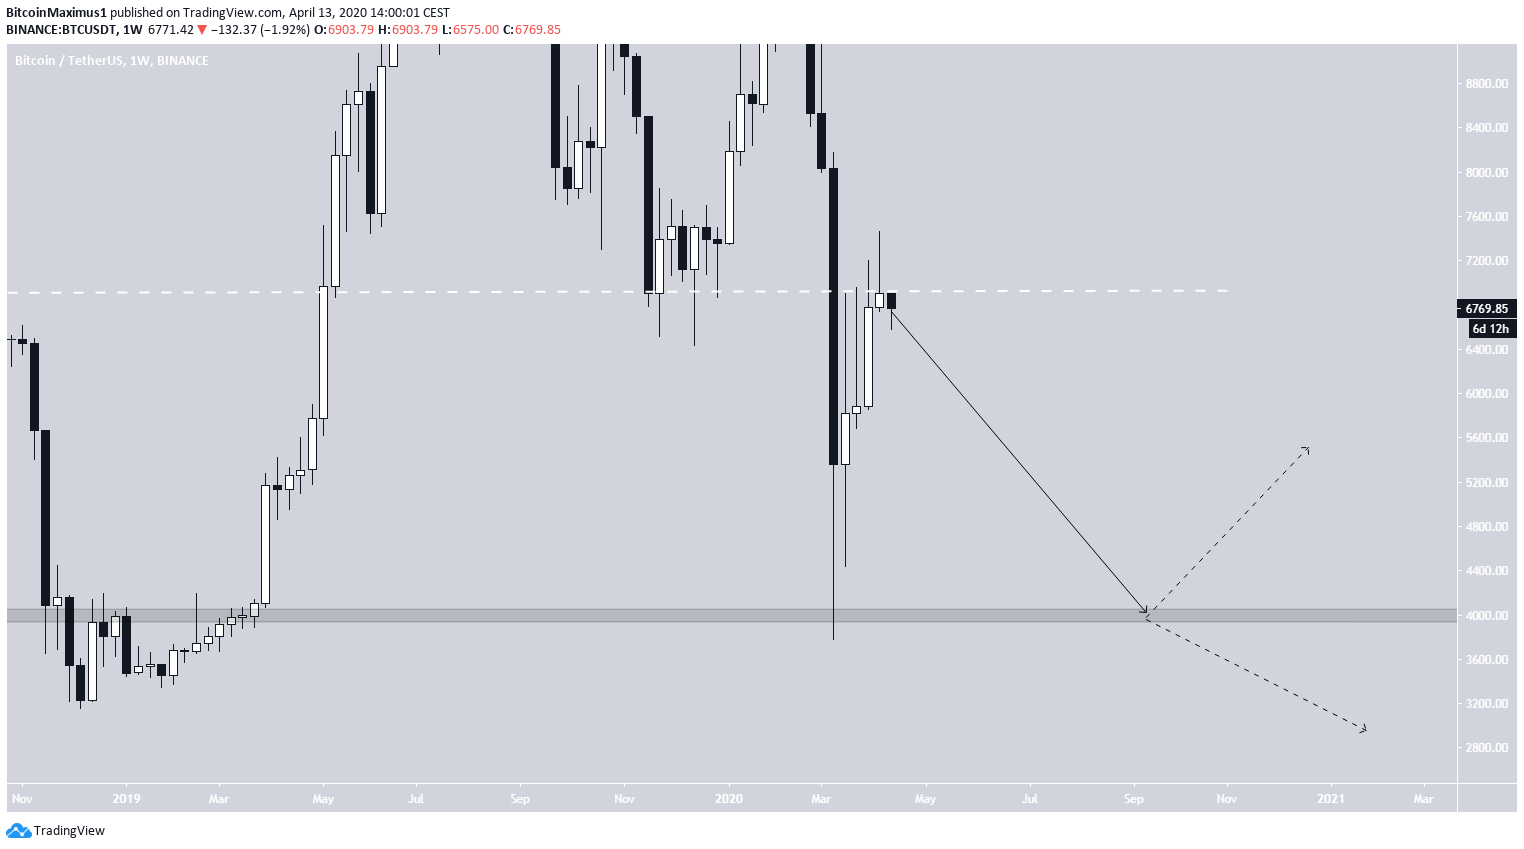
- Support for “bear tards”: $4,100
In the analysis, we will refer to them as the bullish, neutral and bearish close. Let’s take a closer look at the price movement and see where this is going.$BTC update:
— DonAlt (@CryptoDonAlt) April 13, 2020
This is the most bearish close we've had in this entire rally.
If there was ever a signal for bears to come out again, this is as good as it gets, so it would make sense for things to calm down and pull back from here.
Supports outlined, let's see where it goes. pic.twitter.com/aIOie3P7e2
Bullish Support
It is clearly visible that last week the price was rejected by the $6,800 level, which is crucial for the bulls to reclaim in order to keep the hopes of a continued upward move alive. The first support area is found at $6,250. It is created by the long-term movement throughout June-November 2018. Furthermore, once the price began an upward move in March 2019, it did not retest this area as resistance. In addition, during the March 20 drop, this area did not act as support. This reduces its importance, since the price has twice moved above/below it without validating it. However, due to its close proximity, a bounce at this support level would likely serve as a higher low that causes the price to move higher.

Neutral Support
The second possibility is that the price finds support at $5,400. This could be known as the double-bottom scenario, since a decrease to that level would entail a double bottom when looking at the weekly closing prices. We have outlined this possibility using a trading range in yesterday’s article. This support area is more minor when compared to the first one since it was created later, during the upward move that began in March 2019. However, the price reacted to it during the way down in March 2020. Therefore, it is entirely possible that the price makes a double/triple bottom at this level before beginning an upward move. If the price were to bounce at this level, that would more likely be the beginning of a new upward move than a short-term upward move as was the case in the previous example.
Bearish Support
In the bearish possibility, the price would decrease all the way to $4,100, right at the resistance area of the price movement from January-March 2019. This is the most bearish possibility, both since it represents the lowest low and the implications for the future movement. If BTC were to decrease all the way to this support area, it would be possible that it decreases further and creates a lower low. Even if it were to bounce, it would likely initiate a very long period of accumulation. Therefore, if the price were to decrease all the way to $4,000, it could mean that the bottom is not yet in.
Disclaimer
In line with the Trust Project guidelines, this price analysis article is for informational purposes only and should not be considered financial or investment advice. BeInCrypto is committed to accurate, unbiased reporting, but market conditions are subject to change without notice. Always conduct your own research and consult with a professional before making any financial decisions. Please note that our Terms and Conditions, Privacy Policy, and Disclaimers have been updated.


