Bitcoin (BTC) Price Highlights
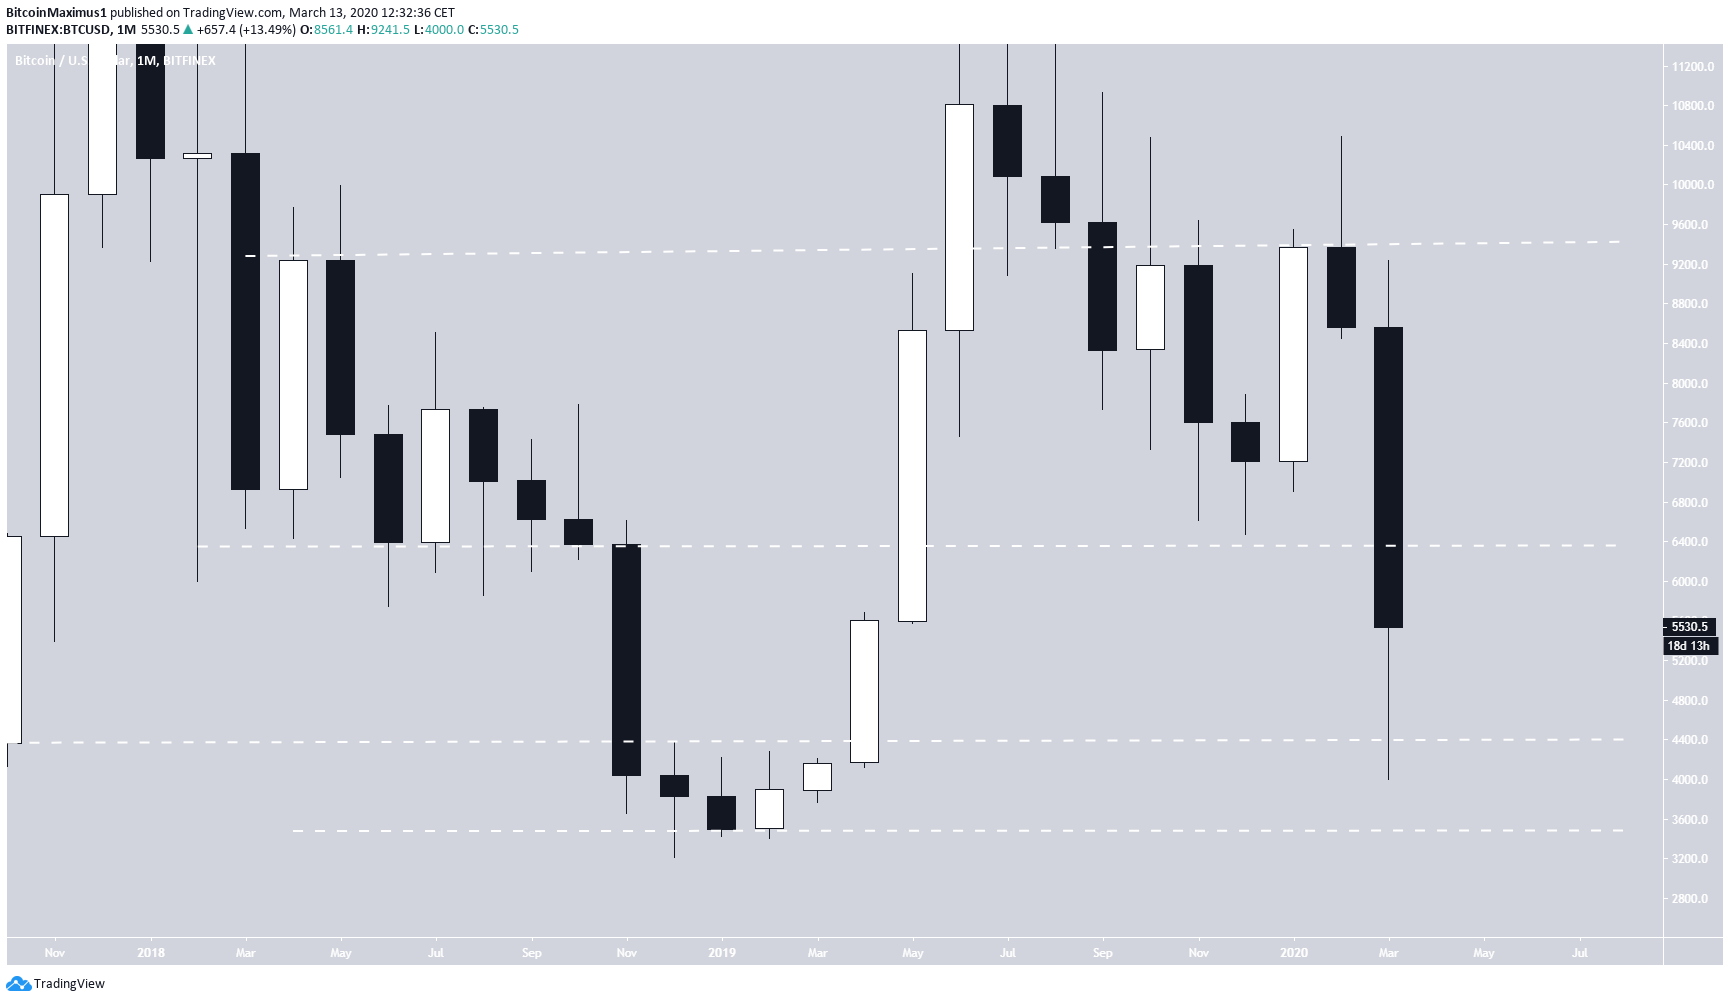
- There is resistance at $6450.
- There is support at $4500 & $3500.
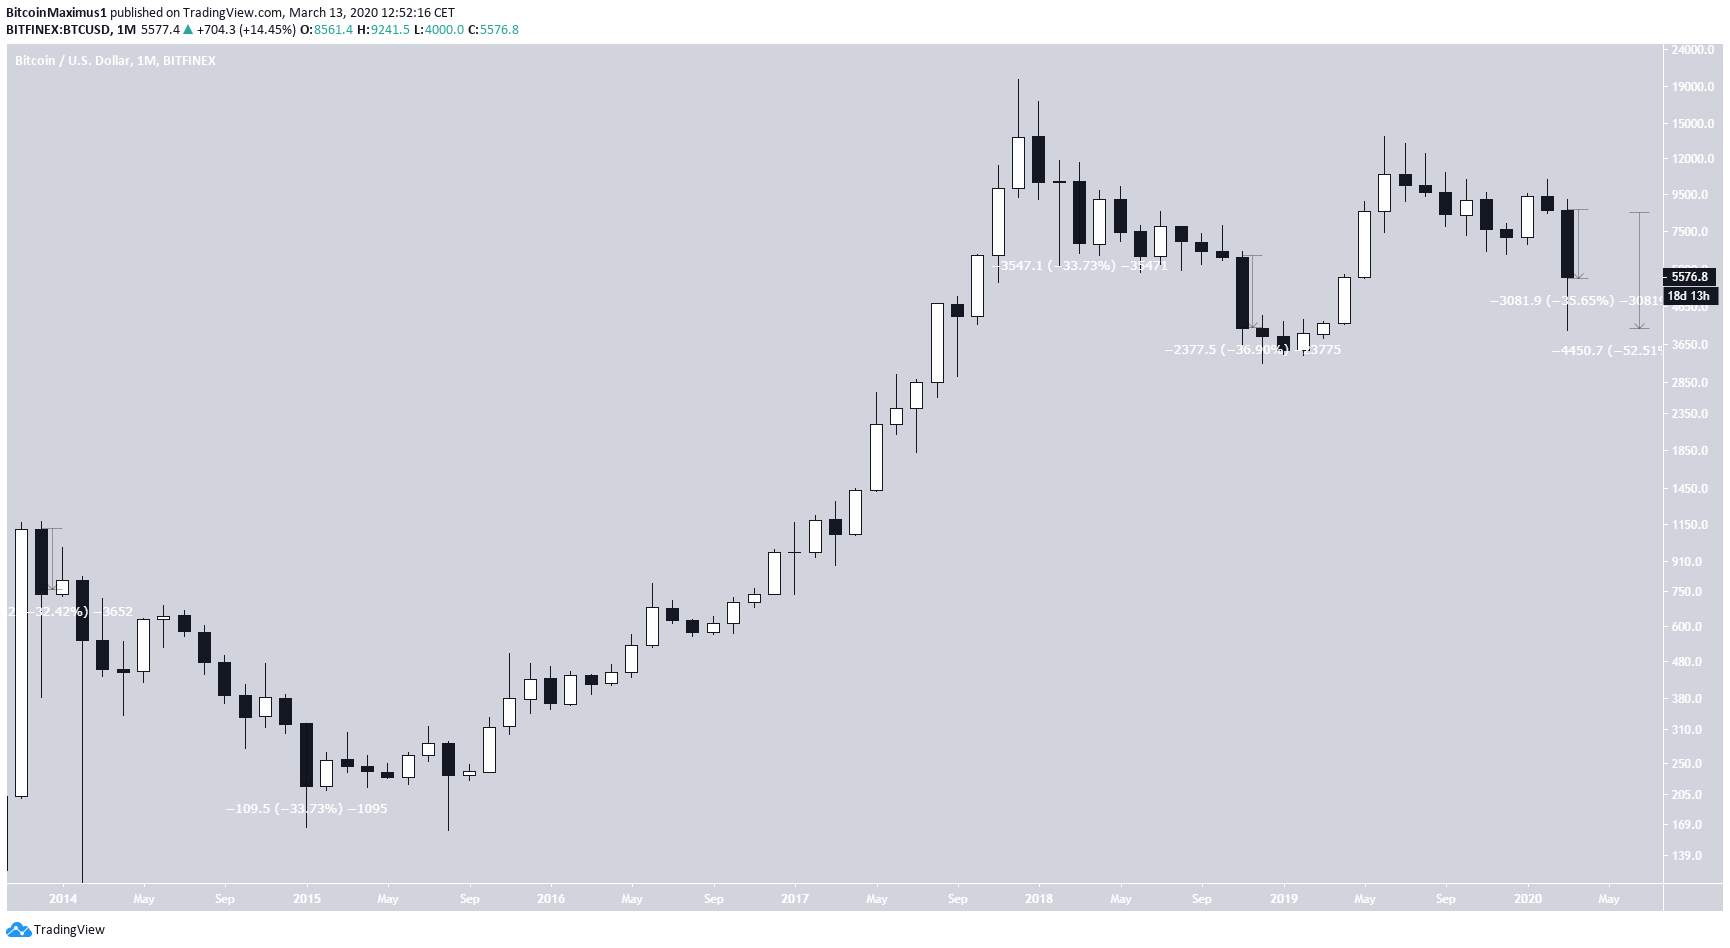
- The Bitcoin price has decreased by 36 percent so far in March.
What does this mean for the future of the price? Will Bitcoin close above the support levels he has outlined? Continue reading below if you want to find out.$BTC
— The Wolf Of All Streets (@scottmelker) March 13, 2020
From what I can find, this is presently the largest 12-hour green candle in the history of Bitcoin, by far. Also the most green volume. 52% rise from bottom to top. Absolutely insane.
I am going to keep pouring on the good news. I think we need it. pic.twitter.com/ONJ92CPFRY
Monthly Levels
If we use the monthly closing prices, the closest resistance area is found at $6450 instead. On the other hand, there are two main support areas — found at $4500 and $3500, respectively The price is currently trading between the $4500 and $6450 area. It is entirely possible that it will create a range between these two levels. However, there are more than two weeks left until the monthly candlestick closes, so it is also possible that the price will close above/below these levels. A price close above $6450 would have major bullish implications. On the other hand, a price close below the $3500 resistance area would likely take the price towards level not seen since 2017. Interestingly enough, besides a four-month period in November 2018-March 2019, the monthly RSI has never traded below 50 — which is indicative that the price is in a downward trend. If the monthly candlestick closes below $3500, it would likely send the monthly RSI to its lowest level ever, confirming that the price is in a downward trend.
Previous Monthly Closes
Until now, the monthly candlestick with the biggest opening/closing price decrease has been November 2018, with a 37 percent decrease. There have been several other candlesticks that closed around -33 percent. For only 13 days in March, the BTC price has decreased by 36 percent, reaching a low of 52 percent. Therefore, the current monthly candlestick is shaping up to be the worst one in BTC’s price history. It is not an overstatement to say that the March closing price will have major implications for the direction of the future trend. To conclude, the BTC price is in the process of creating the worst monthly candlestick in its history. A monthly close above $6450 would be bullish, while a close below $3500 bearish, suggesting that the price has begun a long-term downward trend.
Disclaimer
In line with the Trust Project guidelines, this price analysis article is for informational purposes only and should not be considered financial or investment advice. BeInCrypto is committed to accurate, unbiased reporting, but market conditions are subject to change without notice. Always conduct your own research and consult with a professional before making any financial decisions. Please note that our Terms and Conditions, Privacy Policy, and Disclaimers have been updated.

