

Despite a market-wide pullback, BUILDon (B), a meme coin built on the BNB Chain, has emerged today’s top gainer. It trades at $0.71, climbing 4% in the past 24 hours.
Technical readings show the token’s momentum is backed by strong buying pressure. If demand holds, B could retest its all-time high of $0.74 and potentially push beyond it.
Traders Pile Into BUILDon
B/USD daily chart readings show the token’s Relative Strength Index (RSI) trending upward, reflecting sustained buying pressure among spot market participants. As of this writing, the momentum indicator stands at 65.34.
For token TA and market updates: Want more token insights like this? Sign up for Editor Harsh Notariya’s Daily Crypto Newsletter here.
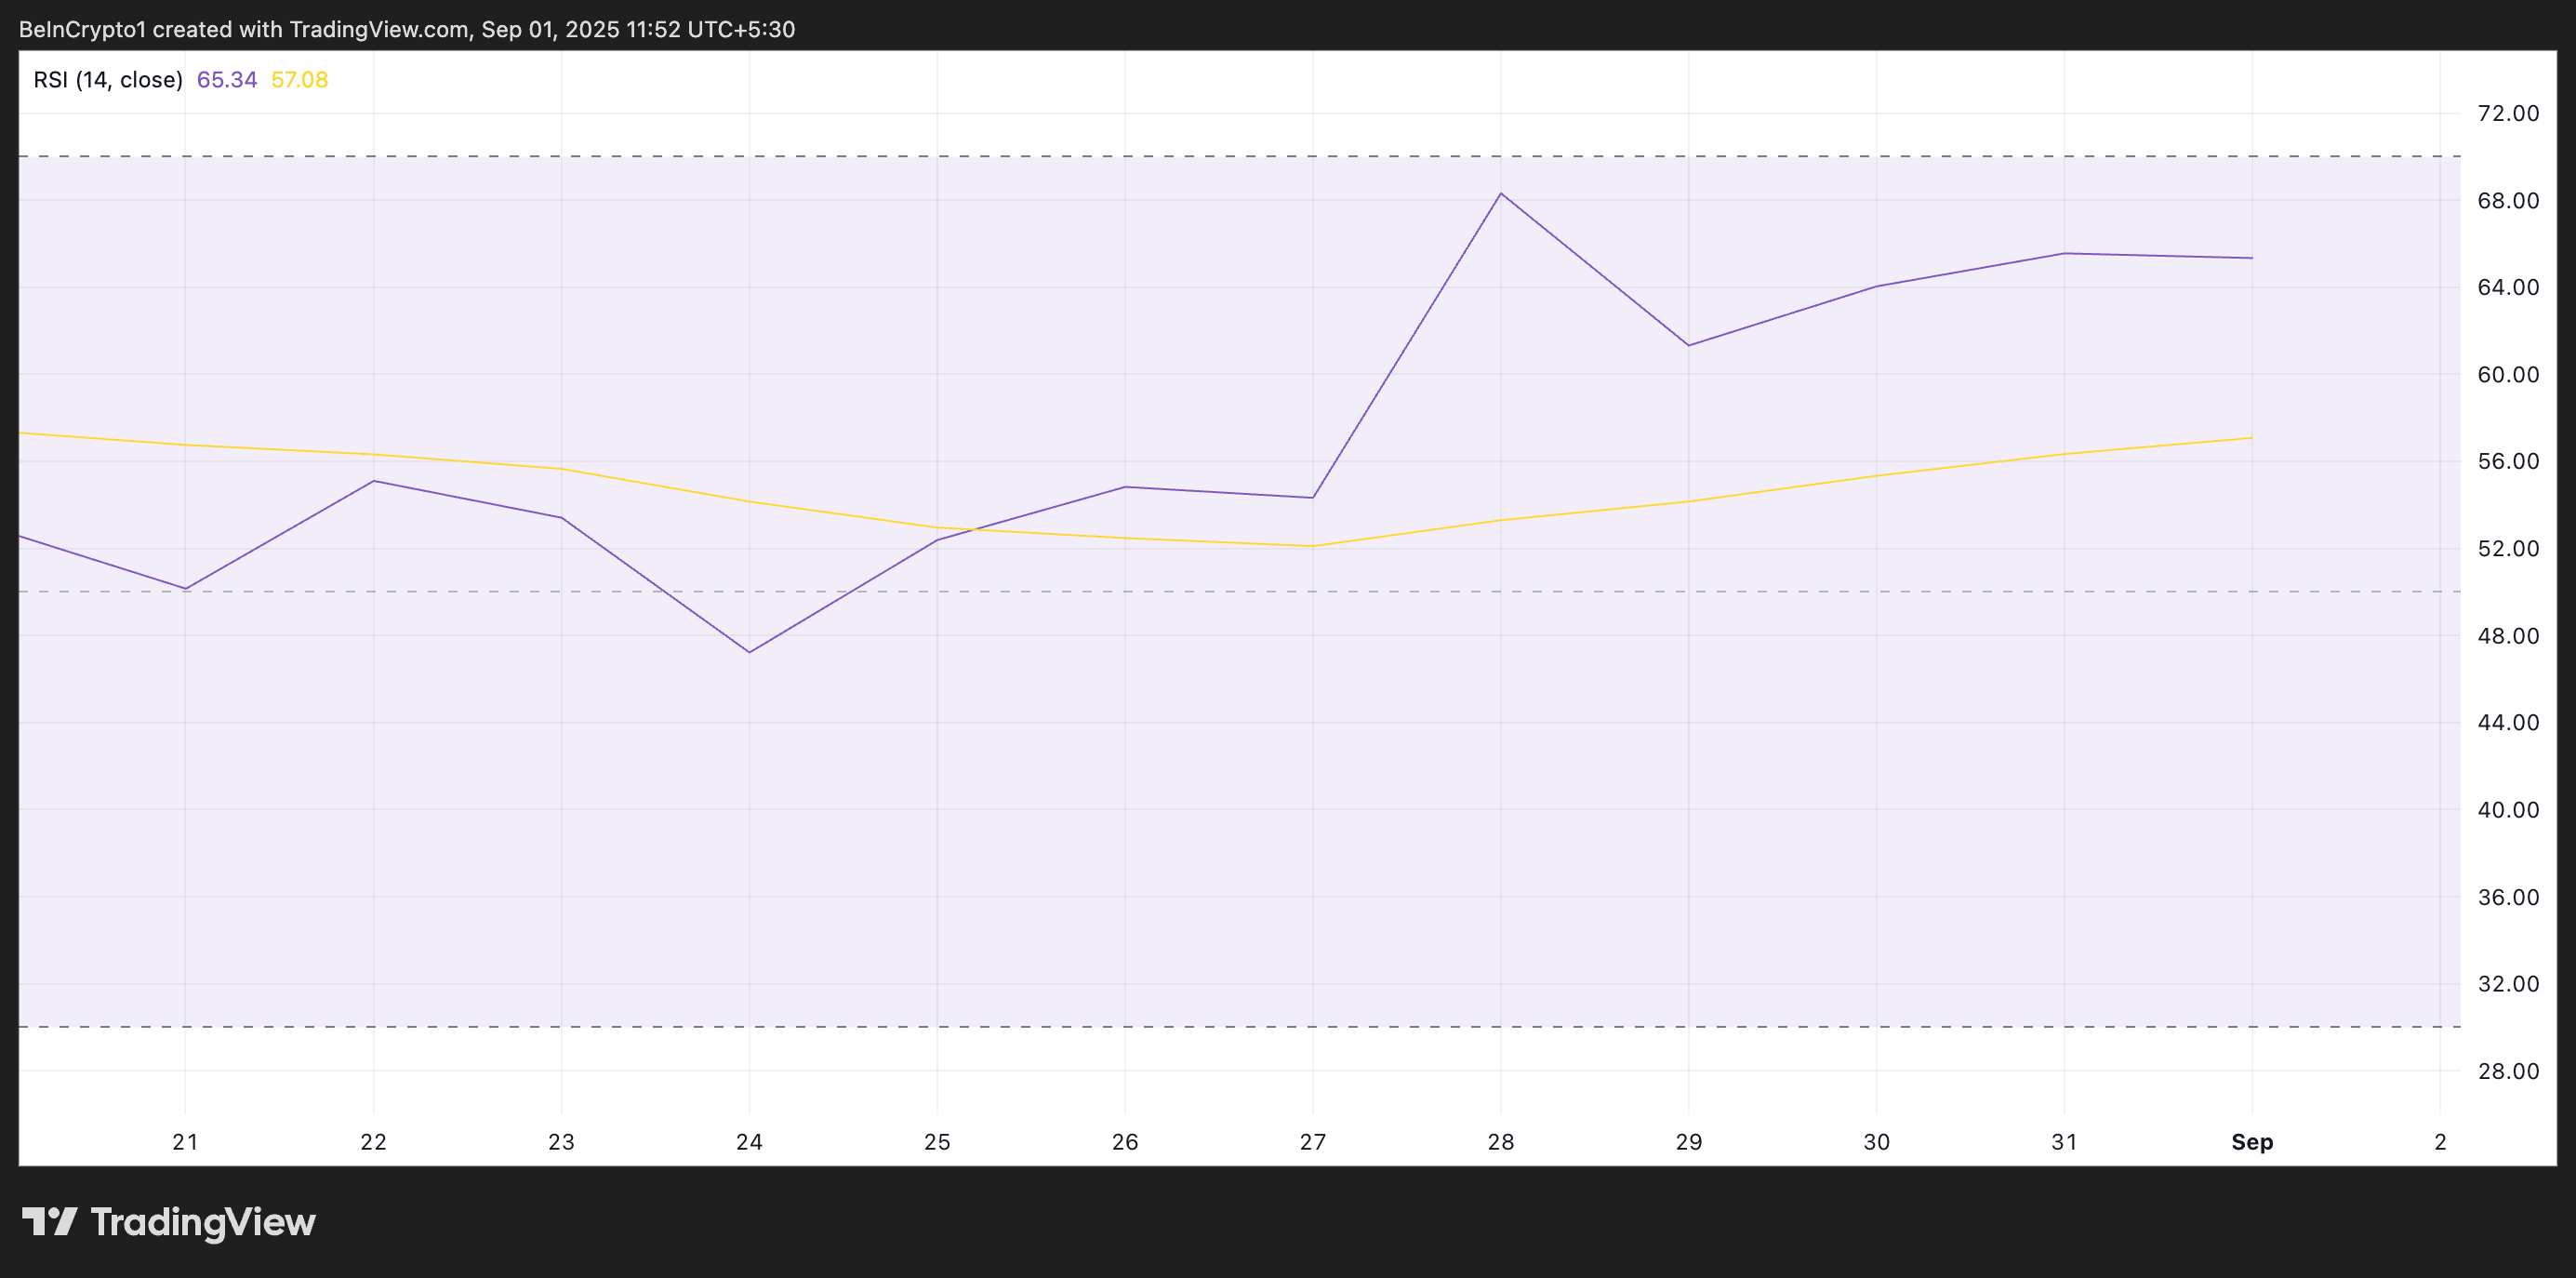
The RSI indicator measures an asset’s overbought and oversold market conditions. It ranges between 0 and 100. Values above 70 suggest that the asset is overbought and due for a price decline, while values under 30 indicate that the asset is oversold and may witness a rebound.
B’s RSI reading of 65.34 indicates room for further upside before the token becomes overbought and witnesses a decline. The steady climb in the RSI value reflects consistent buying pressure from traders, suggesting B investors remain confident in the token’s short-term trajectory.
Moreover, the setup of B’s Moving Average Convergence Divergence (MACD) indicator confirms the growing bullish momentum. At press time, B’s MACD line (blue) rests above the signal line (orange), with the green histogram bars growing in size — a sign that bullish activity is increasing.
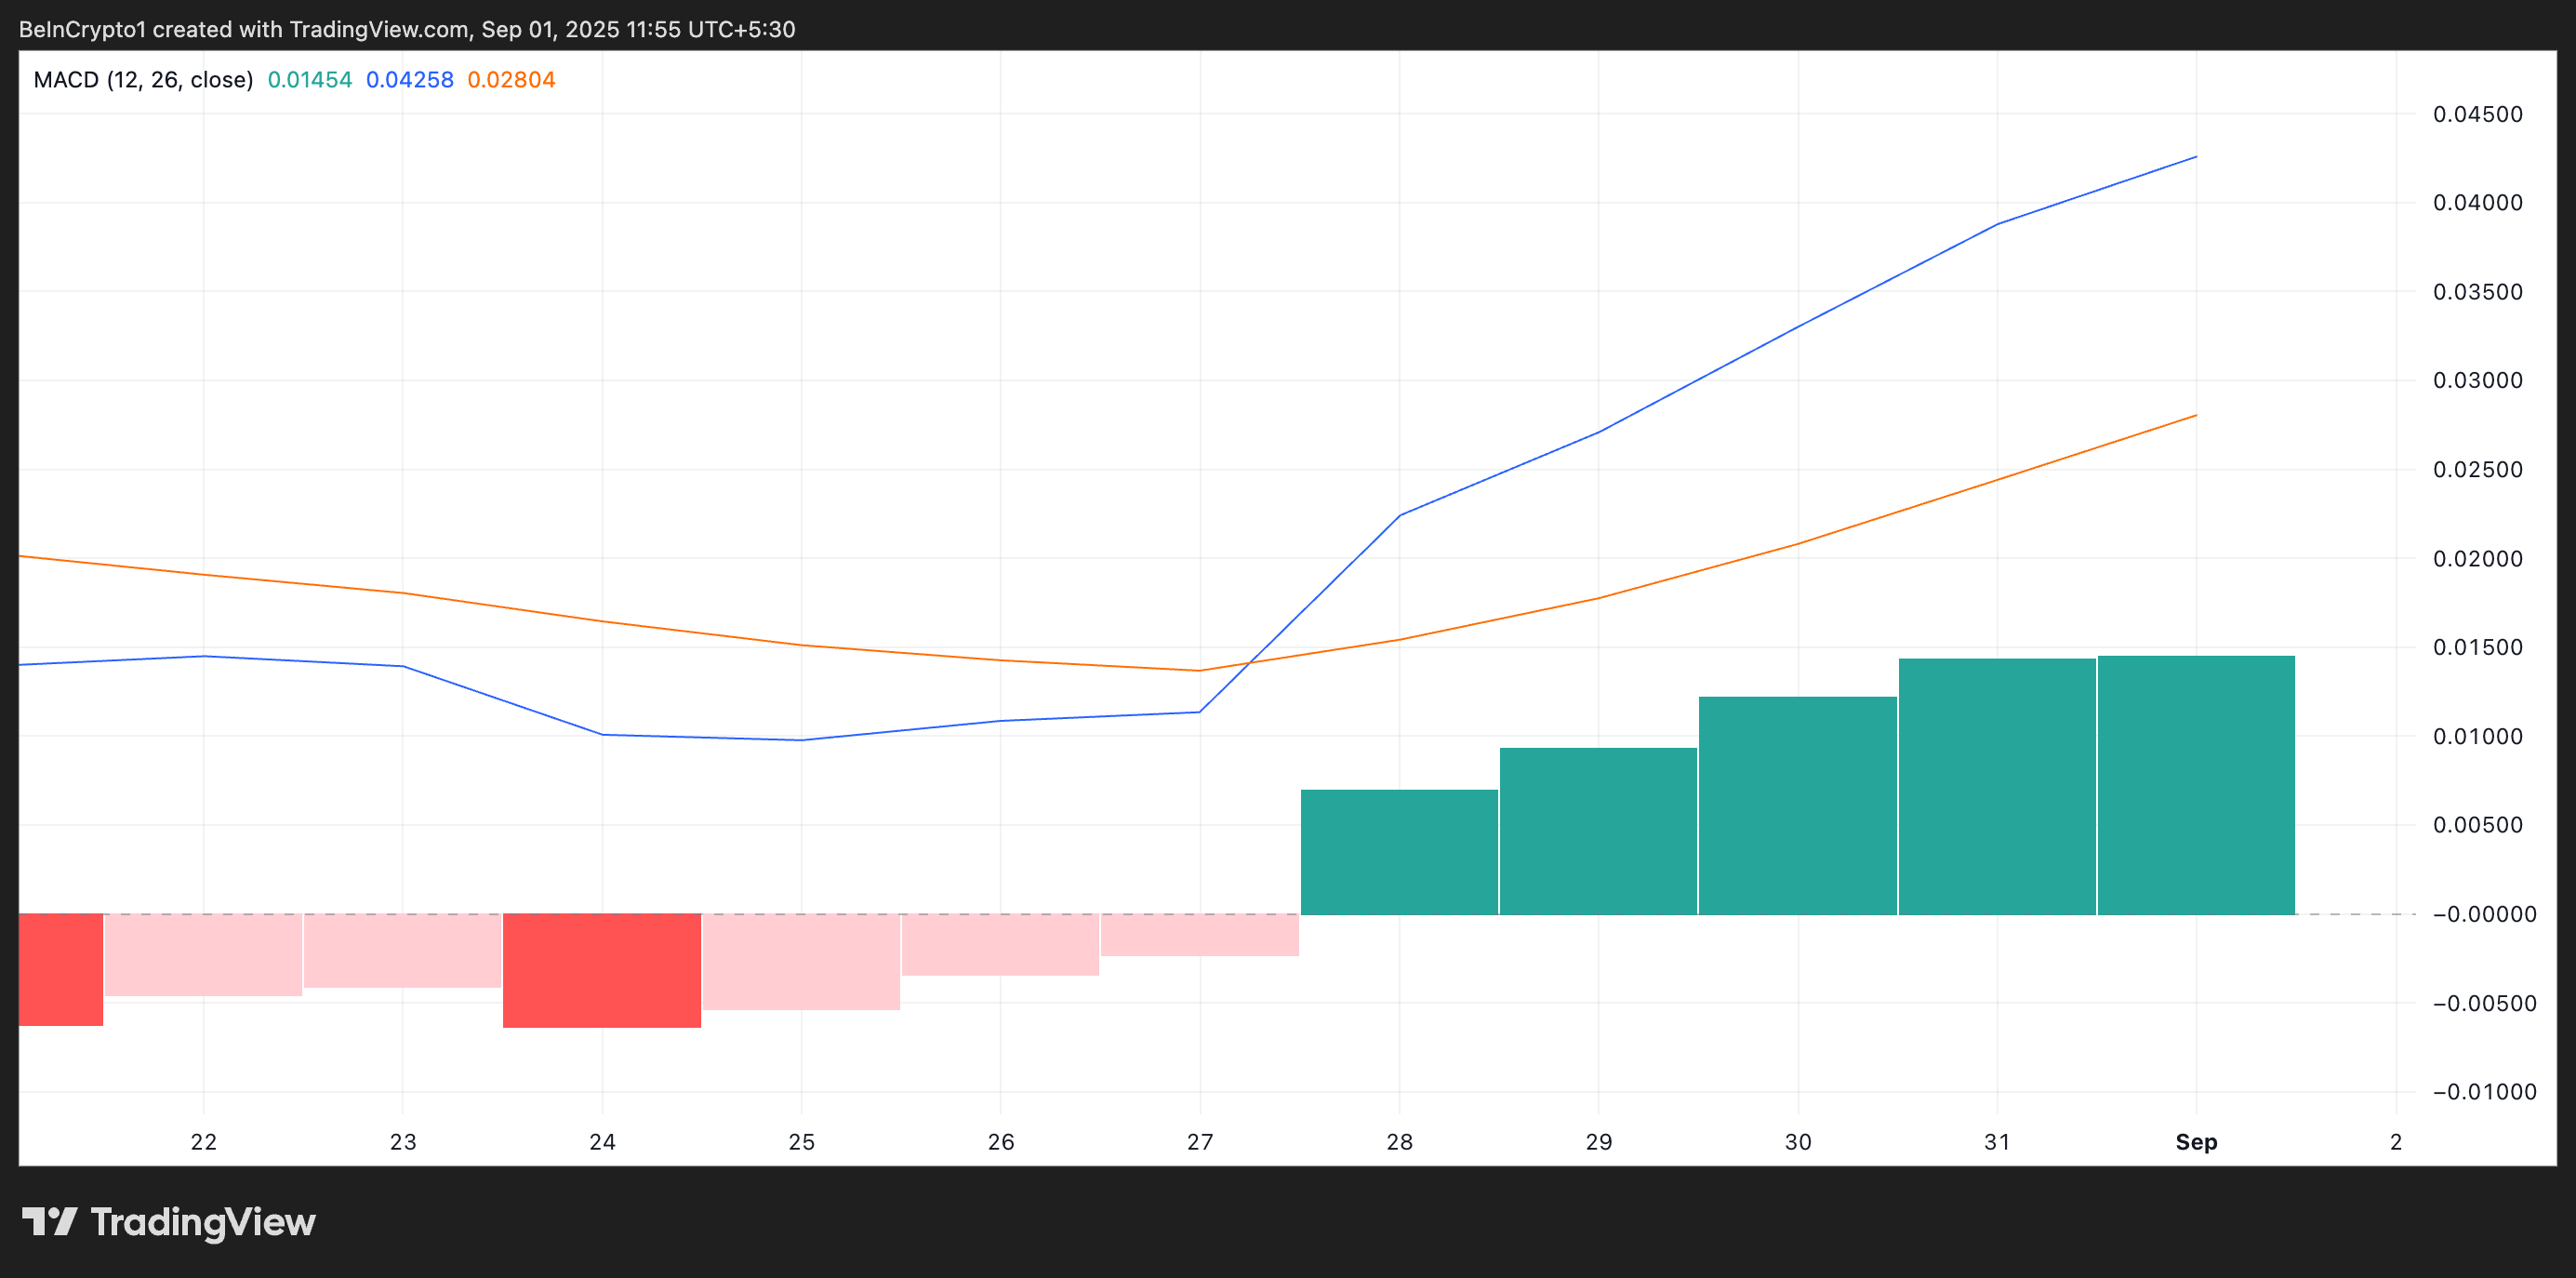
The MACD indicator identifies trends and momentum in its price movement. It helps traders spot potential buy or sell signals through crossovers between the MACD and signal lines.
As with B, when the MACD line rests above the signal line, it signals declining selling pressure and growing buy-side strength.
Profit-Takers Circle as BUILDon Approaches All-Time High
An uptick in BUILDon’s demand could drive the token toward its all-time high of $0.74, with the possibility of breaking past it if momentum strengthens.
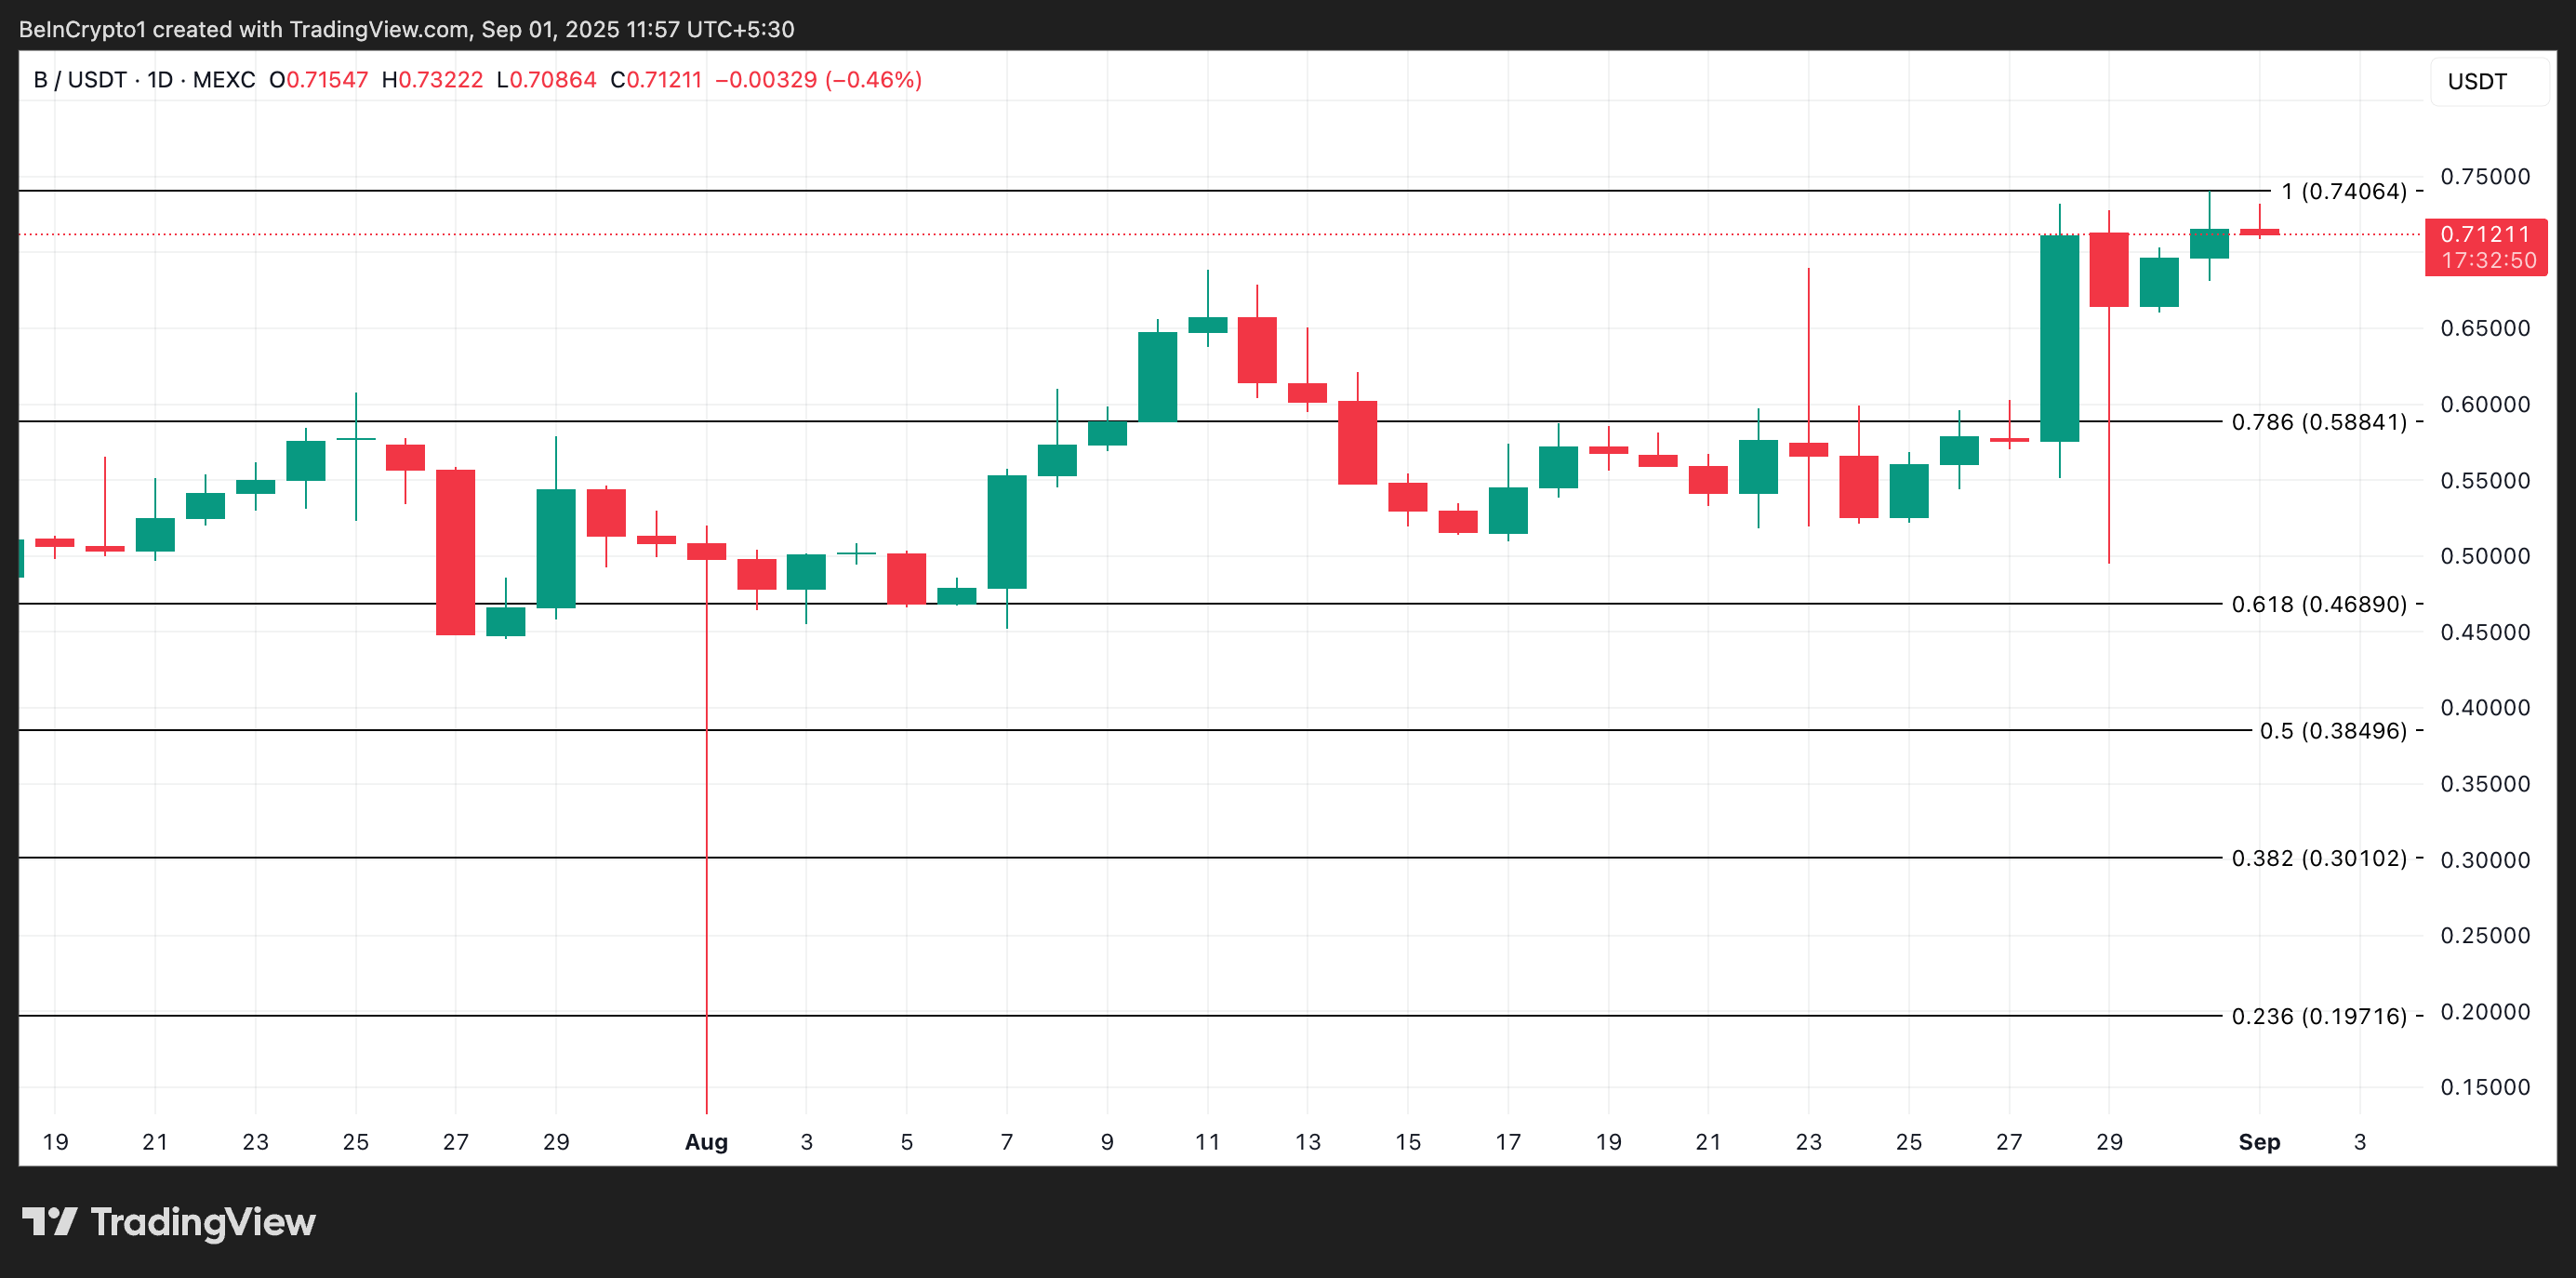
However, a rejection at this resistance level may trigger short-term profit-taking, potentially pulling the price back down toward $0.58.
Disclaimer
In line with the Trust Project guidelines, this price analysis article is for informational purposes only and should not be considered financial or investment advice. BeInCrypto is committed to accurate, unbiased reporting, but market conditions are subject to change without notice. Always conduct your own research and consult with a professional before making any financial decisions. Please note that our Terms and Conditions, Privacy Policy, and Disclaimers have been updated.