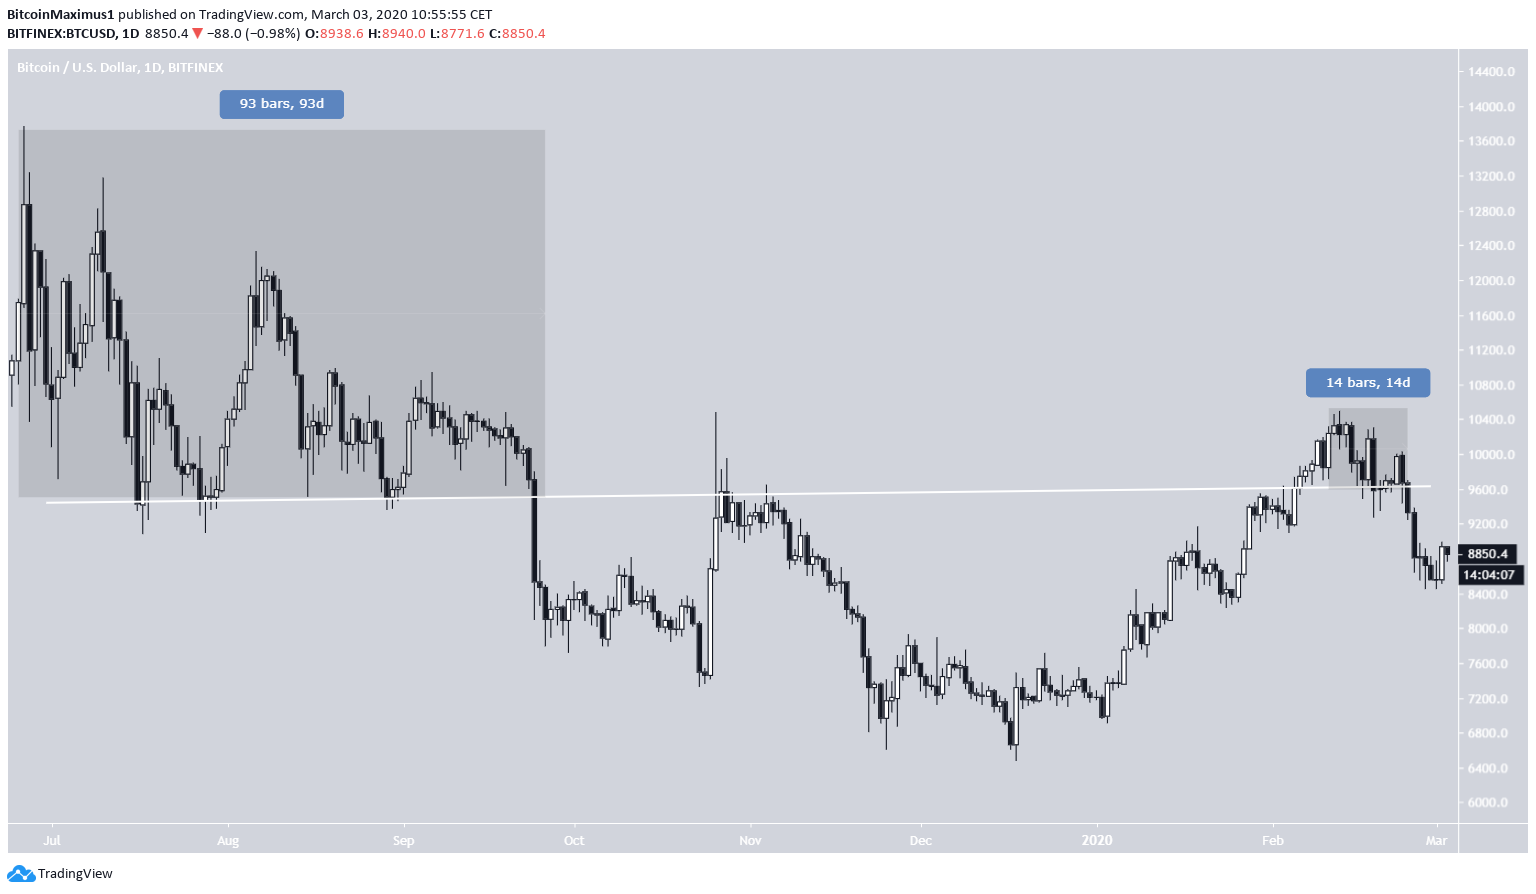
On February 24-26, the Bitcoin price plummeted, decreasing by 13 percent. While this could have been caused by a coronavirus panic since the entire global economy has slowed down considerably, there is another possibility: the price is simply following a fractal from its earlier movement.
Bitcoin (BTC) Price Highlights
- The Bitcoin price might be following a fractal from July 2019.
- It is, possibly, in the third wave of a five wave Elliott formation.
- There is resistance at $9500.
- There is support a $7800 and $8400.
In the tweet, he asks the question “What happens next?” Continue reading below if you want to find out.$BTC
— Posty (@PostyXBT) March 3, 2020
What happens next? 👀 pic.twitter.com/fdhw4kyPFH
Bitcoin Fractal
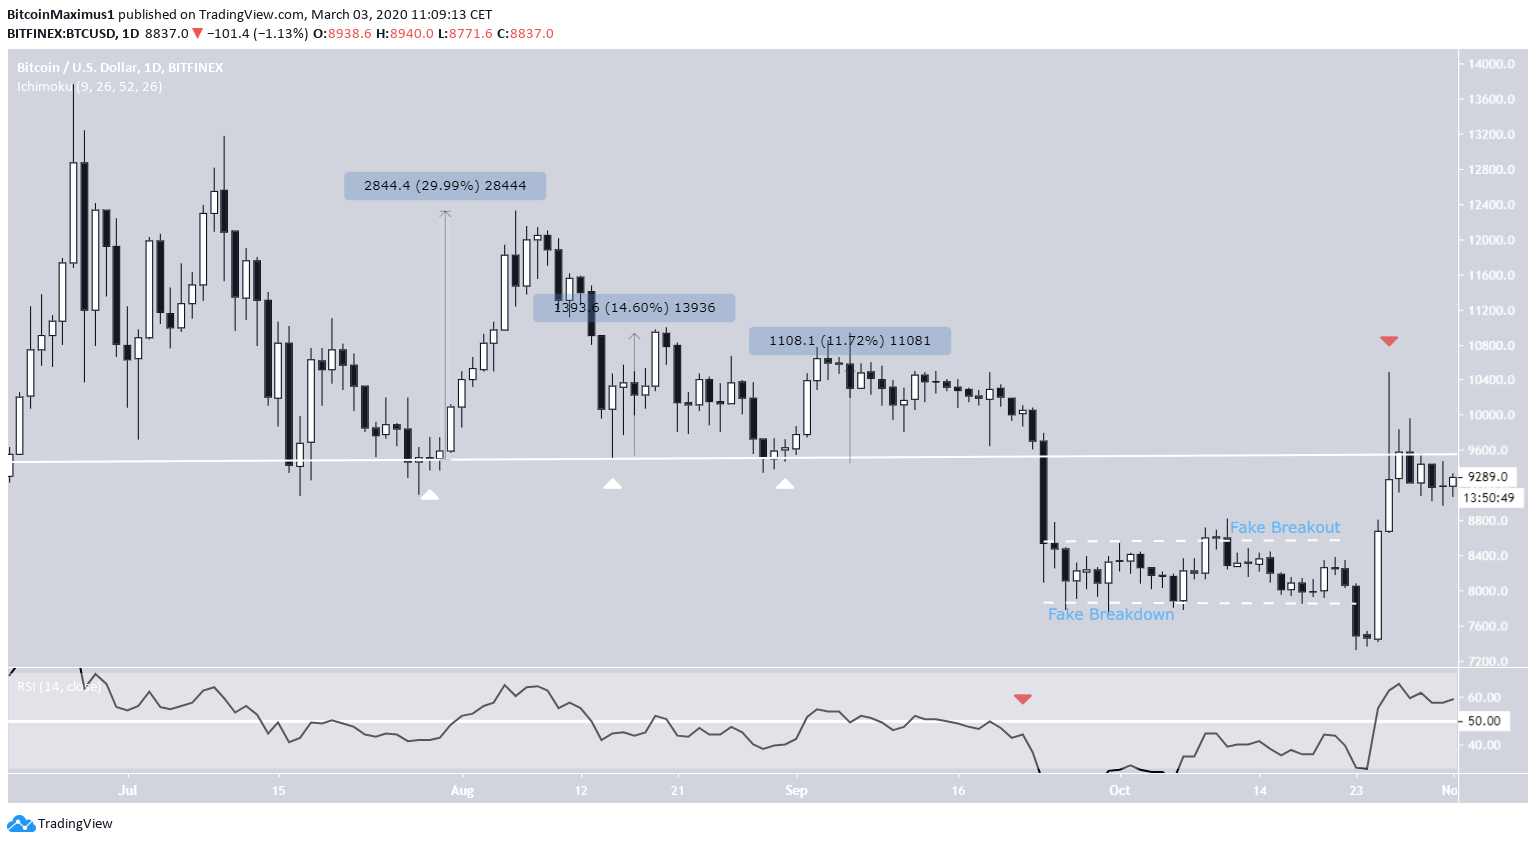
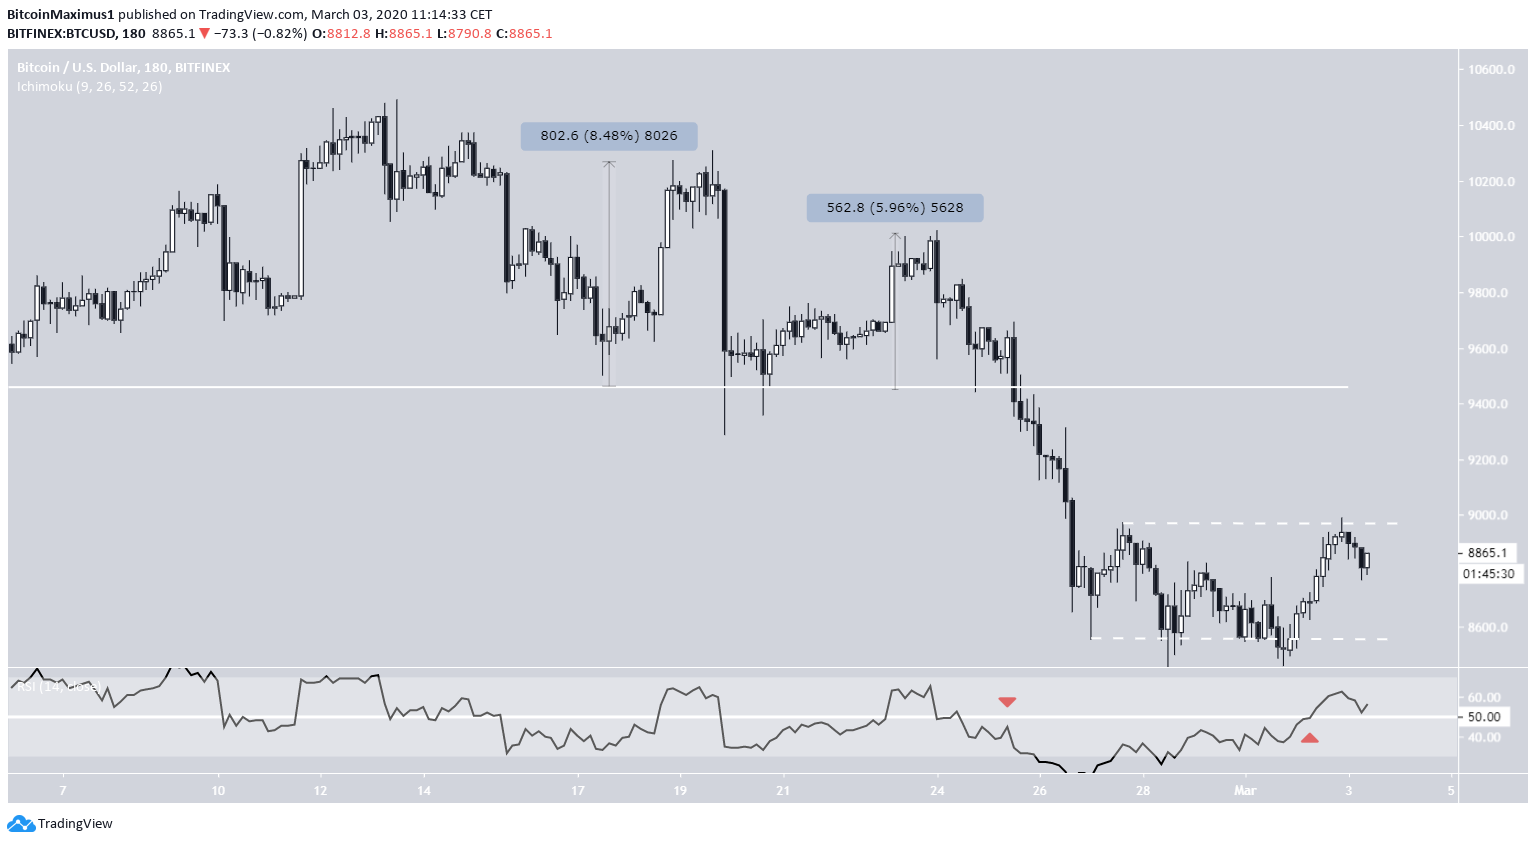
The highlighted periods are the ones that supposedly have similarities. While the time-frames are completely different, the main similarity comes from the fact that the price has created several lower highs along with a horizontal support line both times — which resembles a descending triangle, a bearish pattern. If the fractal holds, we will have a fake breakdown towards $8000, followed by a very rapid upward move towards $9500 — validating the breakdown level as resistance. The time periods of the movements have about a 7:1 ratio, so the daily time-frame in the first one should correspond with the three-hour time-frame in the current one.
Original Movement
In the 2019 movement, each bounce from the support line was weaker than the previous one, leading to a smaller percentage increase. During this time, the RSI freely moved above and below 50, indicative of range trading. After the breakdown, it moved sharply down. Afterward, the price created a small trading range, that had one fake breakout and one fake breakdown preceding a very rapid upward move that validated the previous breakdown level. The Bitcoin price continued its decrease afterwards.
Current Movement
The current movement is very similar in some aspects — more specifically, the bounce strength and the RSI. The bounces at the support line have been successively weaker and the RSI has been freely moving above and below the 50 line, indicative of range trading. After the breakdown, the RSI similarly decreased sharply. Afterward, the price has likewise created a short-term trading range. However, the RSI has clearly moved above 50. Therefore, we have the first difference between the two movement: While the price movement and technical indicators until the breakdown have been very similar, this changed after the breakdown.
Conclusion
While the short-term range movement might not be identical, a similar relief rally is expected, due to the long-term comparability. It seems that the Bitcoin price has completed a five wave Elliott formation and the ensuing decrease was the A wave of an A-B-C correction. So, after the B wave ends near the breakdown level, a C wave towards $7800 is expected. If this takes the same amount of time as the upward move, it could be completed by the end of March. To conclude, after the February 24-26 price decrease, the BTC price has been range trading. We believe that it will eventually break out and begin a relief rally and subsequently continue its downward movement.
Top crypto platforms in the US
Disclaimer
In line with the Trust Project guidelines, this price analysis article is for informational purposes only and should not be considered financial or investment advice. BeInCrypto is committed to accurate, unbiased reporting, but market conditions are subject to change without notice. Always conduct your own research and consult with a professional before making any financial decisions. Please note that our Terms and Conditions, Privacy Policy, and Disclaimers have been updated.

Valdrin Tahiri
Valdrin discovered cryptocurrencies while he was getting his MSc in Financial Markets from the Barcelona School of Economics. Shortly after graduating, he began writing for several different cryptocurrency related websites as a freelancer before eventually taking on the role of BeInCrypto's Senior Analyst.
(I do not have a discord and will not contact you first there. Beware of scammers)
READ FULL BIO
Sponsored
Sponsored
