

PI Network’s token has remained mostly sideways, showing signs of consolidation since it hit a new all-time low of $0.32 on August 1.
However, bullish momentum is emerging as buyers appear to capitalize on the dip. The question remains whether this growing optimism could translate into more gains in the coming session.
Selling Pressure Eases on PI Token
On the one-day chart, PI’s Moving Average Convergence Divergence (MACD) indicator is approaching a positive crossover, signaling a potential shift in momentum toward buying strength.
For token TA and market updates: Want more token insights like this? Sign up for Editor Harsh Notariya’s Daily Crypto Newsletter here.
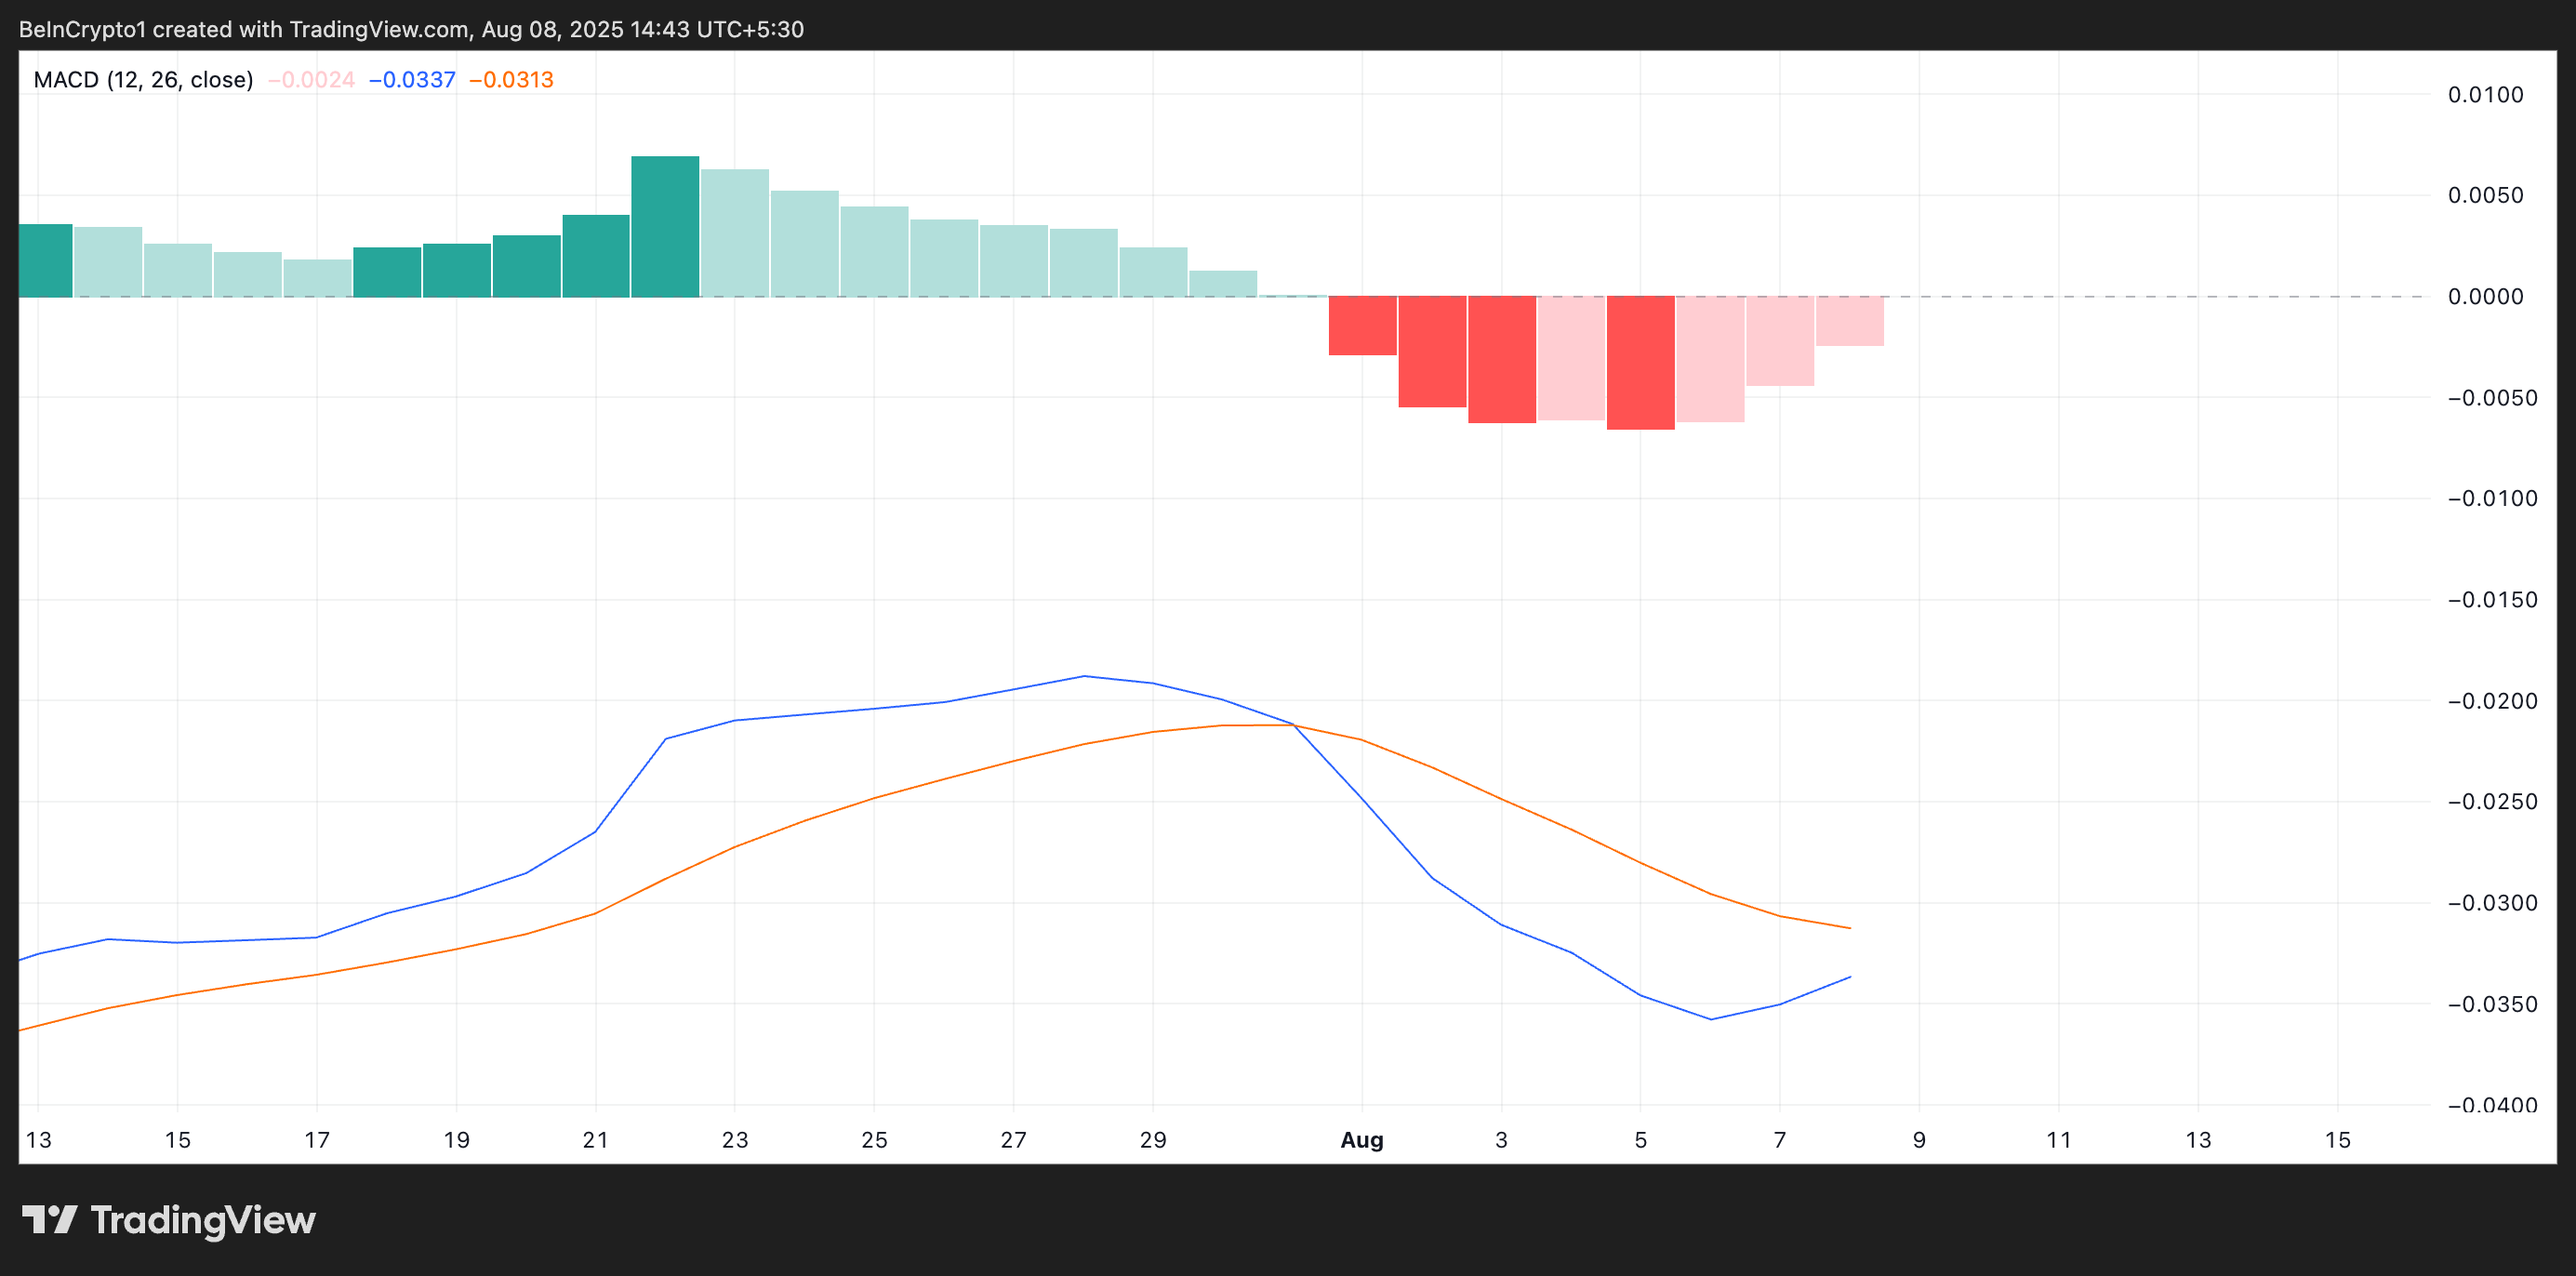
An asset’s MACD indicator identifies trends and momentum in its price movement. It helps traders spot potential buy or sell signals through crossovers between the MACD and signal lines.
A positive crossover occurs when the MACD line (blue) crosses the signal line (orange)
This is a bullish signal because it indicates that the asset’s short-term momentum is gaining strength relative to its longer-term trend. For PI, this means that buying interest is increasing and could push the price higher in the near term.
Additionally, readings from PI’s BBTrend indicator show a steady decline in the sizes of its red bars since the sideways trend began.
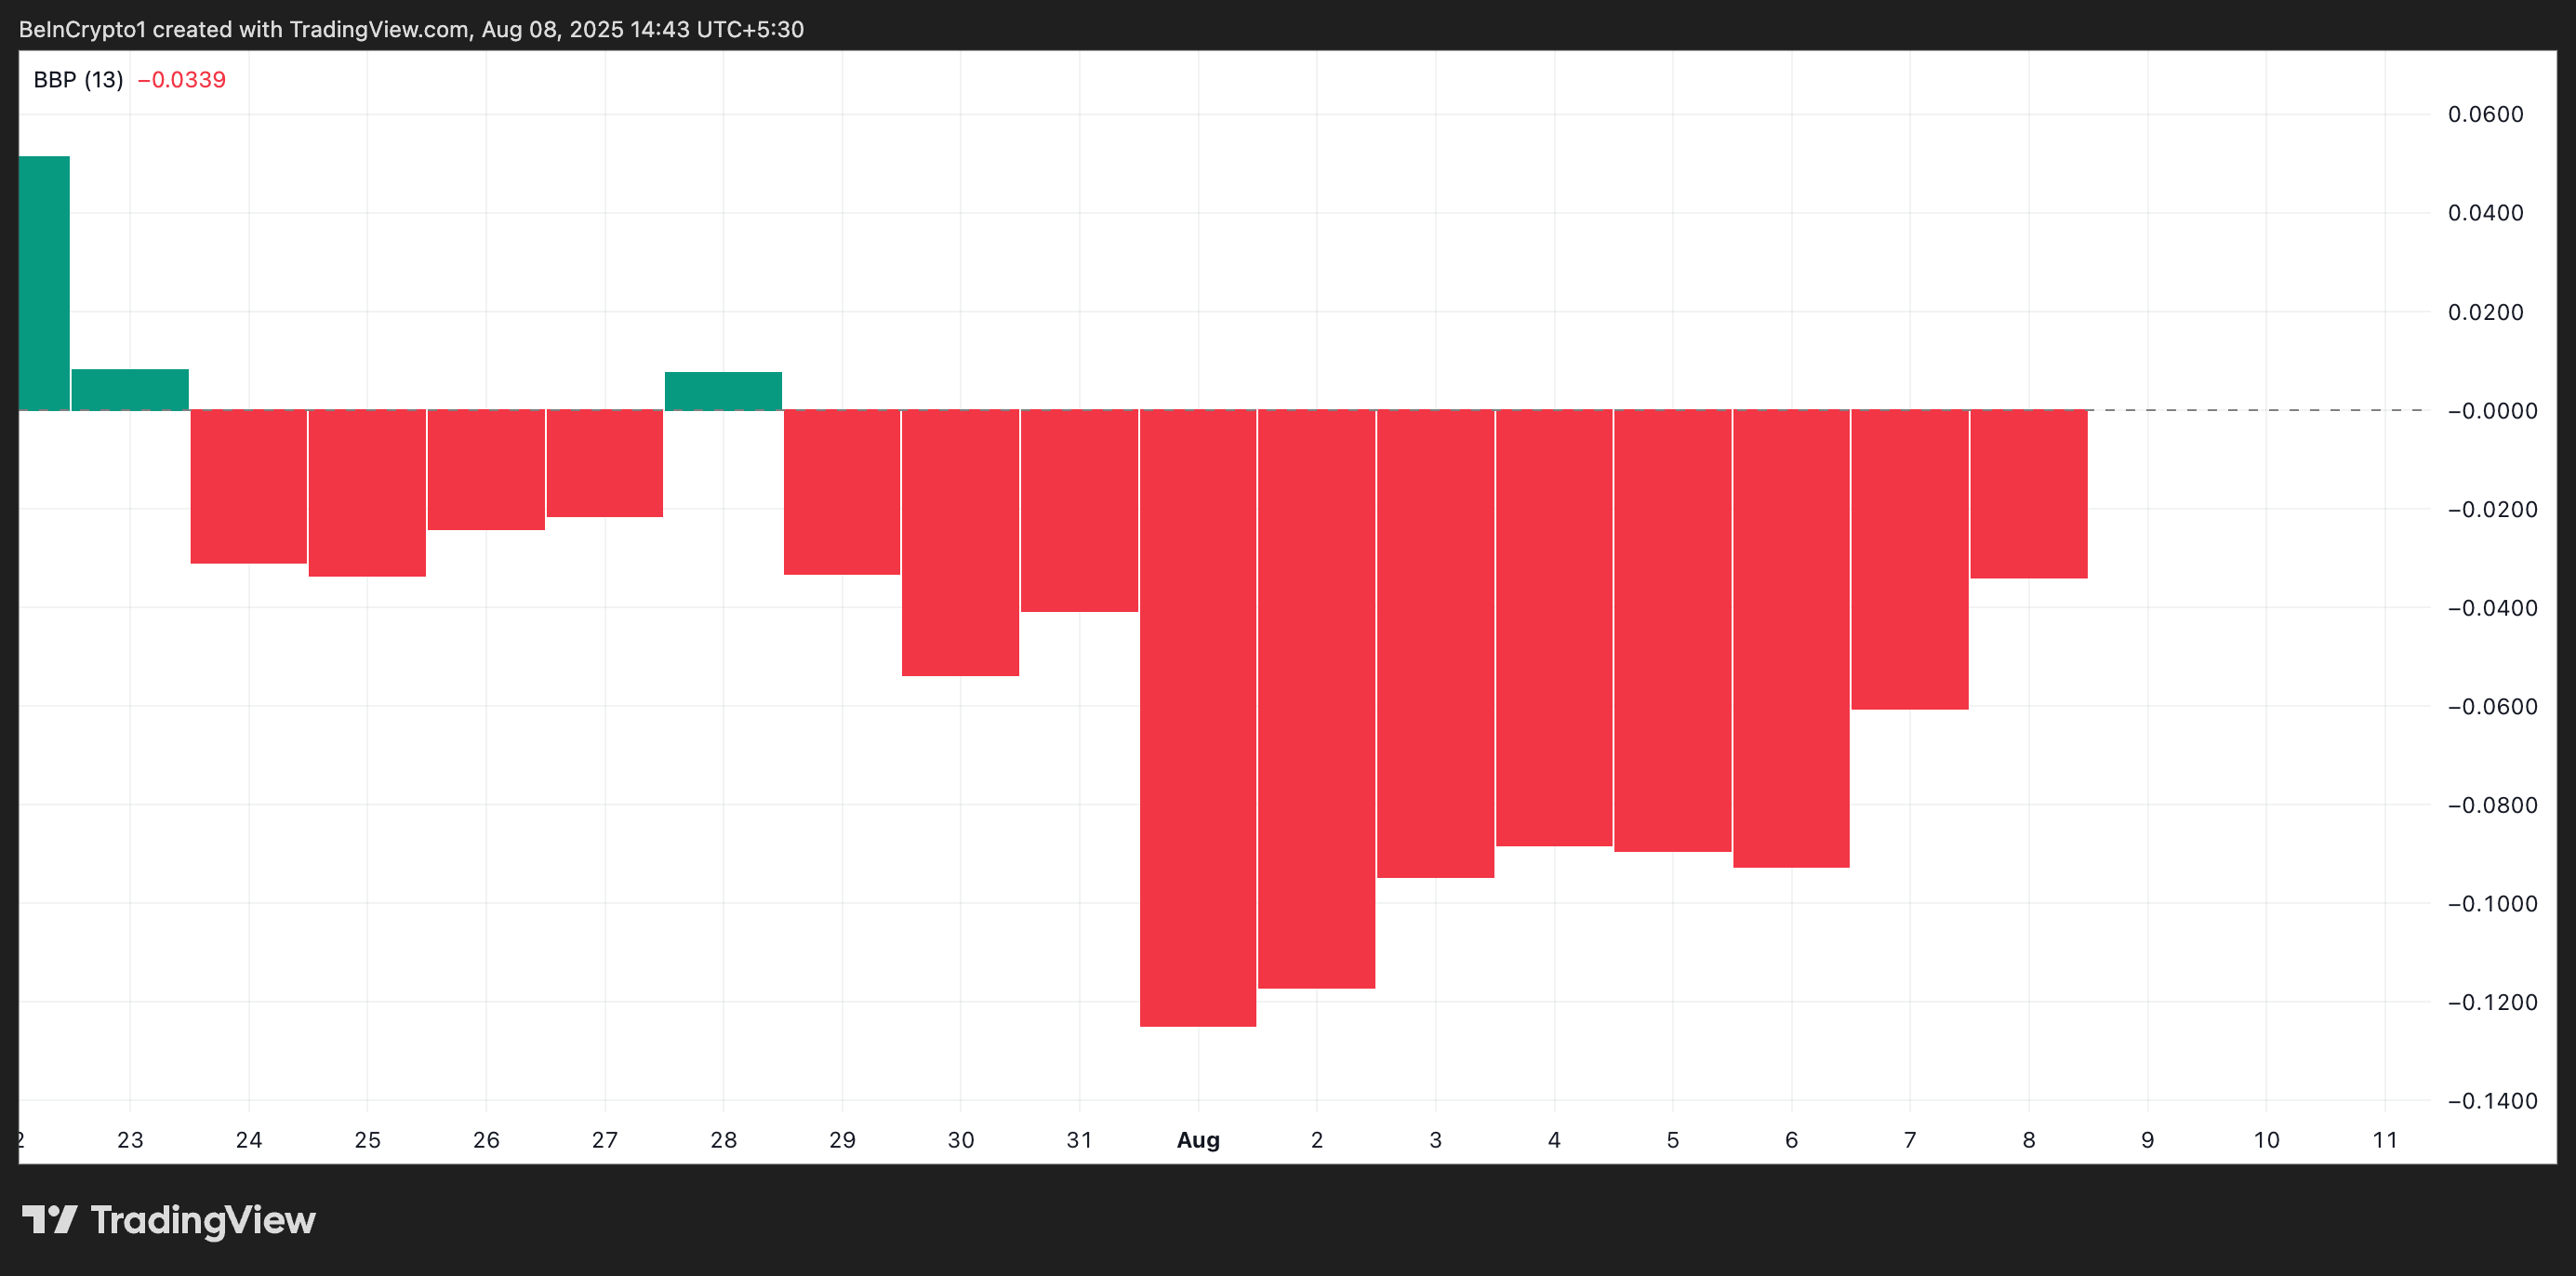
The BBTrend measures the strength and direction of a trend based on the expansion and contraction of Bollinger Bands. When it returns red bars, the asset’s price consistently closes near the lower Bollinger Band, reflecting sustained selling pressure.
However, when the sizes of these red bars start to drop, like with PI, selling pressure is easing, and the market sentiment is shifting towards buying.
PI Token’s Next Move Hinges on Demand
A sustained demand for PI could push it above the upper range of its horizontal channel, which forms resistance at $0.37. If successfully turned into a support floor, it could pave the way for a further rally to $0.44.
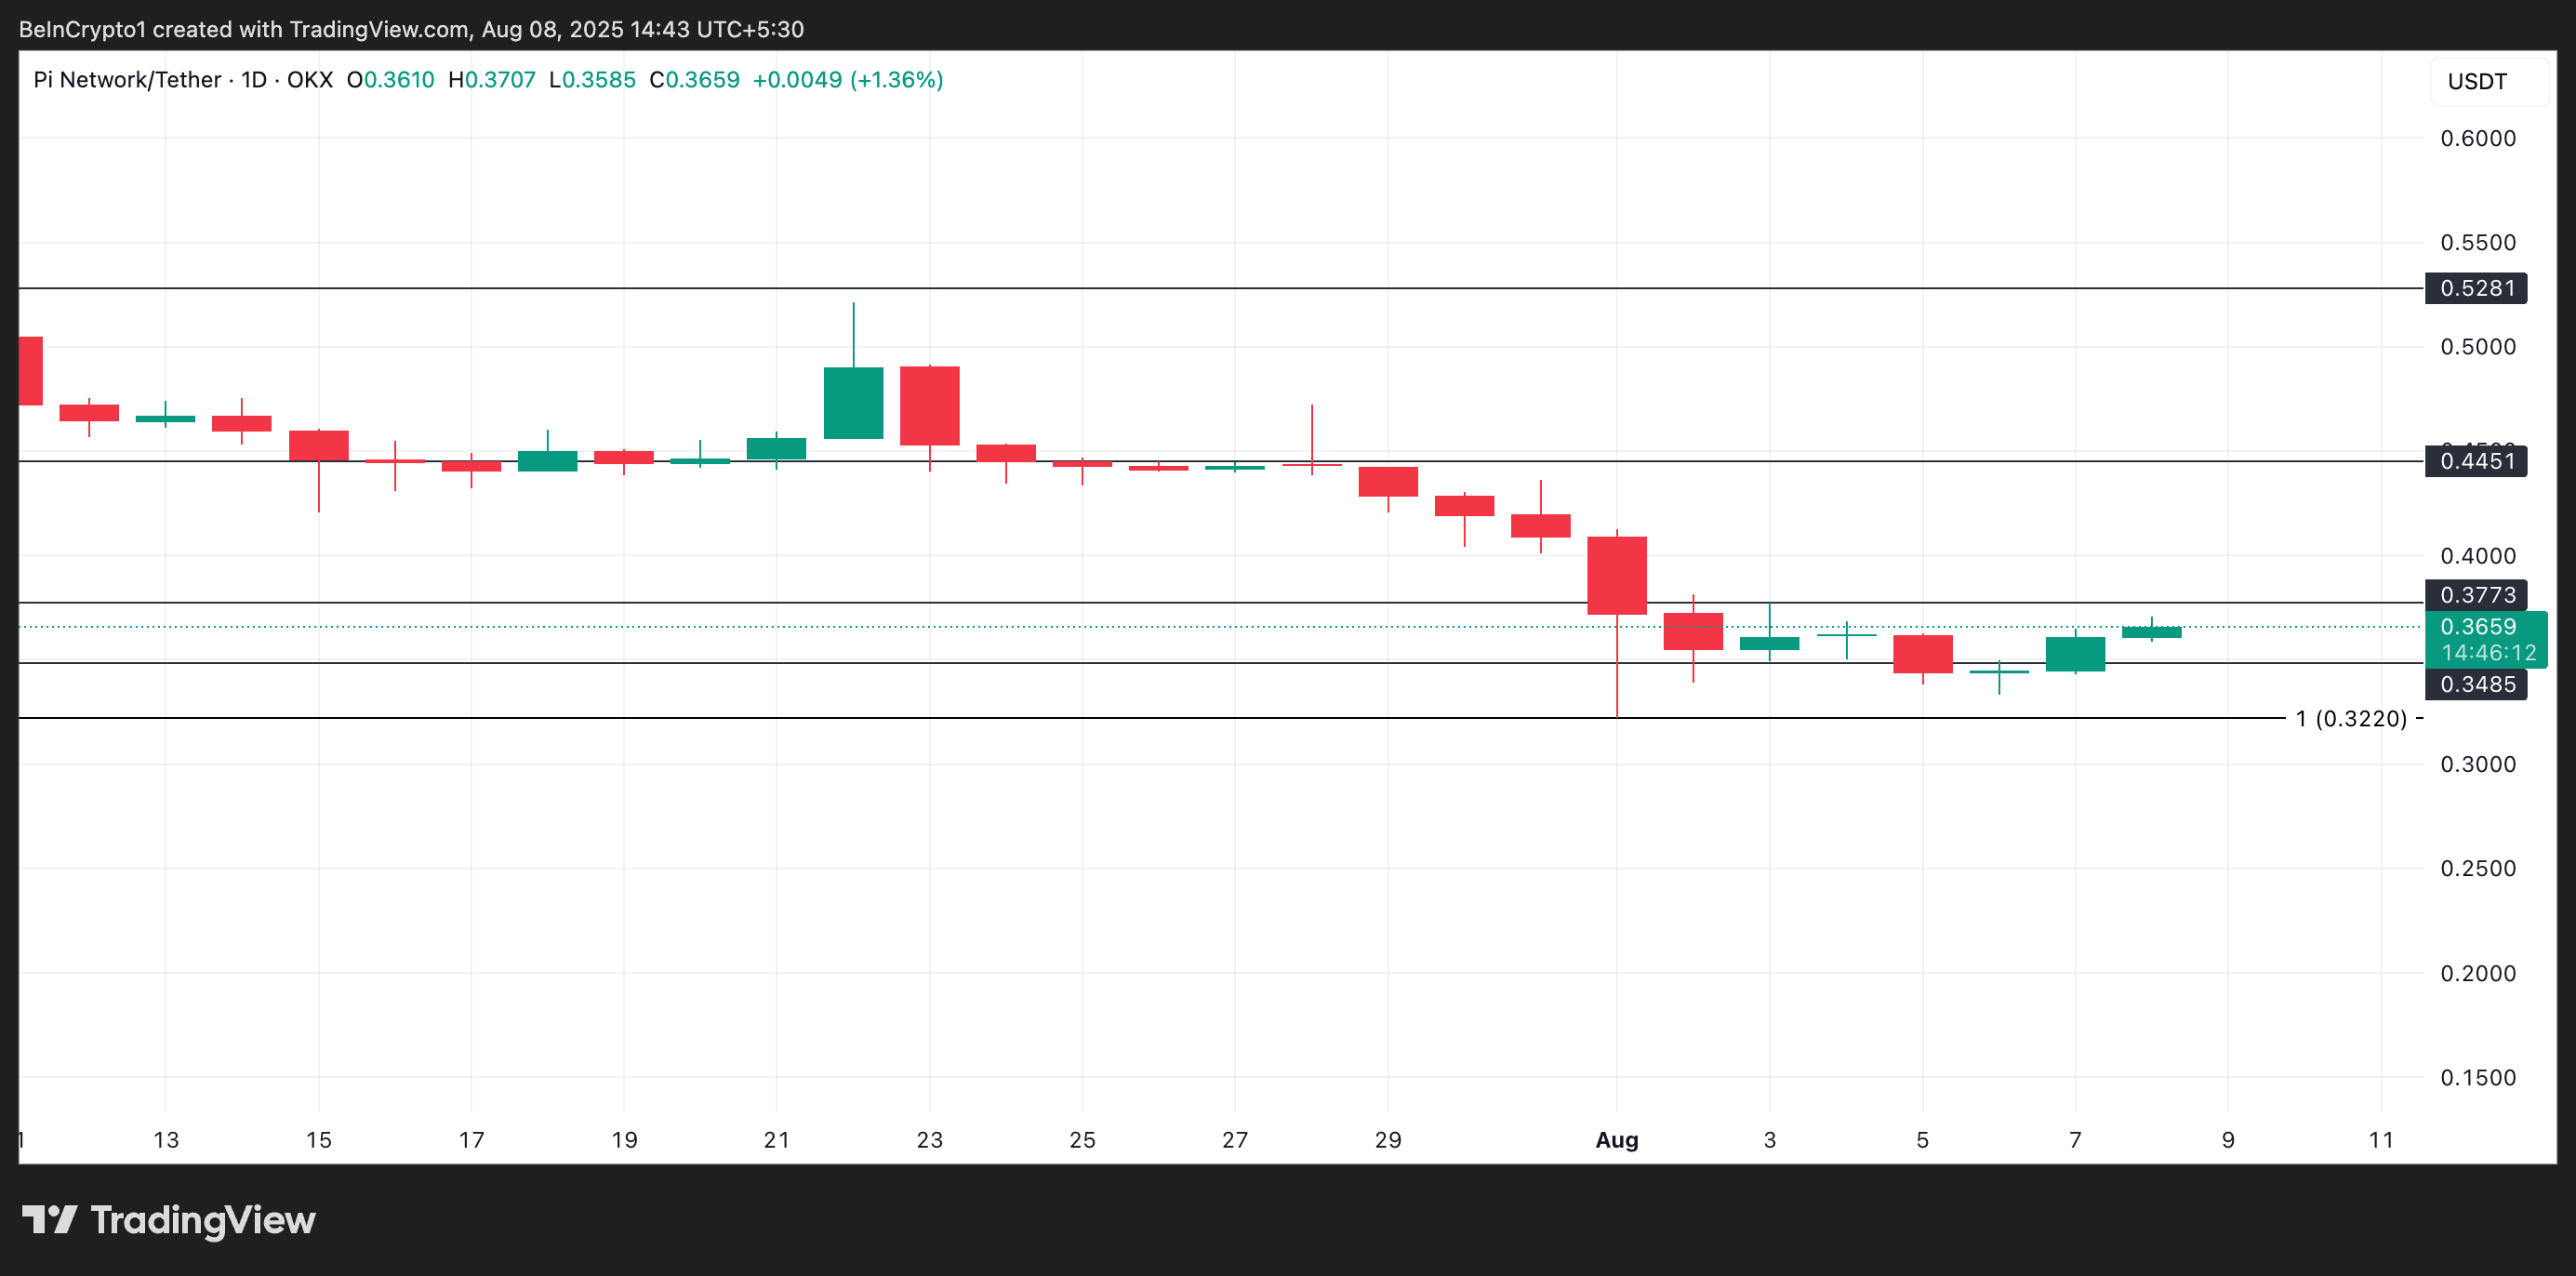
Conversely, if demand weakens again, PI could resume its sideways trend or fall under $0.34.
Disclaimer
In line with the Trust Project guidelines, this price analysis article is for informational purposes only and should not be considered financial or investment advice. BeInCrypto is committed to accurate, unbiased reporting, but market conditions are subject to change without notice. Always conduct your own research and consult with a professional before making any financial decisions. Please note that our Terms and Conditions, Privacy Policy, and Disclaimers have been updated.