


Pi Network (PI) opened August with a steep drop, hitting a new all-time low of $0.32 on August 1.
Although the altcoin has since managed a modest recovery to $0.36, bearish sentiment continues to dominate. This hints at a potential revisit to the cycle low or a steeper decline below this level over the next few weeks.
Pi Climbs 4%, But Negative Divergence Threatens Momentum
Pi’s price has bucked the broader market’s modest dip to record sizable gains today. Over the past 24 hours, the token’s price has climbed by 4%, reaching $0.36. While this short-term price increase may signal a glimmer of optimism for PI holders, technical indicators suggest that caution remains important.
First, the decline in PI’s trading volume while its price climbs over the past 24 hours is a cause for concern. Over the past day, PI’s trading volume has plummeted by nearly 30%, currently standing at around $112 million.
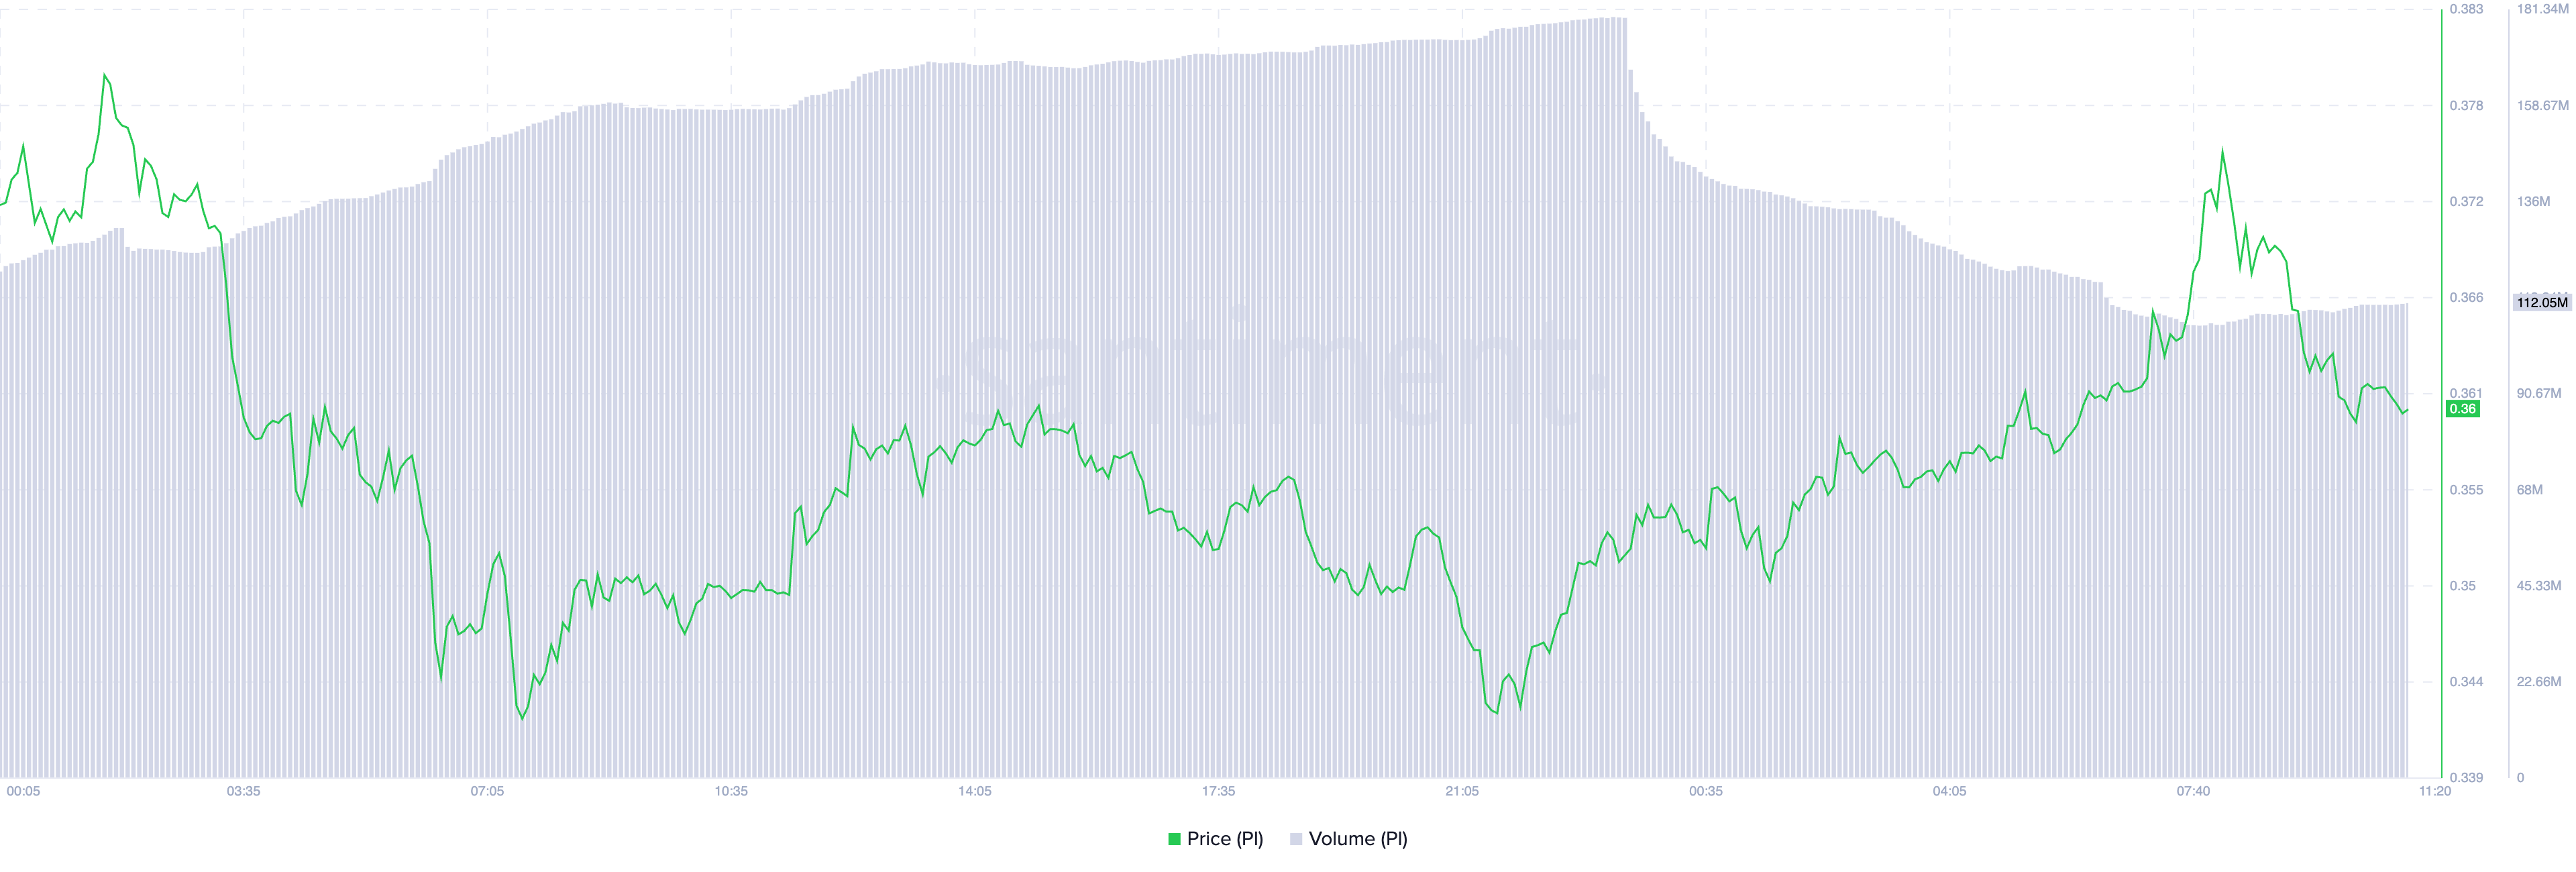
This decline in volume as price increases has created a negative divergence, which indicates that PI’s upward momentum lacks any significant backing.
Moreover, readings from PI’s Parabolic Stop and Reverse (SAR) confirm this bearish outlook. As of this writing, the dots that comprise the indicator rest above the token’s price, offering dynamic resistance at $0.47.
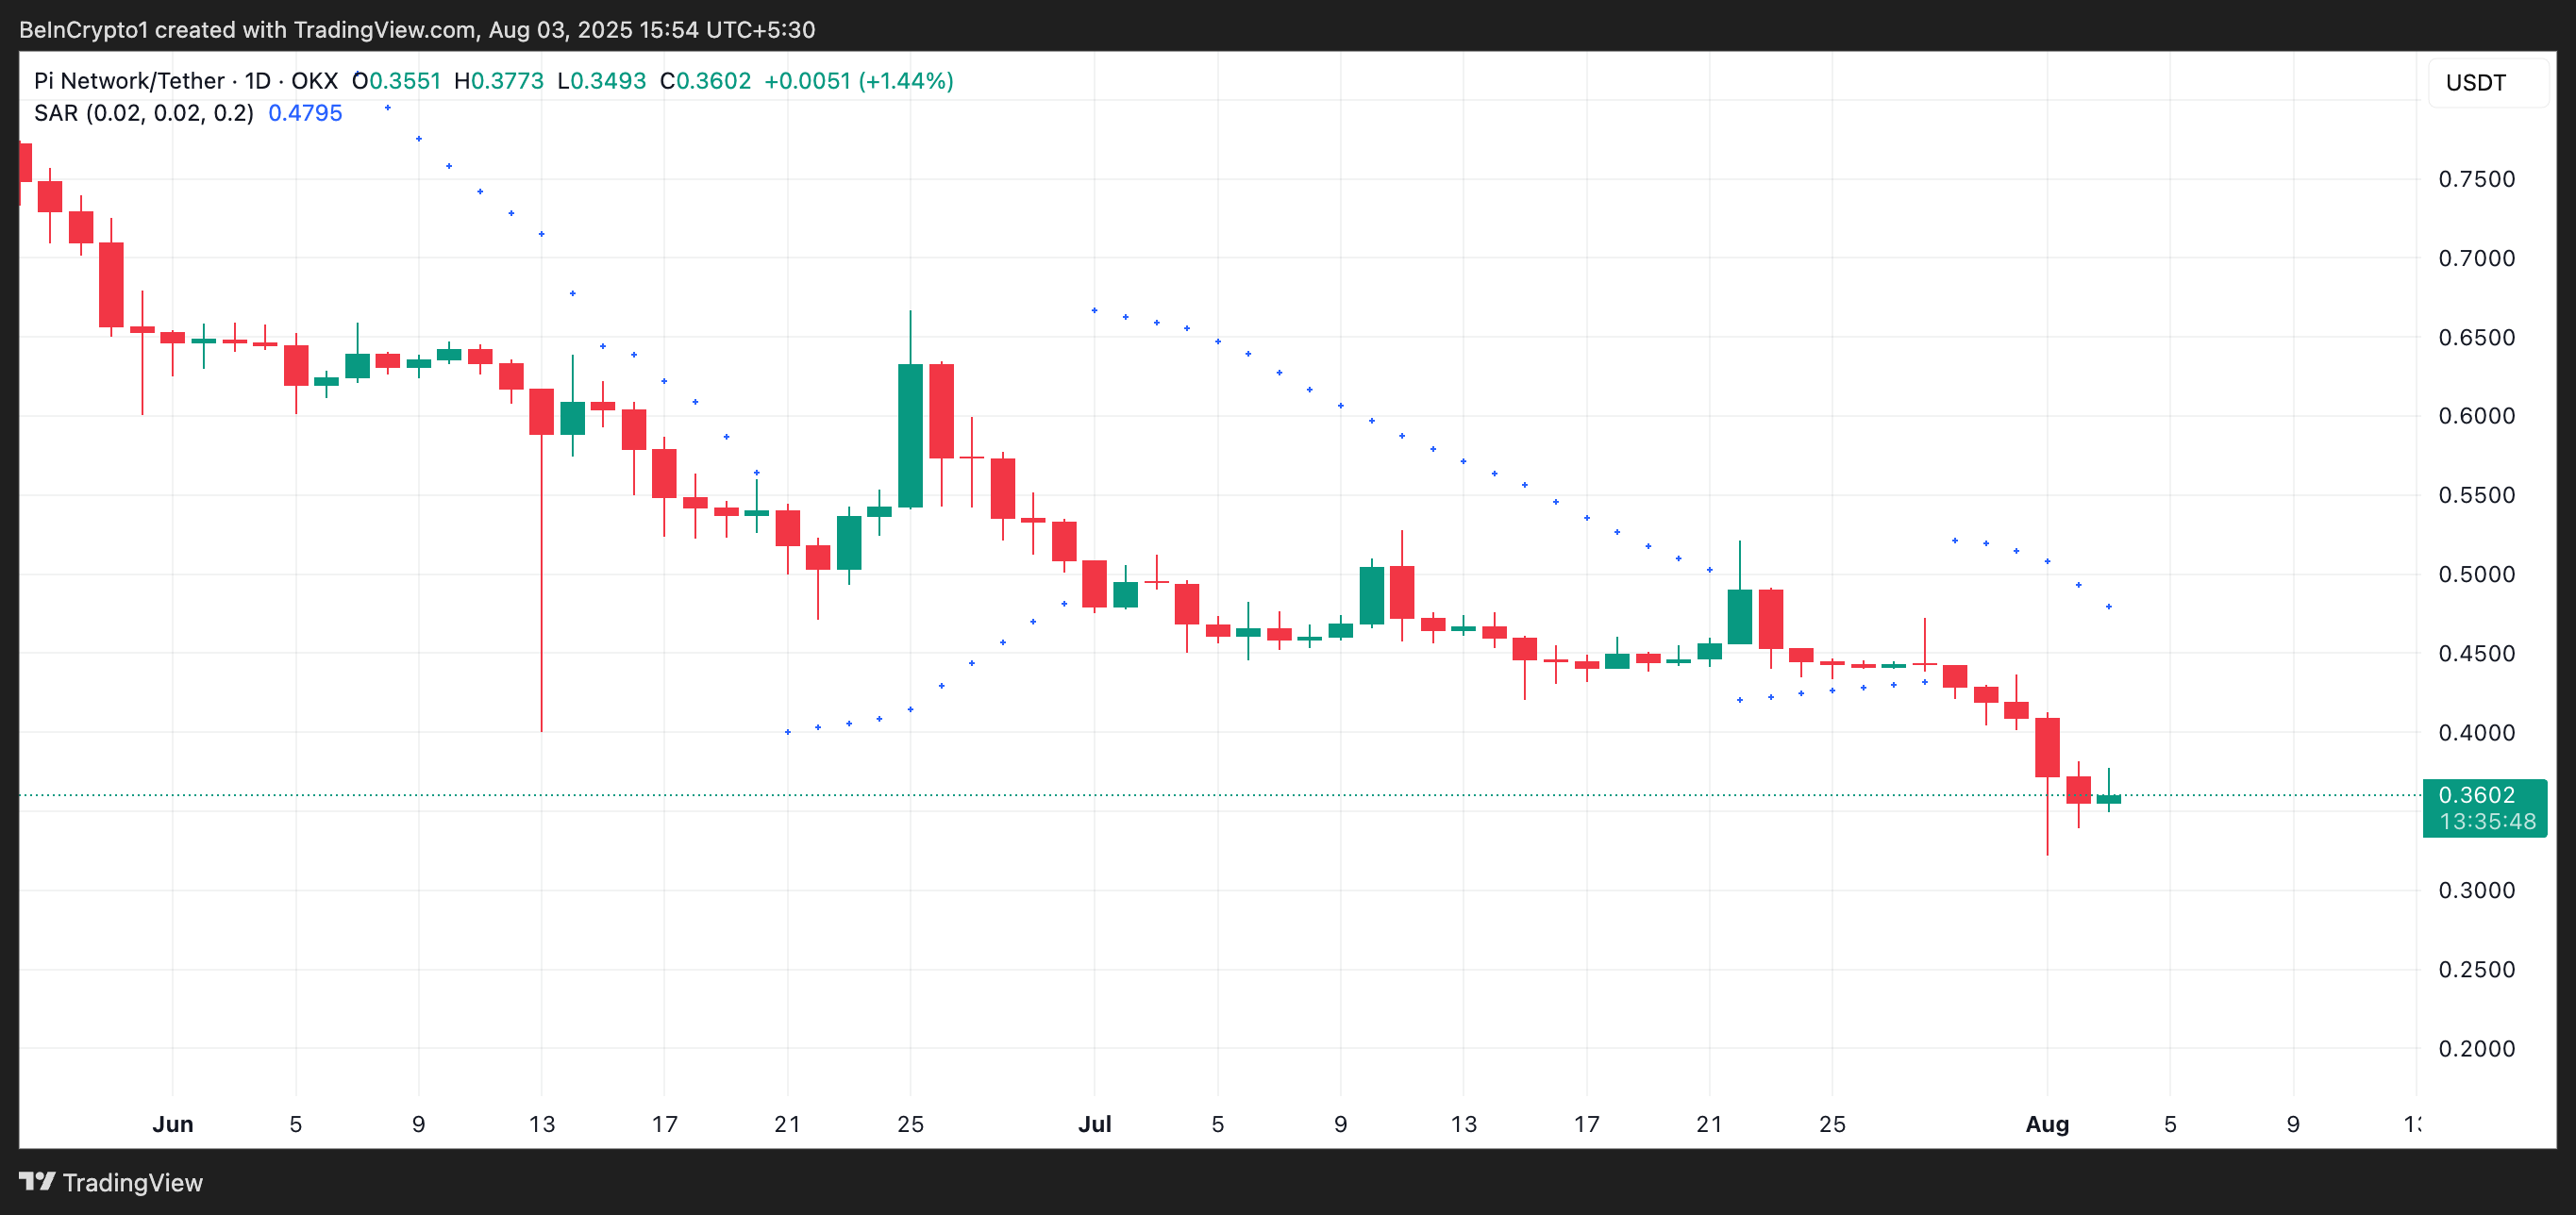
An asset’s Parabolic SAR indicator identifies potential trend direction and reversals. When its dots are placed under an asset’s price, the market is in an uptrend. It indicates that the asset is witnessing bullish momentum, and its price could continue to rally if buying persists.
On the other hand, when price rests below these dots, it signals that the market is in a downtrend. This suggests bearish momentum and potential for further PI price declines unless a bullish reversal occurs.
Bears Grip PI Near All-Time Low—Only Fresh Demand Can Save It
On the daily chart, PI oscillates between the support floor formed by its new all-time low at $0.32 and the resistance level above its price at $0.40. With the bears still in control, PI could resume its decline and attempt to reclaim its all-time low or break below it.
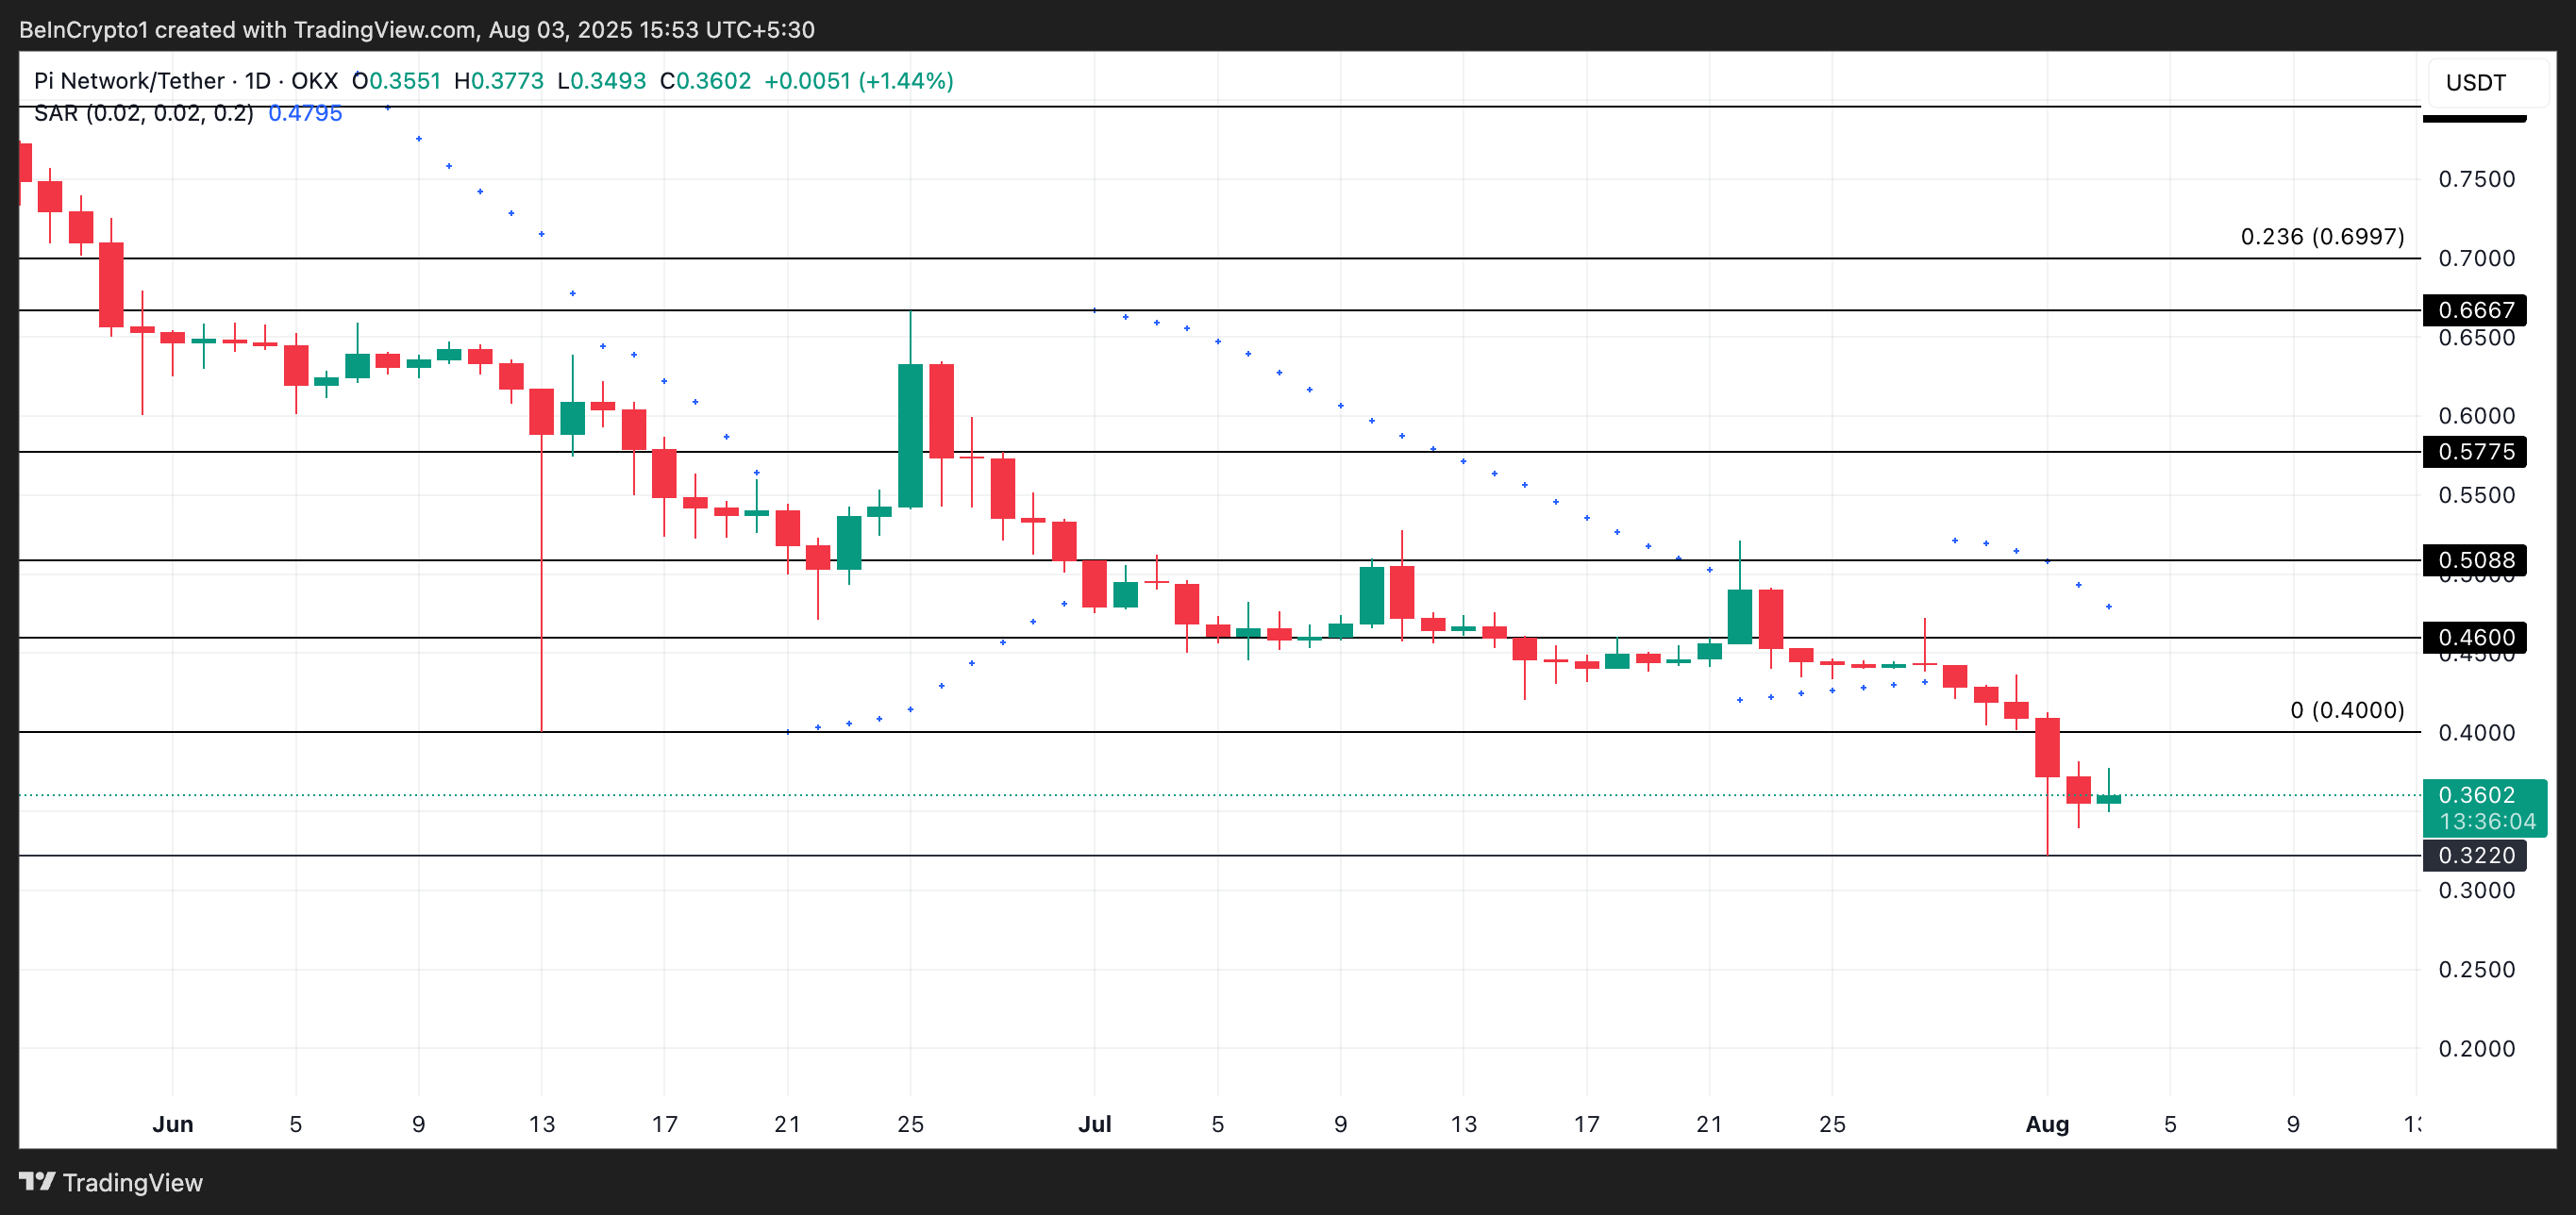
However, if new demand resurfaces, it could drive PI’s price up above $0.40, toward $0.46.



