
The Bitcoin price has increased by more than 300% since December 2018. This has caused many to believe that we are in a bullish market and compare the recent movement to prior periods in which the price increased considerably.
However, the question remains: What is the period that resembles the current price movement the most? Self-proclaimed cryptocurrency market whisperer @onemanatatime posted an interesting thought on Twitter, suggesting that the current Bitcoin price movement resembles the 2016 movement more than it does that of 2017, even though the majority is leaning towards the latter being a better predictor.
https://twitter.com/onemanatatime/status/1228687344296792065?s=19
Below, we are going to take a look at the most recent Bitcoin price movement and compare it with both 2016 & 2017 in order to see where do the similarities are more prevalent.
Bitcoin Moving Averages
Using the logarithmic chart, we can draw curved trend-lines that encompass the entire Bitcoin price movement since 2011. The price has bounced on the support line and the 200-week moving average (MA) twice, on August 2015 and December 2018, respectively 427 days have passed since the price touched the support line in December 2018. So, adding 427 days to August 2015, we arrive at the conclusion that the current price movement is similar to that in November 2016.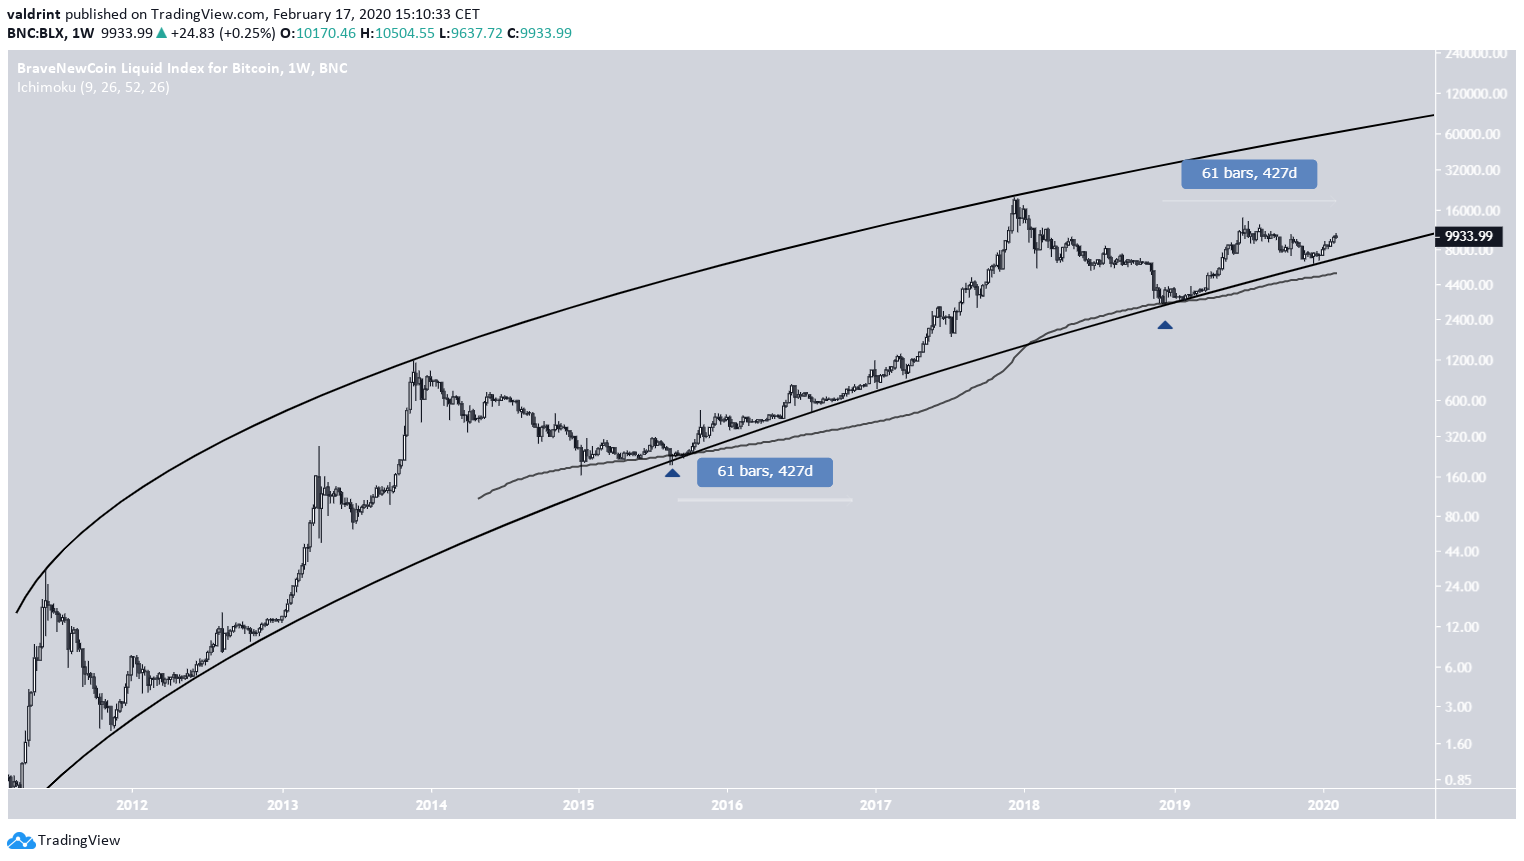
Bitcoin Halvening
The halvening angle also suggests that the current price movement is similar to that in 2016. The second halvening occurred on July 11, 2016, while the third one is projected to transpire on May 11, 2020. In addition, the increases prior to the event are similar, being 292% and 345% respectively. While the bottom occurred closer to halvening in 2016 than in 2020, the similarities are definitely there. Since there are 91 days left until halvening, the current price movement falls in line with that in April 2016, if we use the halvening dates in order to make the comparison.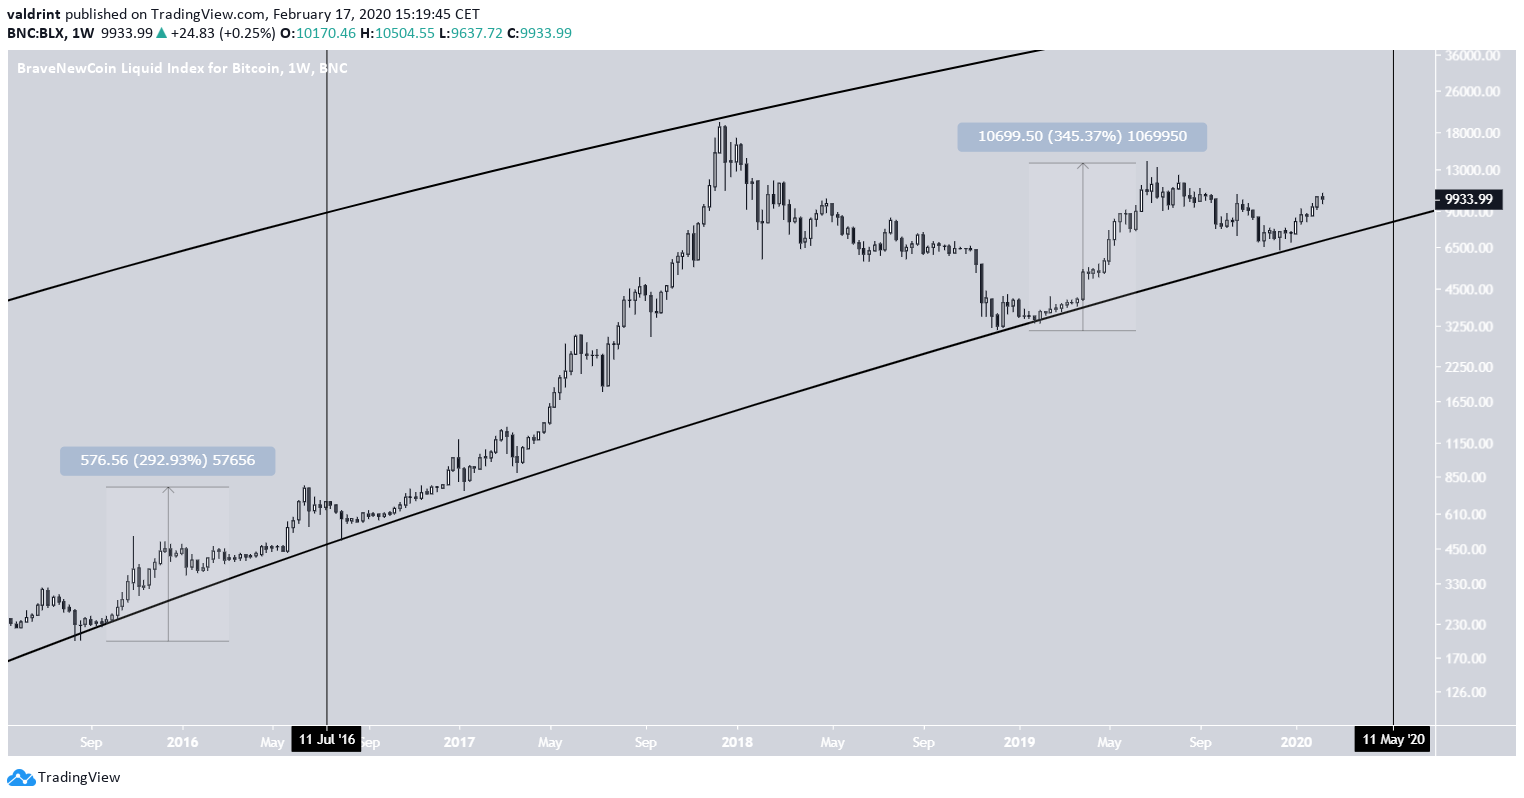
RSI Bottom
Another way to make a comparison would be by using the weekly RSI and finding the lowest values reached in each cycle. Doing so, we can see that the RSI low of 27 reached in January 2015 corresponds with that reached in December 2018. In 2015, the low was reached 413 days after the all-time high, while in 2018 it was reached 371 days afterward. Using this same ratio (1.11), we can make the assumption that the current price (791 days after the high) is at a similar place as the price in April 2016, 882 days after the previous high.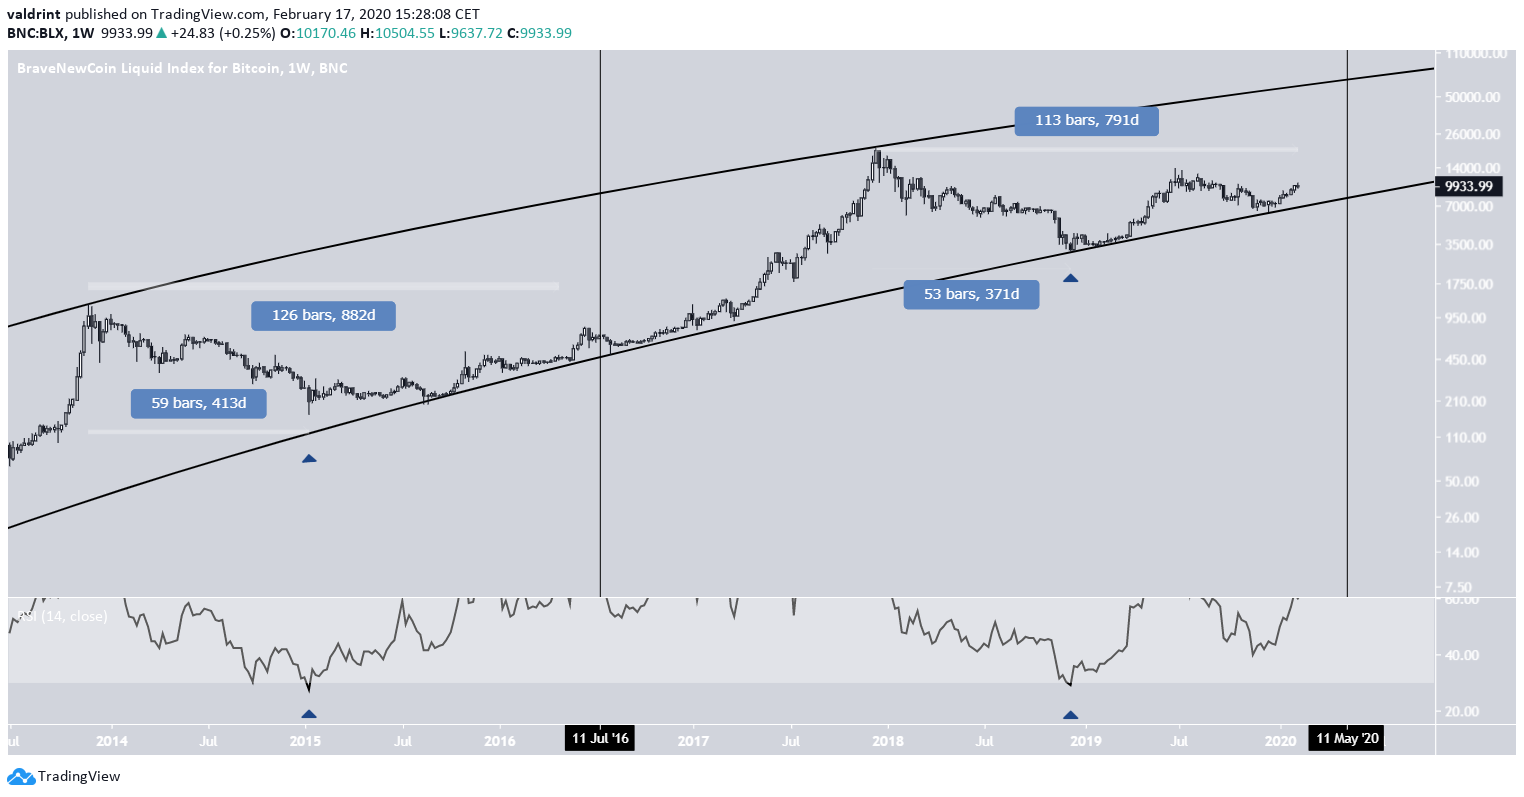
Conclusion
To conclude, if we go by moving averages, the current Bitcoin price movement is similar to that in November 2016. On the other hand, both halvening and the RSI suggest that the current price is at a similar point to where it was in April 2016. All these methods suggest that the rapid gains experienced in 2017 are still some time away.
Top crypto platforms in the US
Disclaimer
In line with the Trust Project guidelines, this price analysis article is for informational purposes only and should not be considered financial or investment advice. BeInCrypto is committed to accurate, unbiased reporting, but market conditions are subject to change without notice. Always conduct your own research and consult with a professional before making any financial decisions. Please note that our Terms and Conditions, Privacy Policy, and Disclaimers have been updated.

Valdrin Tahiri
Valdrin discovered cryptocurrencies while he was getting his MSc in Financial Markets from the Barcelona School of Economics. Shortly after graduating, he began writing for several different cryptocurrency related websites as a freelancer before eventually taking on the role of BeInCrypto's Senior Analyst.
(I do not have a discord and will not contact you first there. Beware of scammers)
READ FULL BIO
Sponsored
Sponsored