Highlights
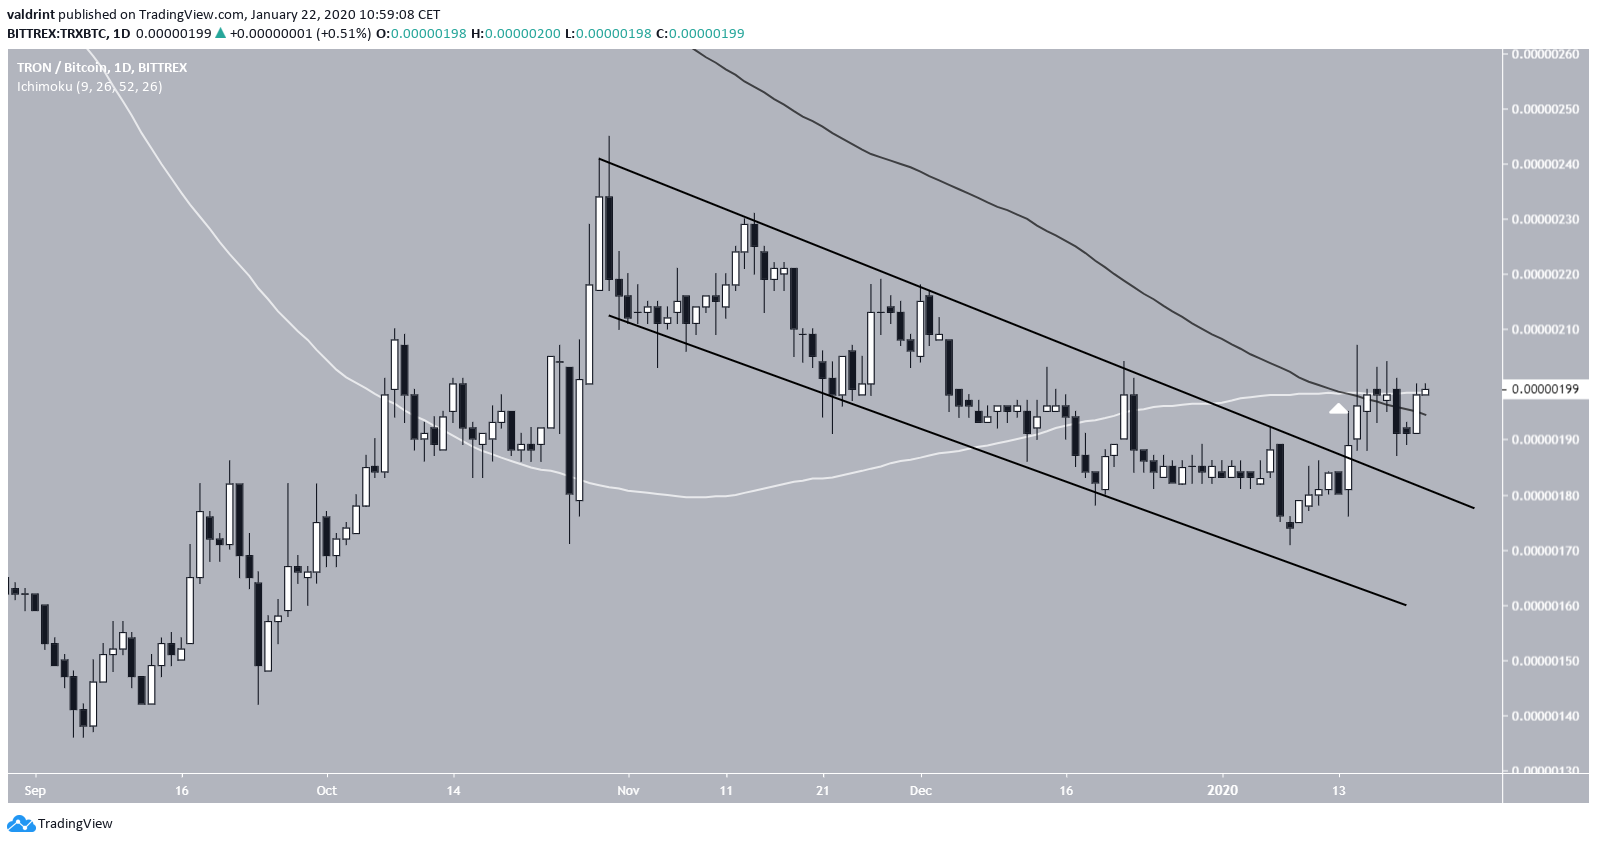
- TRON broke out from a descending channel.
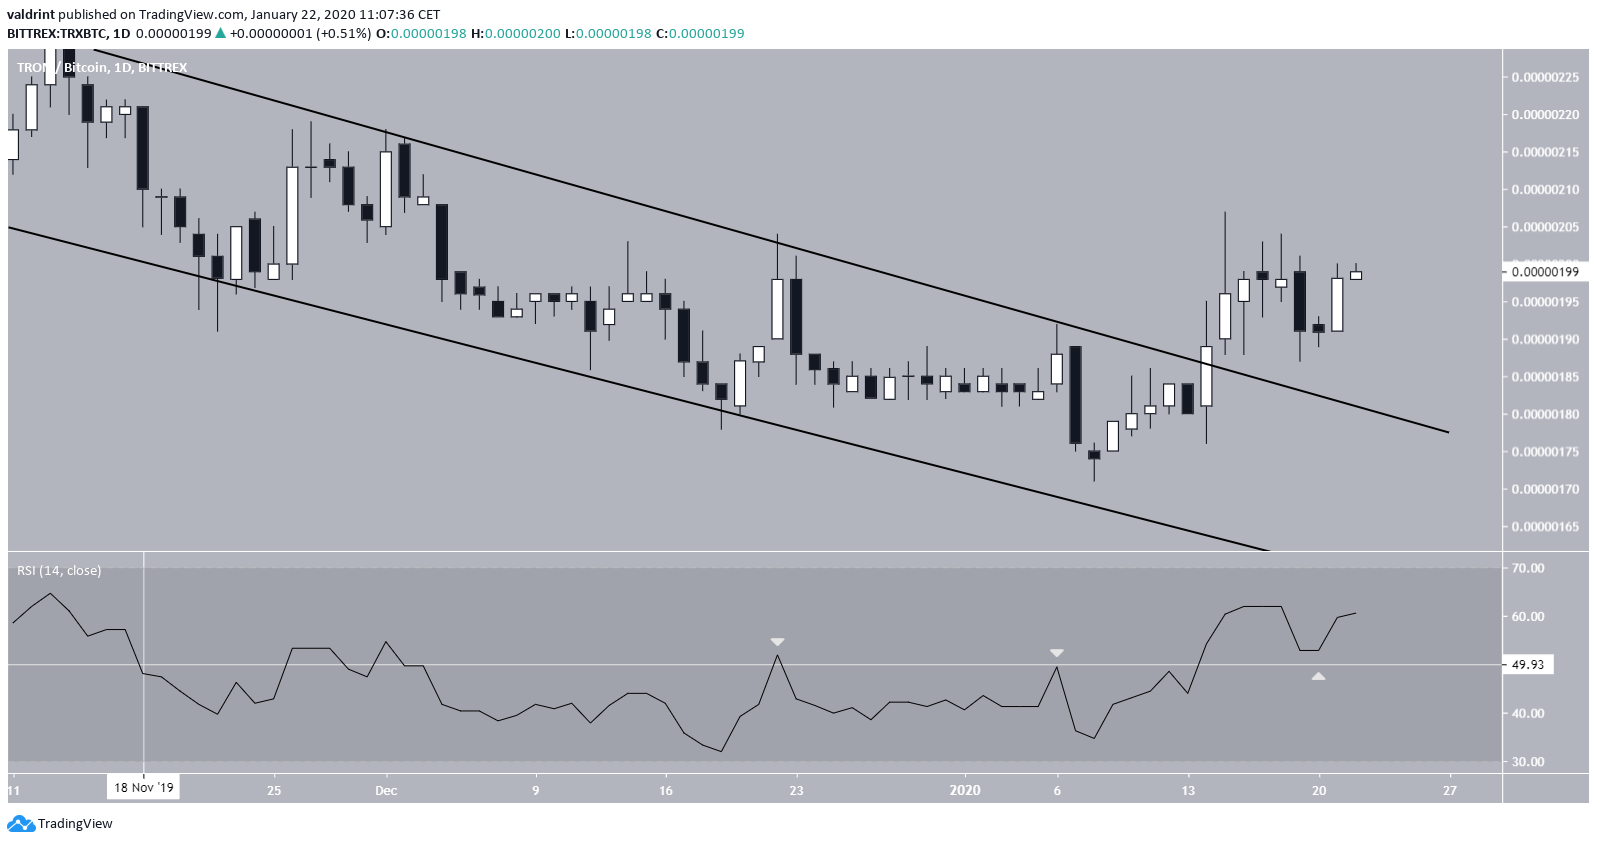
- The RSI supports the legitimacy of the breakout.
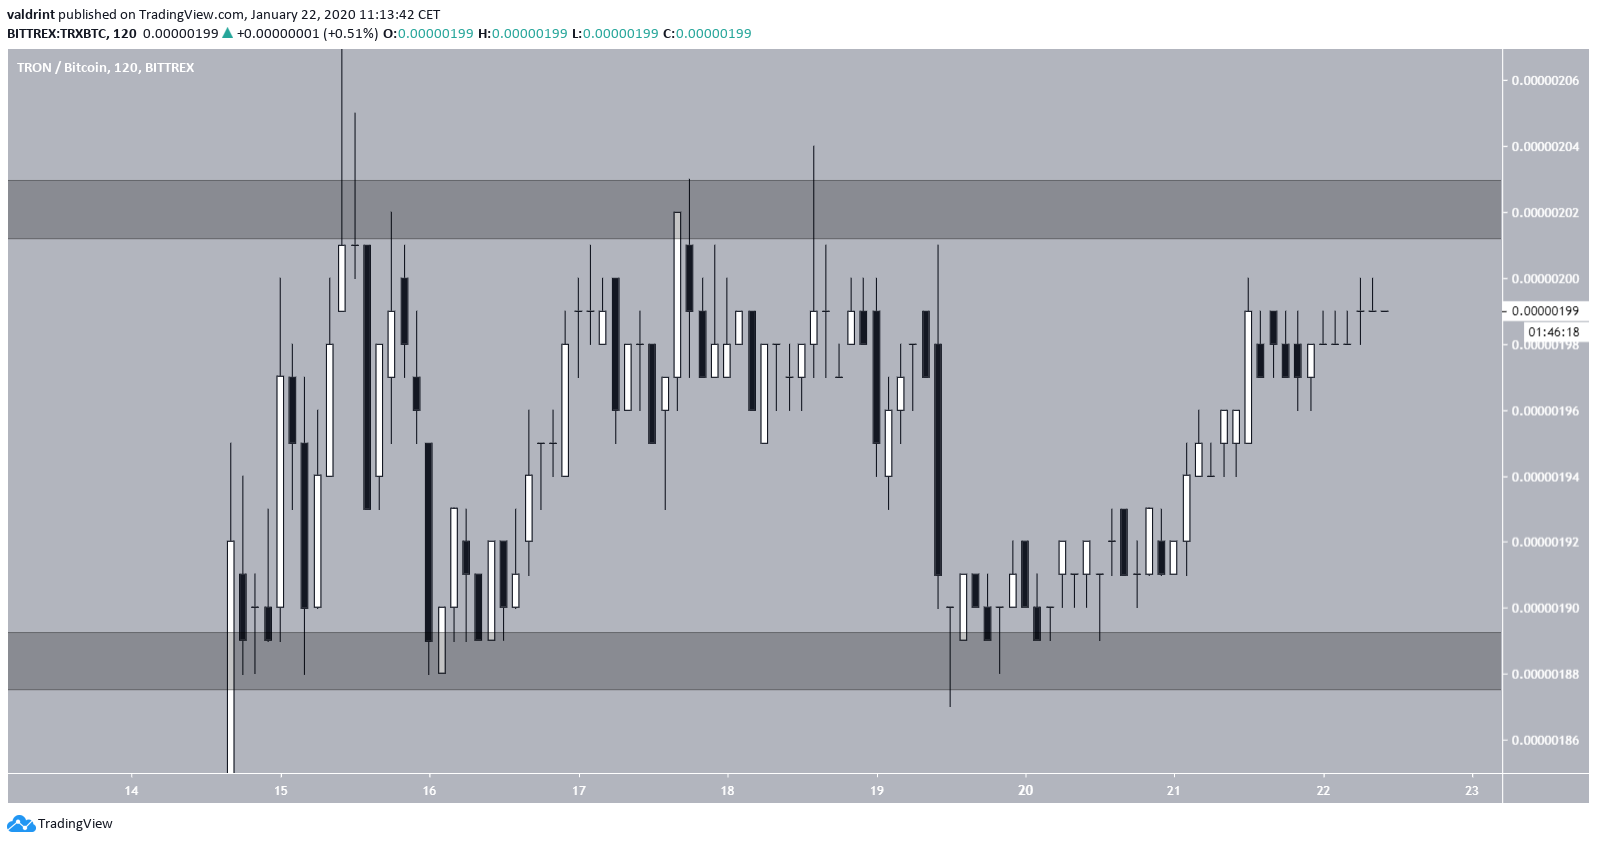
- The price is trading inside a short-term range of 188-202 satoshis.
- There is resistance at 245 satoshis.
Will the TRX price begin such a rally?$TRX Weekly:
— Bagsy (@imBagsy) January 21, 2020
I think we're likely to get a retest of 246 from here.
I don't think we'll break out of this range on the second try however (I'll likely be short at the range high). pic.twitter.com/hup4pjlS6A
TRON Channel Breakout
On October 30, 2019, the TRX price reached a high of 245 satoshis and began to decrease. This high is used for the target given in a tweet. The decrease took the form of a descending channel, out of which the price broke out on January 14, 2020. If the price were to retrace all the way to the beginning of the channel, it would reach the given target. Its relationship to the 100- and 200-day moving averages (MAs) can help considerably in determining the possibility that the price will get there. The aforementioned MAs have made a bullish cross, but the price is struggling to trade above them, facing very close resistance from the 100-day one. A clean flip above the MA resistance would indicate that the price is heading towards 245 sats. The RSI movement confirms the validity of the breakout. On December 22 and January 6, the RSI failed to move above the midpoint (50) line. It has been trading below this line since November 18, 2019, indicating that the price is in a downward trend.
However, the RSI was successful in breaking out above the midpoint line on January 14 — the same day the breakout from the channel occurred and has validated it as support afterward.
Since the RSI has moved above 50 and its movement is mirroring that of the price, we can assume that the breakout is legitimate.

Short-Term Movement
In the short-term, the TRON price is trading in a range between 188 and 202 satoshis — having validated both areas several times. Currently, it is trading very close to the resistance area. Since we believe the price will eventually break out, initiating a long setup so close to the resistance area does not offer an exceptional R:R ratio. If the price were to continue consolidating inside this range, initiating a long near 190 sats with a stop loss below the support of the range at 185 sats would be much more enticing.
Future TRON Movement
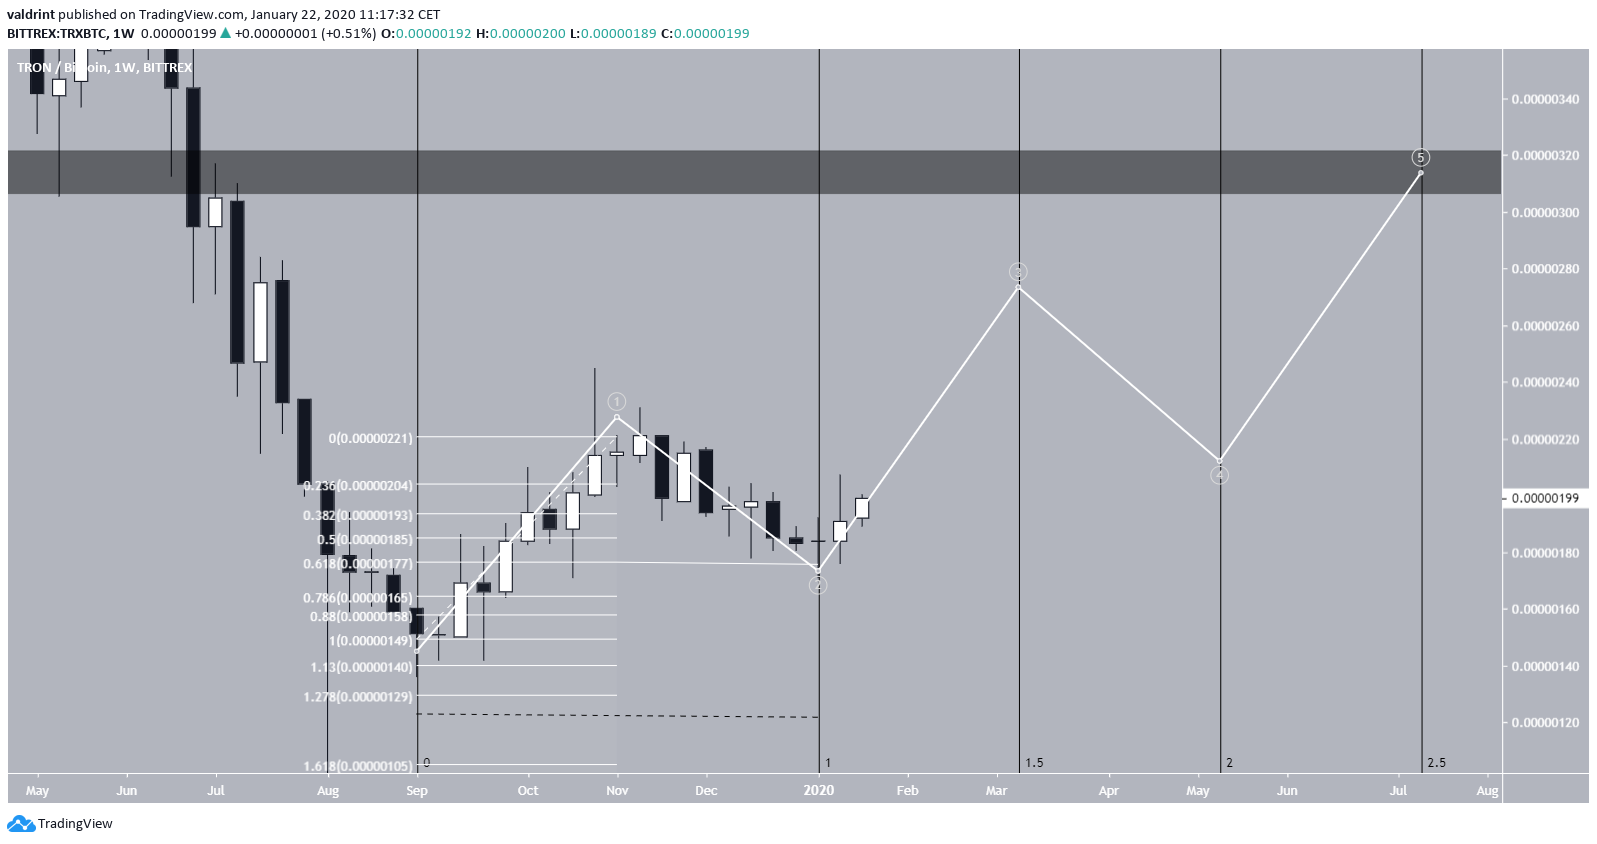
In the long-term, we can assume that the channel breakout marked the end of the second out of a five-wave formation, which was corrective. A rough outline of a five-wave Elliott formation would take the price near 270 satoshis by the end of the third wave before the formation is completed at 320 satoshis. The final target could be reached by the middle of July. To conclude, the TRX price broke out from a descending channel, indicating that it has ended its current correction. The validity of the breakout is supported by RSI and would be confirmed by a flip of the 100-day MAs. A long-term target for the price is given at 320 satoshis, which will possibly be reached by July.
Disclaimer
In line with the Trust Project guidelines, this price analysis article is for informational purposes only and should not be considered financial or investment advice. BeInCrypto is committed to accurate, unbiased reporting, but market conditions are subject to change without notice. Always conduct your own research and consult with a professional before making any financial decisions. Please note that our Terms and Conditions, Privacy Policy, and Disclaimers have been updated.

