
Hyperliquid (HYPE) is under pressure, down 16% over the past seven days as technical indicators increasingly point toward bearish control. Momentum has weakened sharply, with the Relative Strength Index (RSI) dropping below 40 and showing no signs of strong buying interest since late March.
At the same time, the Directional Movement Index (DMI) shows sellers gaining dominance, with a rising ADX suggesting a potential strengthening of the downtrend. As HYPE approaches key support levels, the market now waits to see if bulls can mount a recovery—or if further downside is ahead.
Hyperliquid DMI Shows Sellers Are In Control
According to its Directional Movement Index (DMI), Hyperliquid is showing early signs of a developing trend, with the Average Directional Index (ADX) rising from 21.5 to 23.6.
The ADX measures the strength of a trend regardless of its direction. Readings below 20 typically indicate a weak or range-bound market, while values above 25 suggest the presence of a strong trend.
With the current ADX moving closer to that 25 threshold, it suggests that trend strength is building—but hasn’t fully confirmed yet—indicating that traders should be on alert for potential continuation in price action.
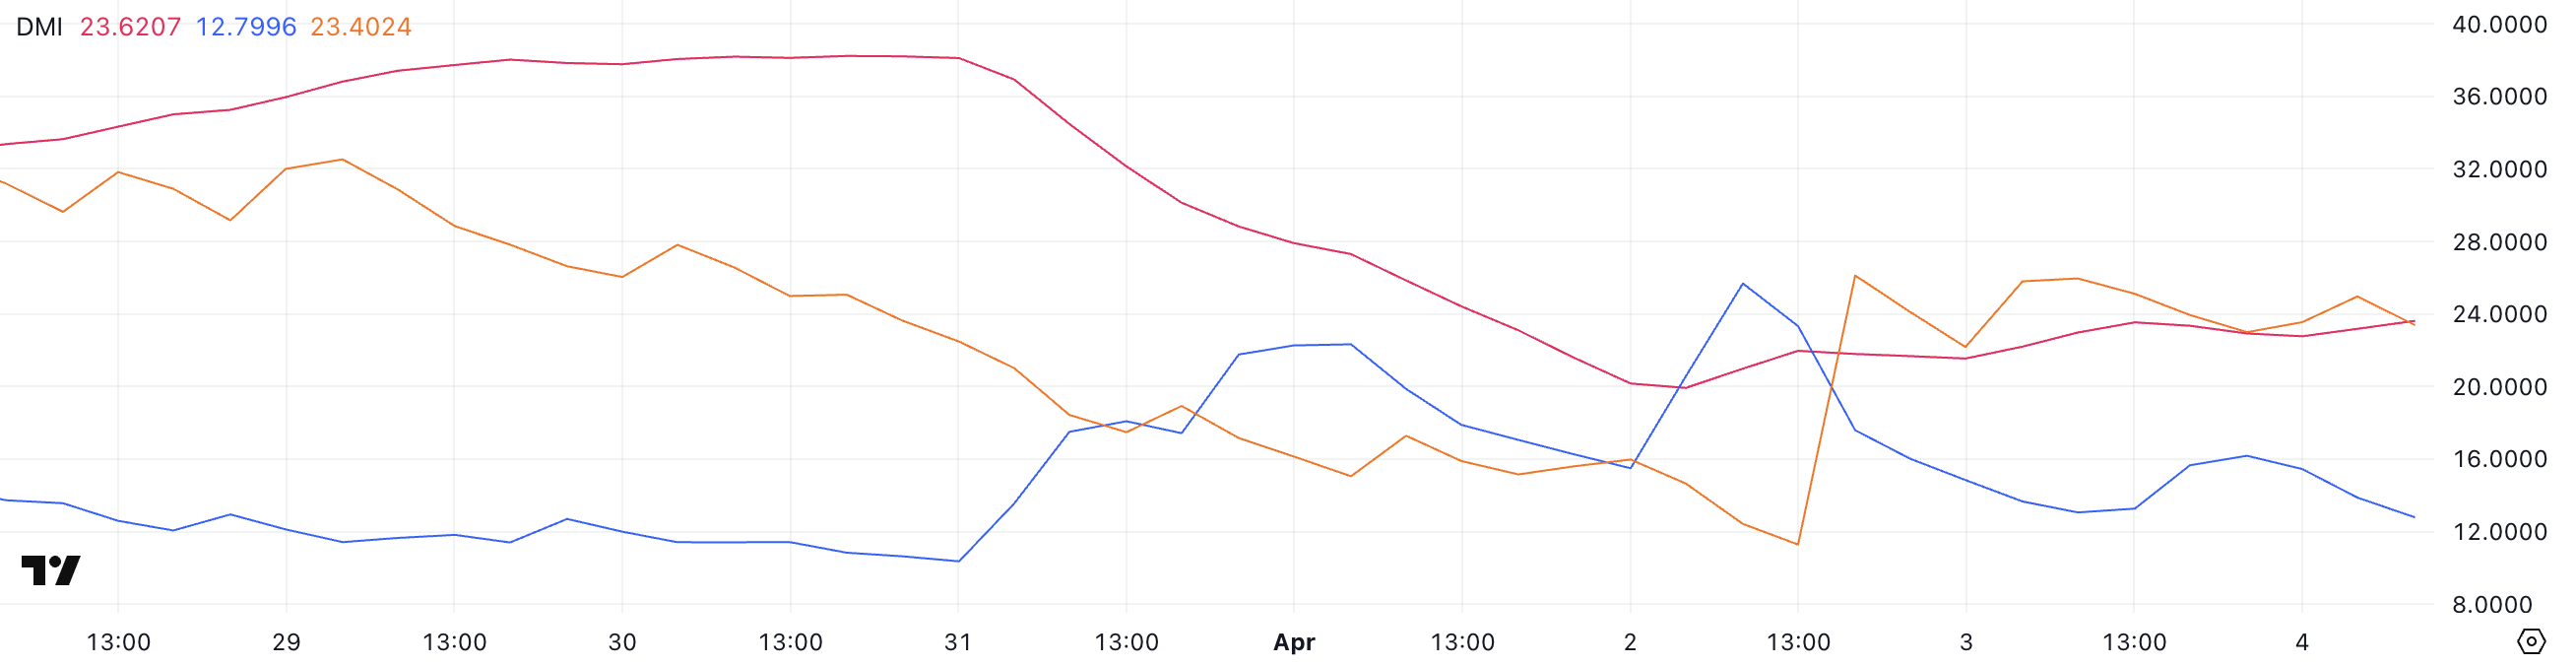
Meanwhile, the +DI and -DI lines, which represent bullish and bearish directional movement, respectively, have shifted significantly.
The +DI has dropped sharply from 25.68 to 12.79, while the -DI has surged from 11.29 to 23.4, indicating that bearish momentum has clearly overtaken bullish pressure. This shift suggests that sellers are gaining control of the market, and unless the +DI line can reverse and regain ground, HYPE could be at risk of further downside.
If the current dynamics continue, this, combined with the rising ADX, could signal the start of a stronger bearish trend.
Hyperliquid RSI Shows The Lack Of Buying Momentum
Hyperliquid has seen its Relative Strength Index (RSI) fall significantly over the past two days, dropping from 63.03 to 39.39.
The RSI is a momentum oscillator that measures the speed and magnitude of recent price changes, ranging from 0 to 100.
Readings above 70 typically indicate that an asset is overbought and may be due for a correction, while readings below 30 suggest it is oversold and could be primed for a rebound. Levels between 30 and 70 are considered neutral, but directional shifts within this range often reflect changing momentum.
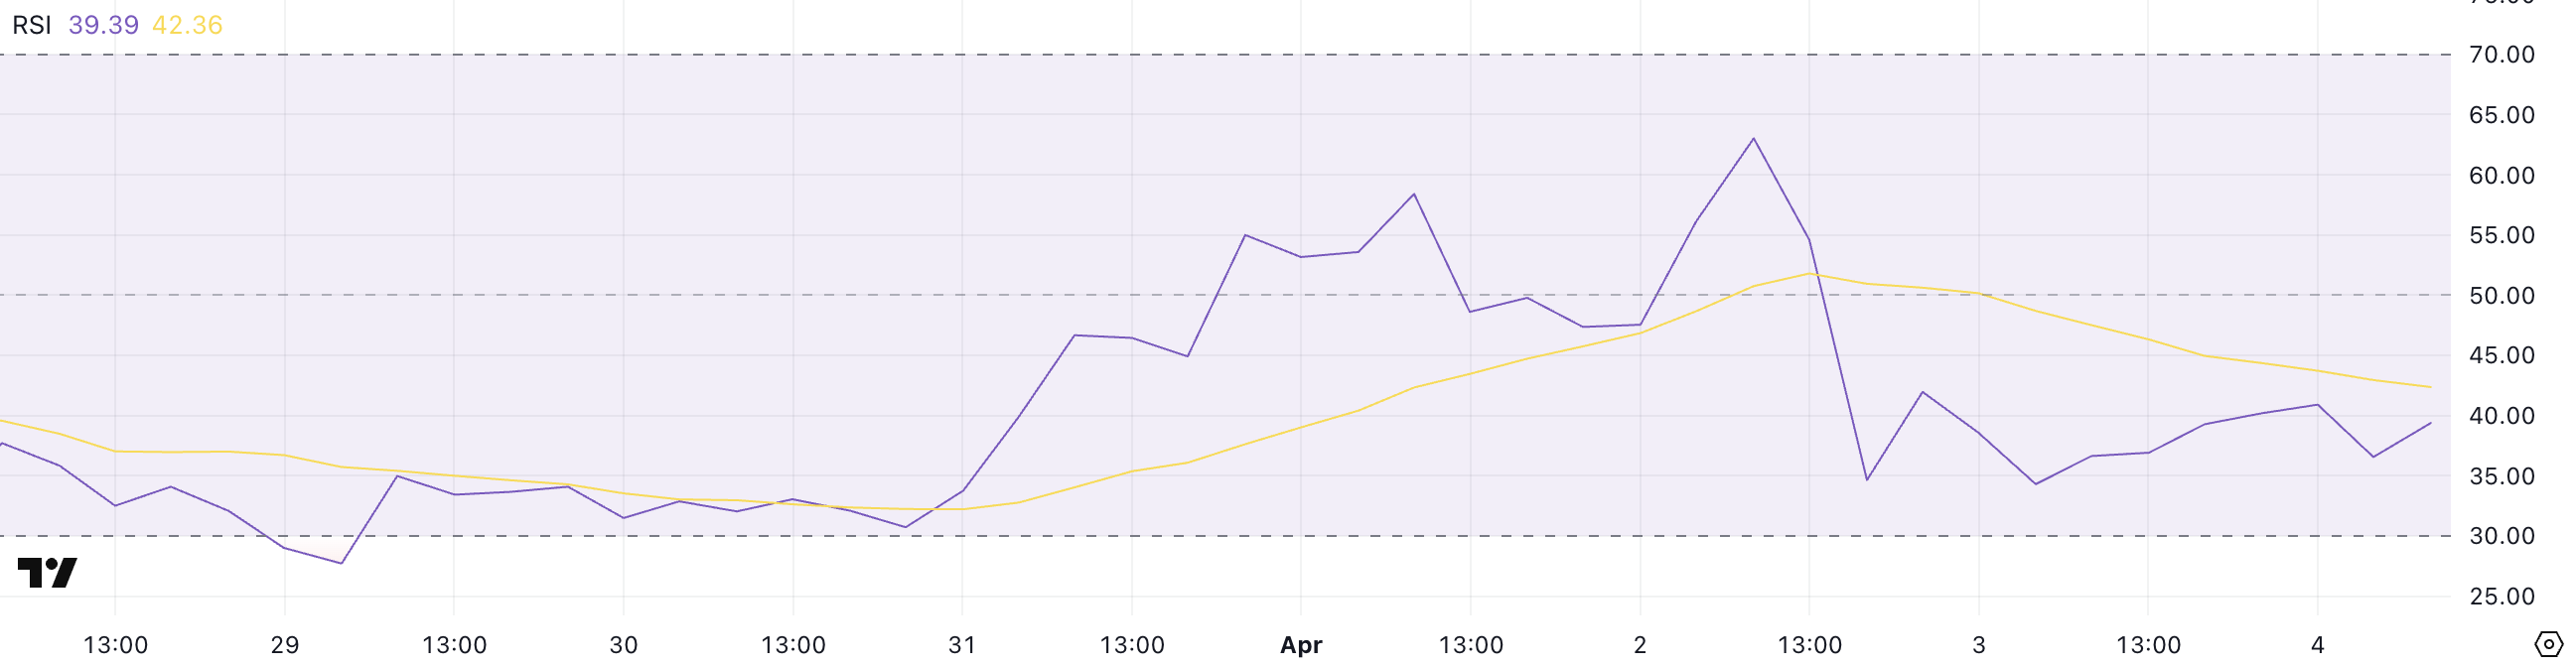
With HYPE’s RSI now sitting at 39.39, the indicator suggests weakening bullish momentum and growing bearish pressure. The fact that the RSI hasn’t touched or exceeded the 70 mark since March 24 signals a lack of strong buying conviction in recent weeks.
This downward trend in RSI may indicate that the market is cooling off. Unless buyers step in to reverse this trajectory, HYPE could continue to face selling pressure.
If the RSI continues to drift toward 30, it would raise the possibility of further downside or consolidation in the short term.
Will Hyperliquid Fall Below $11 Soon?
Hyperliquid price is currently at an important threshold, with action leaning bearish but potential for a rebound still on the table.
If the current downtrend continues, HYPE could soon dip below the $11 mark.
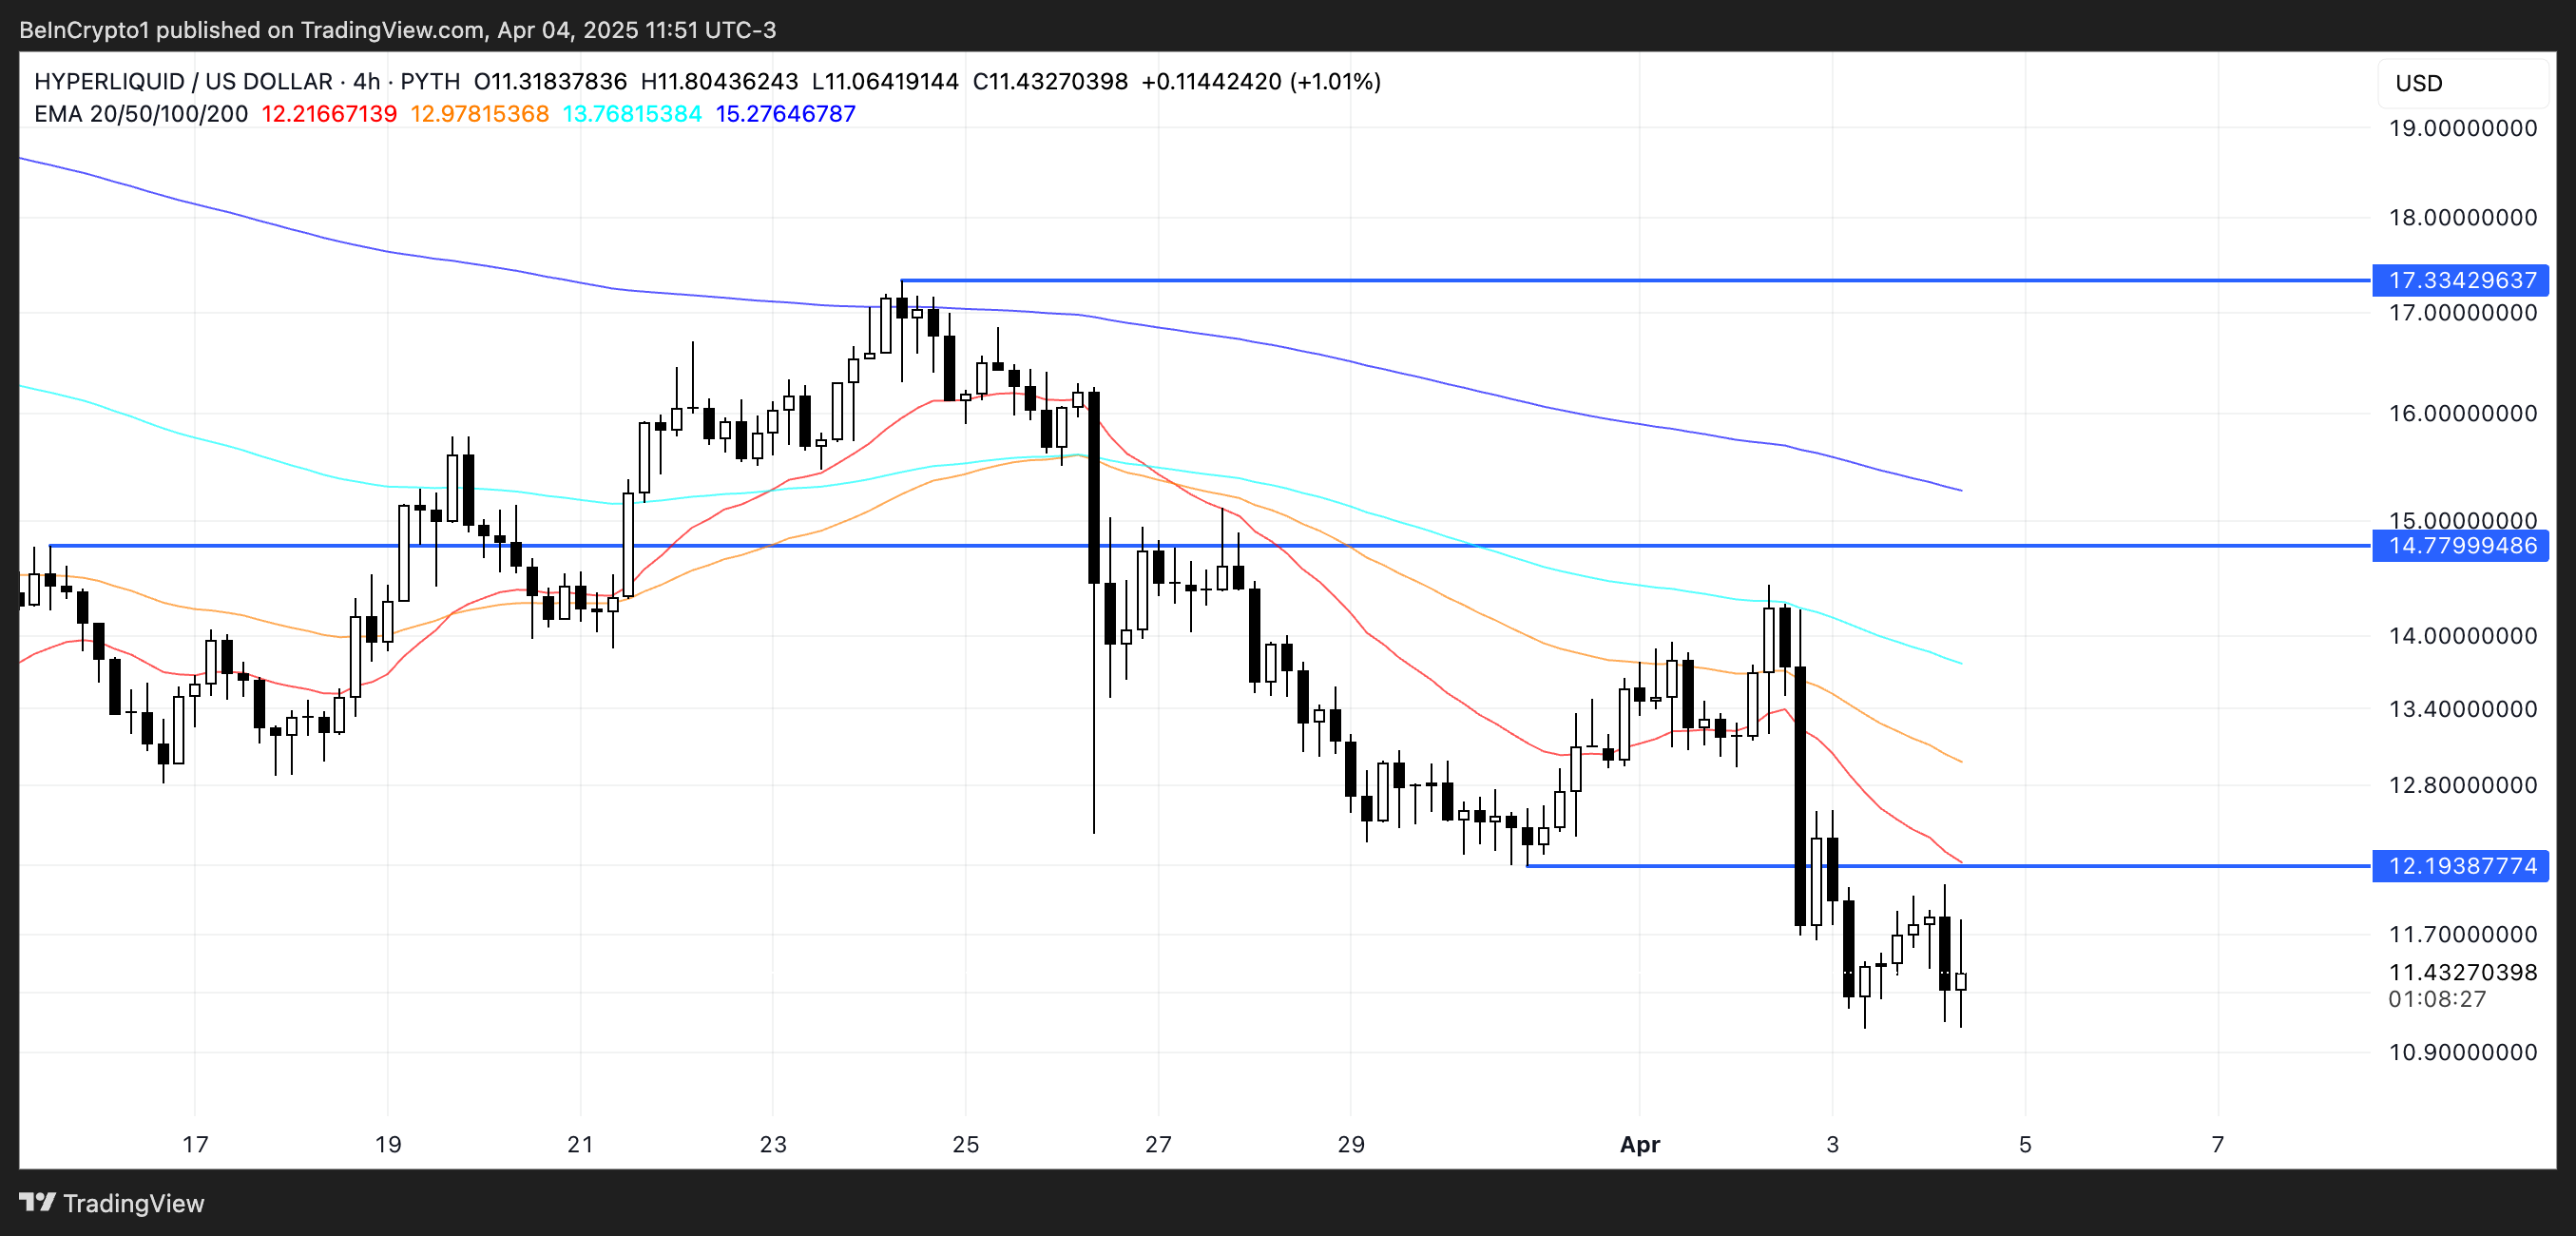
This would align with the recent drop in momentum indicators like the RSI and the growing bearish pressure seen in directional movement data.
However, if buyers manage to step in and shift momentum, HYPE could attempt to reclaim higher levels. A break above the immediate resistance at $12.19 would be the first sign of recovery, potentially opening the door for a move toward $14.77.
If bullish momentum accelerates, the rally could extend as far as $17.33, which would mark a full reversal of the current bearish structure.
Disclaimer
In line with the Trust Project guidelines, this price analysis article is for informational purposes only and should not be considered financial or investment advice. BeInCrypto is committed to accurate, unbiased reporting, but market conditions are subject to change without notice. Always conduct your own research and consult with a professional before making any financial decisions. Please note that our Terms and Conditions, Privacy Policy, and Disclaimers have been updated.